
|
|||||
|
 | |
| |
| |
| |
| |
| |
|
Gene: LDAH |
Gene summary for LDAH |
| Gene information | Species | Human | Gene symbol | LDAH | Gene ID | 60526 |
| Gene name | lipid droplet associated hydrolase | |
| Gene Alias | C2orf43 | |
| Cytomap | 2p24.1 | |
| Gene Type | protein-coding | GO ID | GO:0006629 | UniProtAcc | A0A0A0MSH6 |
Top |
Malignant transformation analysis |
| Identification of the aberrant gene expression in precancerous and cancerous lesions by comparing the gene expression of stem-like cells in diseased tissues with normal stem cells |
| Entrez ID | Symbol | Replicates | Species | Organ | Tissue | Adj P-value | Log2FC | Malignancy |
| 60526 | LDAH | LZE4T | Human | Esophagus | ESCC | 1.26e-07 | 2.05e-01 | 0.0811 |
| 60526 | LDAH | LZE7T | Human | Esophagus | ESCC | 2.76e-06 | 2.67e-01 | 0.0667 |
| 60526 | LDAH | LZE24T | Human | Esophagus | ESCC | 2.56e-09 | 1.61e-01 | 0.0596 |
| 60526 | LDAH | P2T-E | Human | Esophagus | ESCC | 8.95e-20 | 3.98e-01 | 0.1177 |
| 60526 | LDAH | P4T-E | Human | Esophagus | ESCC | 1.72e-15 | 2.87e-01 | 0.1323 |
| 60526 | LDAH | P5T-E | Human | Esophagus | ESCC | 3.04e-06 | 1.07e-01 | 0.1327 |
| 60526 | LDAH | P8T-E | Human | Esophagus | ESCC | 6.16e-09 | 2.32e-01 | 0.0889 |
| 60526 | LDAH | P10T-E | Human | Esophagus | ESCC | 2.91e-13 | 1.82e-01 | 0.116 |
| 60526 | LDAH | P11T-E | Human | Esophagus | ESCC | 1.10e-02 | 1.45e-01 | 0.1426 |
| 60526 | LDAH | P12T-E | Human | Esophagus | ESCC | 4.51e-10 | 2.37e-01 | 0.1122 |
| 60526 | LDAH | P15T-E | Human | Esophagus | ESCC | 2.87e-07 | 1.64e-01 | 0.1149 |
| 60526 | LDAH | P16T-E | Human | Esophagus | ESCC | 2.39e-08 | 1.95e-01 | 0.1153 |
| 60526 | LDAH | P17T-E | Human | Esophagus | ESCC | 1.82e-02 | 1.73e-01 | 0.1278 |
| 60526 | LDAH | P20T-E | Human | Esophagus | ESCC | 2.57e-12 | 2.68e-01 | 0.1124 |
| 60526 | LDAH | P21T-E | Human | Esophagus | ESCC | 4.17e-05 | 1.24e-01 | 0.1617 |
| 60526 | LDAH | P22T-E | Human | Esophagus | ESCC | 1.88e-11 | 2.17e-01 | 0.1236 |
| 60526 | LDAH | P23T-E | Human | Esophagus | ESCC | 1.40e-12 | 2.93e-01 | 0.108 |
| 60526 | LDAH | P24T-E | Human | Esophagus | ESCC | 3.75e-03 | 9.91e-02 | 0.1287 |
| 60526 | LDAH | P26T-E | Human | Esophagus | ESCC | 1.47e-14 | 2.53e-01 | 0.1276 |
| 60526 | LDAH | P27T-E | Human | Esophagus | ESCC | 1.30e-15 | 3.15e-01 | 0.1055 |
| Page: 1 2 3 |
| Tissue | Expression Dynamics | Abbreviation |
| Esophagus | 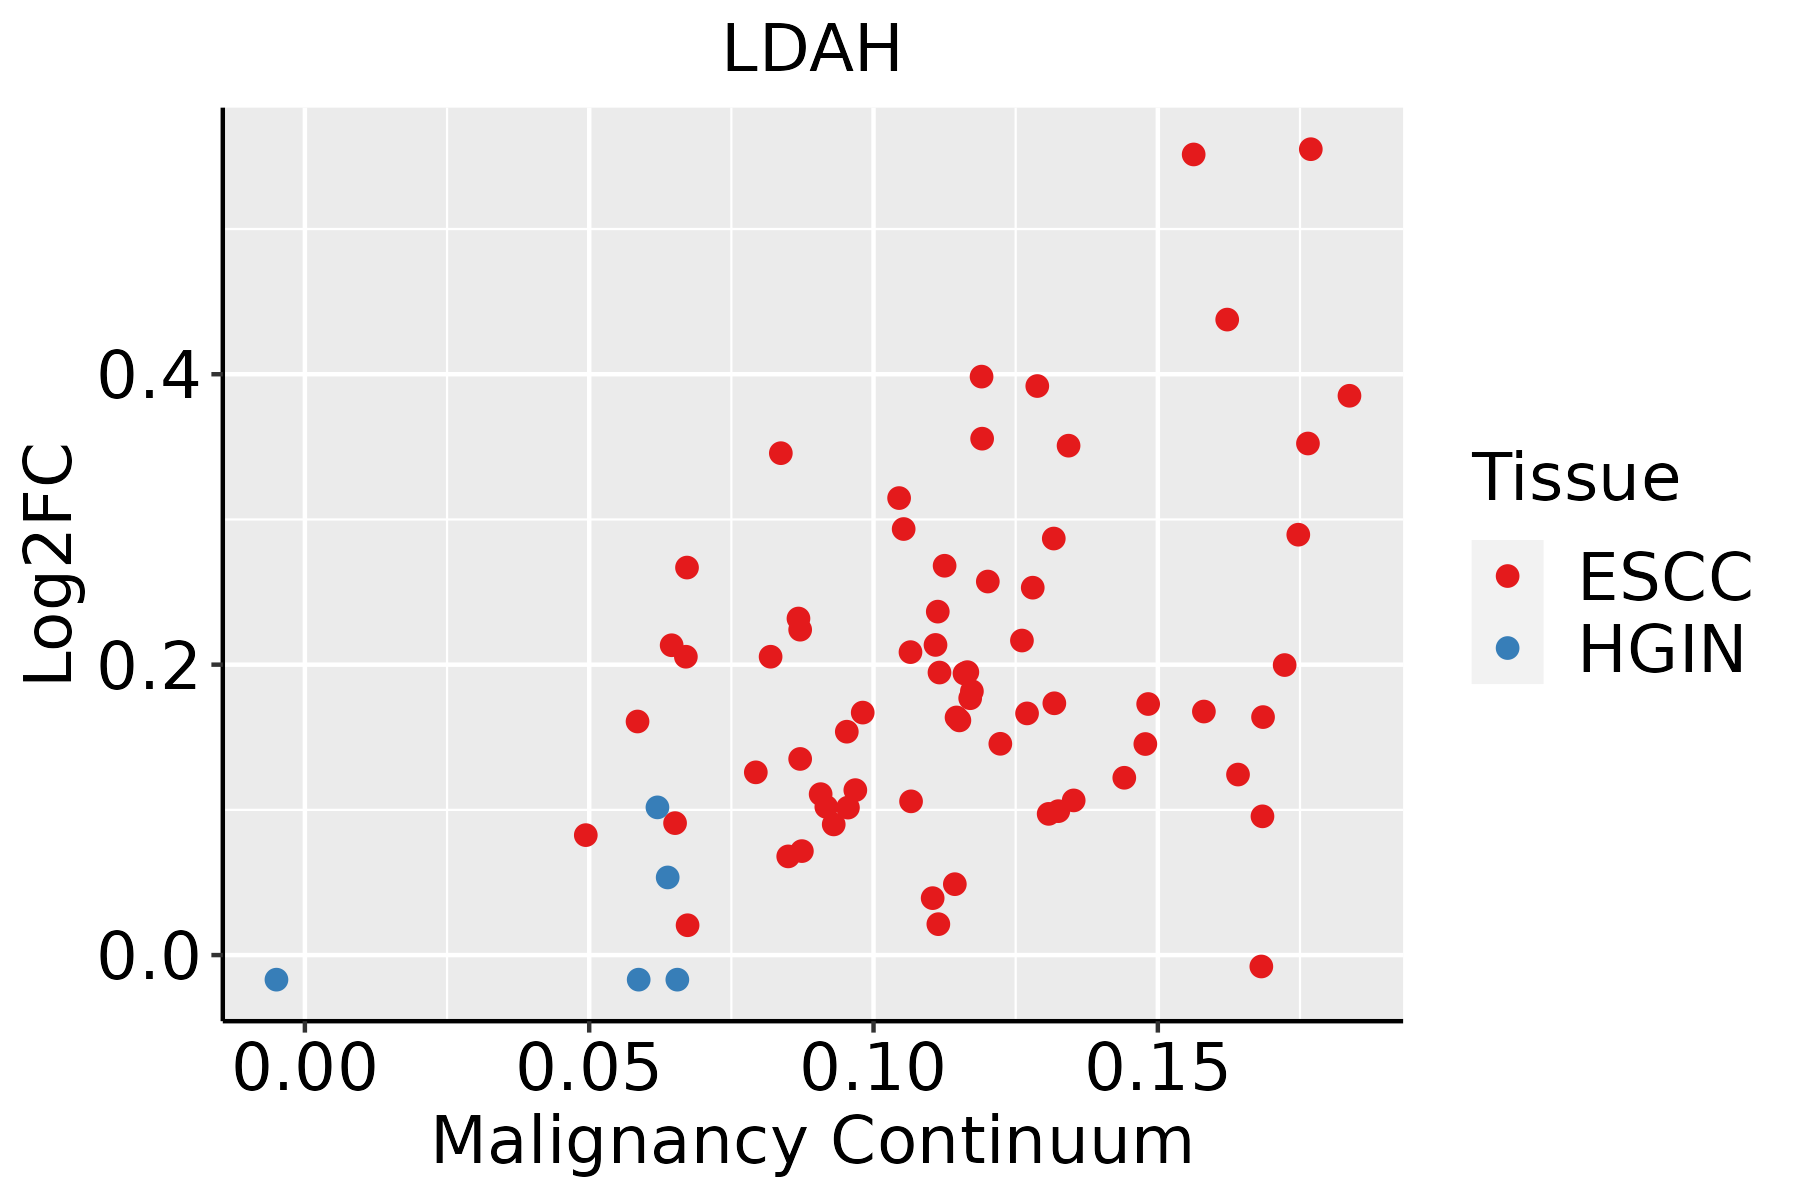 | ESCC: Esophageal squamous cell carcinoma |
| HGIN: High-grade intraepithelial neoplasias | ||
| LGIN: Low-grade intraepithelial neoplasias |
| ∗log2FC in expression of this searched gene in stem-like cells from each diseased tissue sample relative to stem-like cells in normal samples in each tissue plotted against the malignancy continuum. Samples are colored based on if they are from different disease stage. |
Top |
Malignant transformation related pathway analysis |
| Find out the enriched GO biological processes and KEGG pathways involved in transition from healthy to precancer to cancer |
| Tissue | Disease Stage | Enriched GO biological Processes |
| Colorectum | AD |  |
| Colorectum | SER |  |
| Colorectum | MSS |  |
| Colorectum | MSI-H |  |
| Colorectum | FAP |  |
| ∗Top 15 enriched GO BP terms are showed in the bar plot of each disease state in each tissue. Each row represents a significant GO biological process which is colored according to the -log10(p.adjust). |
| Page: 1 2 3 4 5 6 7 8 9 |
| GO ID | Tissue | Disease Stage | Description | Gene Ratio | Bg Ratio | pvalue | p.adjust | Count |
| GO:0051235110 | Esophagus | ESCC | maintenance of location | 200/8552 | 327/18723 | 1.01e-08 | 2.02e-07 | 200 |
| GO:00199155 | Esophagus | ESCC | lipid storage | 58/8552 | 87/18723 | 6.15e-05 | 4.72e-04 | 58 |
| GO:00160427 | Esophagus | ESCC | lipid catabolic process | 168/8552 | 320/18723 | 7.97e-03 | 2.84e-02 | 168 |
| Page: 1 |
| Pathway ID | Tissue | Disease Stage | Description | Gene Ratio | Bg Ratio | pvalue | p.adjust | qvalue | Count |
| Page: 1 |
Top |
Cell-cell communication analysis |
| Identification of potential cell-cell interactions between two cell types and their ligand-receptor pairs for different disease states |
| Ligand | Receptor | LRpair | Pathway | Tissue | Disease Stage |
| Page: 1 |
Top |
Single-cell gene regulatory network inference analysis |
| Find out the significant the regulons (TFs) and the target genes of each regulon across cell types for different disease states |
| TF | Cell Type | Tissue | Disease Stage | Target Gene | RSS | Regulon Activity |
| ∗The dot plots of a searched regulon are shown for all cell subpopulations in each disease state of each tissue based on the regulon specific score inferred using pySCENIC and by calculating the average expression. |
| Page: 1 |
Top |
Somatic mutation of malignant transformation related genes |
| Annotation of somatic variants for genes involved in malignant transformation |
| Hugo Symbol | Variant Class | Variant Classification | dbSNP RS | HGVSc | HGVSp | HGVSp Short | SWISSPROT | BIOTYPE | SIFT | PolyPhen | Tumor Sample Barcode | Tissue | Histology | Sex | Age | Stage | Therapy Types | Drugs | Outcome |
| LDAH | SNV | Missense_Mutation | rs375981134 | c.760N>A | p.Glu254Lys | p.E254K | Q9H6V9 | protein_coding | tolerated(0.6) | benign(0.305) | TCGA-AC-A23H-01 | Breast | breast invasive carcinoma | Female | >=65 | I/II | Unknown | Unknown | PD |
| LDAH | SNV | Missense_Mutation | c.735N>A | p.Met245Ile | p.M245I | Q9H6V9 | protein_coding | deleterious(0) | probably_damaging(0.953) | TCGA-EK-A2PI-01 | Cervix | cervical & endocervical cancer | Female | <65 | III/IV | Unknown | Unknown | SD | |
| LDAH | SNV | Missense_Mutation | c.778N>G | p.Leu260Val | p.L260V | Q9H6V9 | protein_coding | deleterious(0) | possibly_damaging(0.694) | TCGA-FU-A3HZ-01 | Cervix | cervical & endocervical cancer | Female | <65 | I/II | Chemotherapy | cisplatin | CR | |
| LDAH | SNV | Missense_Mutation | c.22N>A | p.Glu8Lys | p.E8K | Q9H6V9 | protein_coding | tolerated(0.14) | benign(0.057) | TCGA-JX-A3Q0-01 | Cervix | cervical & endocervical cancer | Female | <65 | III/IV | Unknown | Unknown | SD | |
| LDAH | SNV | Missense_Mutation | rs761059091 | c.107N>G | p.His36Arg | p.H36R | Q9H6V9 | protein_coding | tolerated(0.1) | benign(0) | TCGA-AD-6889-01 | Colorectum | colon adenocarcinoma | Male | >=65 | I/II | Chemotherapy | xeloda | PD |
| LDAH | SNV | Missense_Mutation | c.88N>T | p.Pro30Ser | p.P30S | Q9H6V9 | protein_coding | tolerated(0.09) | benign(0.135) | TCGA-A5-A0G2-01 | Endometrium | uterine corpus endometrioid carcinoma | Female | <65 | III/IV | Unknown | Unknown | SD | |
| LDAH | SNV | Missense_Mutation | novel | c.341G>A | p.Gly114Glu | p.G114E | Q9H6V9 | protein_coding | deleterious(0) | benign(0.349) | TCGA-A5-A1OF-01 | Endometrium | uterine corpus endometrioid carcinoma | Female | <65 | I/II | Unknown | Unknown | SD |
| LDAH | SNV | Missense_Mutation | c.257N>T | p.Ala86Val | p.A86V | Q9H6V9 | protein_coding | tolerated(0.61) | benign(0.003) | TCGA-AP-A051-01 | Endometrium | uterine corpus endometrioid carcinoma | Female | >=65 | I/II | Unknown | Unknown | SD | |
| LDAH | SNV | Missense_Mutation | c.257C>T | p.Ala86Val | p.A86V | Q9H6V9 | protein_coding | tolerated(0.61) | benign(0.003) | TCGA-AP-A054-01 | Endometrium | uterine corpus endometrioid carcinoma | Female | <65 | III/IV | Chemotherapy | carboplatin | PD | |
| LDAH | SNV | Missense_Mutation | rs191990052 | c.220N>T | p.Arg74Cys | p.R74C | Q9H6V9 | protein_coding | tolerated(0.07) | benign(0.056) | TCGA-AP-A056-01 | Endometrium | uterine corpus endometrioid carcinoma | Female | <65 | I/II | Unknown | Unknown | SD |
| Page: 1 2 3 4 |
Top |
Related drugs of malignant transformation related genes |
| Identification of chemicals and drugs interact with genes involved in malignant transfromation |
| (DGIdb 4.0) |
| Entrez ID | Symbol | Category | Interaction Types | Drug Claim Name | Drug Name | PMIDs |
| Page: 1 |

Copyright 2023-Present -The University of Texas Health Science Center at Houston |