
|
|||||
|
 | |
| |
| |
| |
| |
| |
|
Gene: LCOR |
Gene summary for LCOR |
| Gene information | Species | Human | Gene symbol | LCOR | Gene ID | 84458 |
| Gene name | ligand dependent nuclear receptor corepressor | |
| Gene Alias | C10orf12 | |
| Cytomap | 10q24.1 | |
| Gene Type | protein-coding | GO ID | GO:0000122 | UniProtAcc | Q96JN0 |
Top |
Malignant transformation analysis |
| Identification of the aberrant gene expression in precancerous and cancerous lesions by comparing the gene expression of stem-like cells in diseased tissues with normal stem cells |
| Entrez ID | Symbol | Replicates | Species | Organ | Tissue | Adj P-value | Log2FC | Malignancy |
| 84458 | LCOR | CCI_1 | Human | Cervix | CC | 4.13e-07 | 8.27e-01 | 0.528 |
| 84458 | LCOR | CCI_2 | Human | Cervix | CC | 2.16e-07 | 9.43e-01 | 0.5249 |
| 84458 | LCOR | HTA11_3410_2000001011 | Human | Colorectum | AD | 1.73e-20 | -6.86e-01 | 0.0155 |
| 84458 | LCOR | HTA11_347_2000001011 | Human | Colorectum | AD | 3.16e-04 | 3.83e-01 | -0.1954 |
| 84458 | LCOR | HTA11_5216_2000001011 | Human | Colorectum | SER | 4.15e-02 | -7.48e-01 | -0.1462 |
| 84458 | LCOR | HTA11_99999970781_79442 | Human | Colorectum | MSS | 4.36e-06 | -3.30e-01 | 0.294 |
| 84458 | LCOR | HTA11_99999974143_84620 | Human | Colorectum | MSS | 5.10e-17 | -5.66e-01 | 0.3005 |
| 84458 | LCOR | F007 | Human | Colorectum | FAP | 5.23e-03 | -1.30e-01 | 0.1176 |
| 84458 | LCOR | A001-C-207 | Human | Colorectum | FAP | 1.36e-03 | -1.59e-02 | 0.1278 |
| 84458 | LCOR | A015-C-203 | Human | Colorectum | FAP | 6.34e-35 | -4.92e-01 | -0.1294 |
| 84458 | LCOR | A015-C-204 | Human | Colorectum | FAP | 5.98e-10 | -3.59e-01 | -0.0228 |
| 84458 | LCOR | A014-C-040 | Human | Colorectum | FAP | 1.28e-06 | -5.11e-01 | -0.1184 |
| 84458 | LCOR | A002-C-201 | Human | Colorectum | FAP | 2.78e-16 | -3.59e-01 | 0.0324 |
| 84458 | LCOR | A002-C-203 | Human | Colorectum | FAP | 6.92e-04 | -1.82e-02 | 0.2786 |
| 84458 | LCOR | A001-C-119 | Human | Colorectum | FAP | 1.57e-11 | -6.14e-01 | -0.1557 |
| 84458 | LCOR | A001-C-108 | Human | Colorectum | FAP | 2.31e-17 | -1.68e-01 | -0.0272 |
| 84458 | LCOR | A002-C-205 | Human | Colorectum | FAP | 1.09e-25 | -4.23e-01 | -0.1236 |
| 84458 | LCOR | A001-C-104 | Human | Colorectum | FAP | 8.90e-04 | -2.61e-01 | 0.0184 |
| 84458 | LCOR | A015-C-005 | Human | Colorectum | FAP | 2.41e-08 | -4.02e-01 | -0.0336 |
| 84458 | LCOR | A015-C-006 | Human | Colorectum | FAP | 1.05e-19 | -5.75e-01 | -0.0994 |
| Page: 1 2 3 4 5 6 7 8 9 |
| Tissue | Expression Dynamics | Abbreviation |
| Cervix | 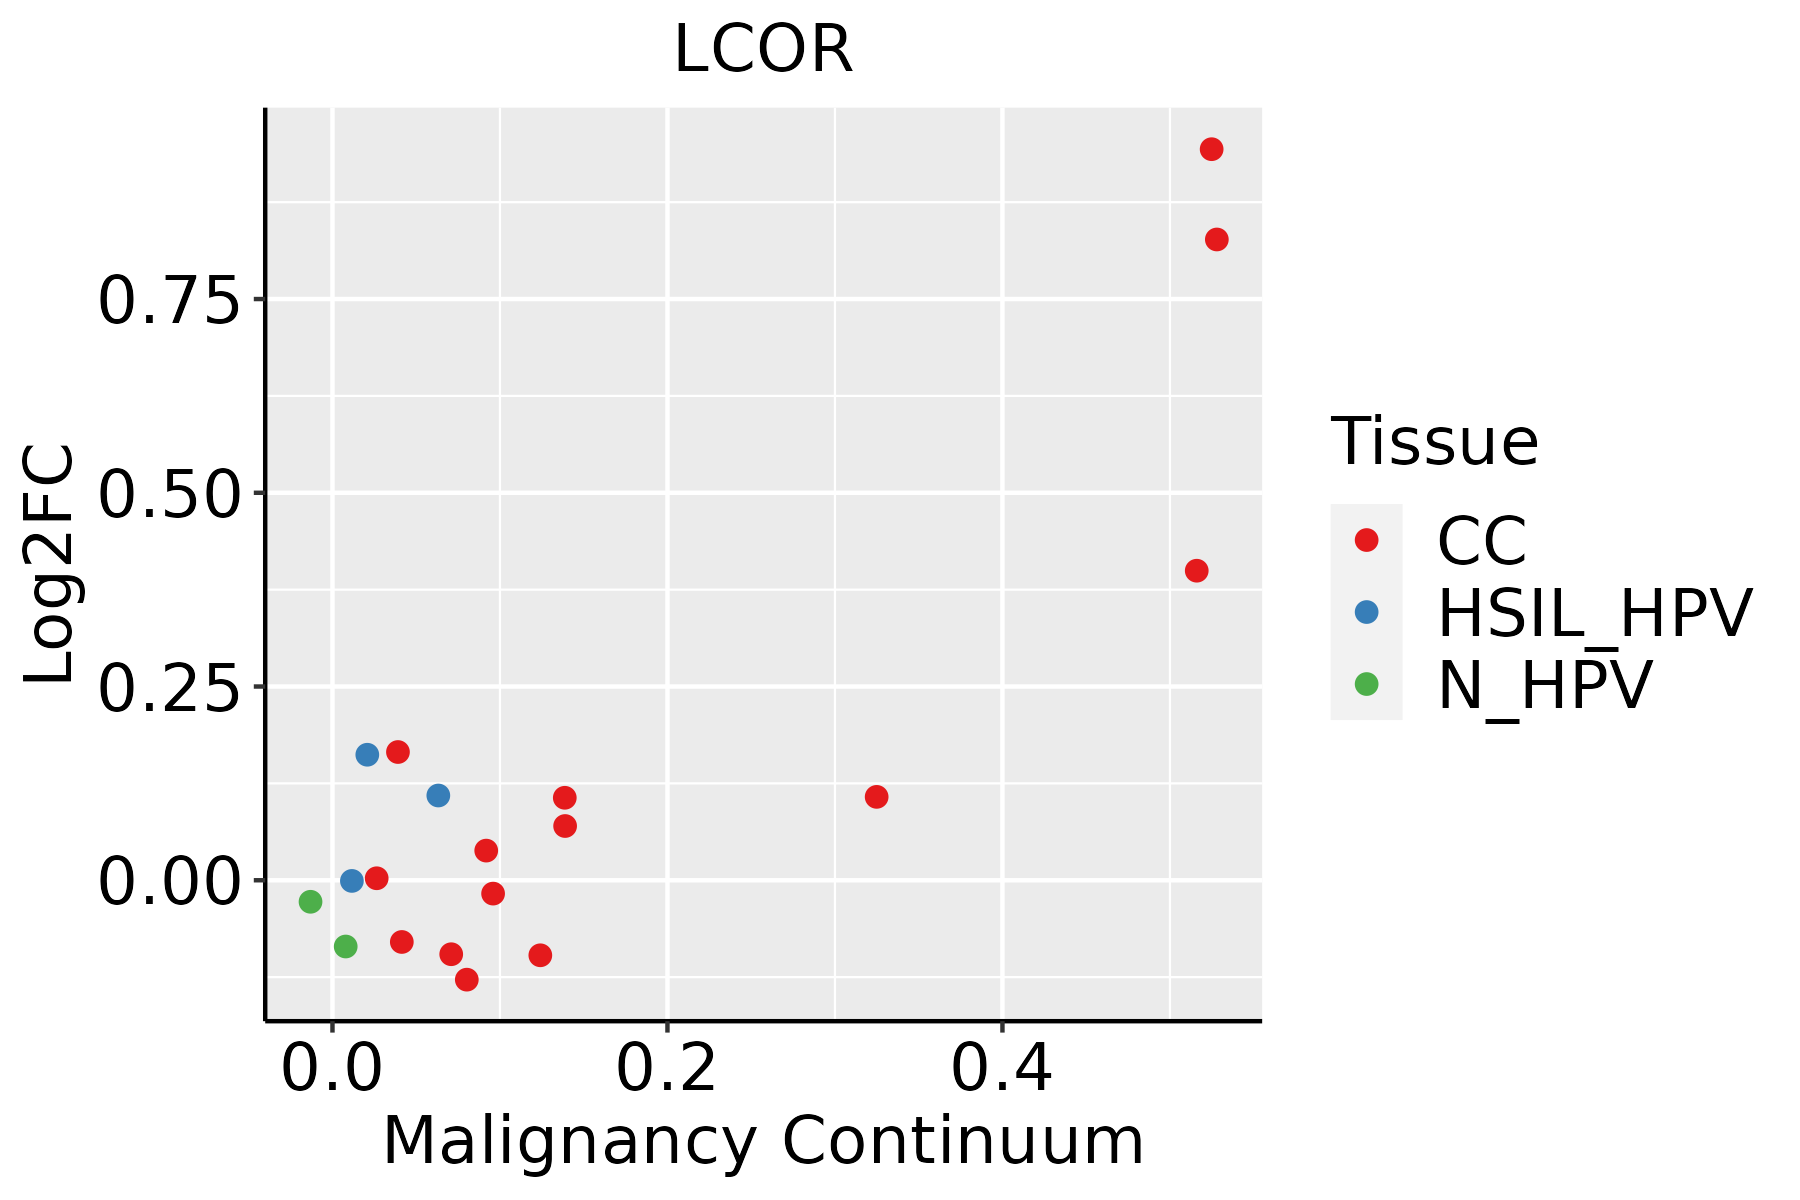 | CC: Cervix cancer |
| HSIL_HPV: HPV-infected high-grade squamous intraepithelial lesions | ||
| N_HPV: HPV-infected normal cervix | ||
| Colorectum (GSE201348) |  | FAP: Familial adenomatous polyposis |
| CRC: Colorectal cancer | ||
| Colorectum (HTA11) |  | AD: Adenomas |
| SER: Sessile serrated lesions | ||
| MSI-H: Microsatellite-high colorectal cancer | ||
| MSS: Microsatellite stable colorectal cancer | ||
| Endometrium |  | AEH: Atypical endometrial hyperplasia |
| EEC: Endometrioid Cancer | ||
| Esophagus |  | ESCC: Esophageal squamous cell carcinoma |
| HGIN: High-grade intraepithelial neoplasias | ||
| LGIN: Low-grade intraepithelial neoplasias | ||
| Liver | 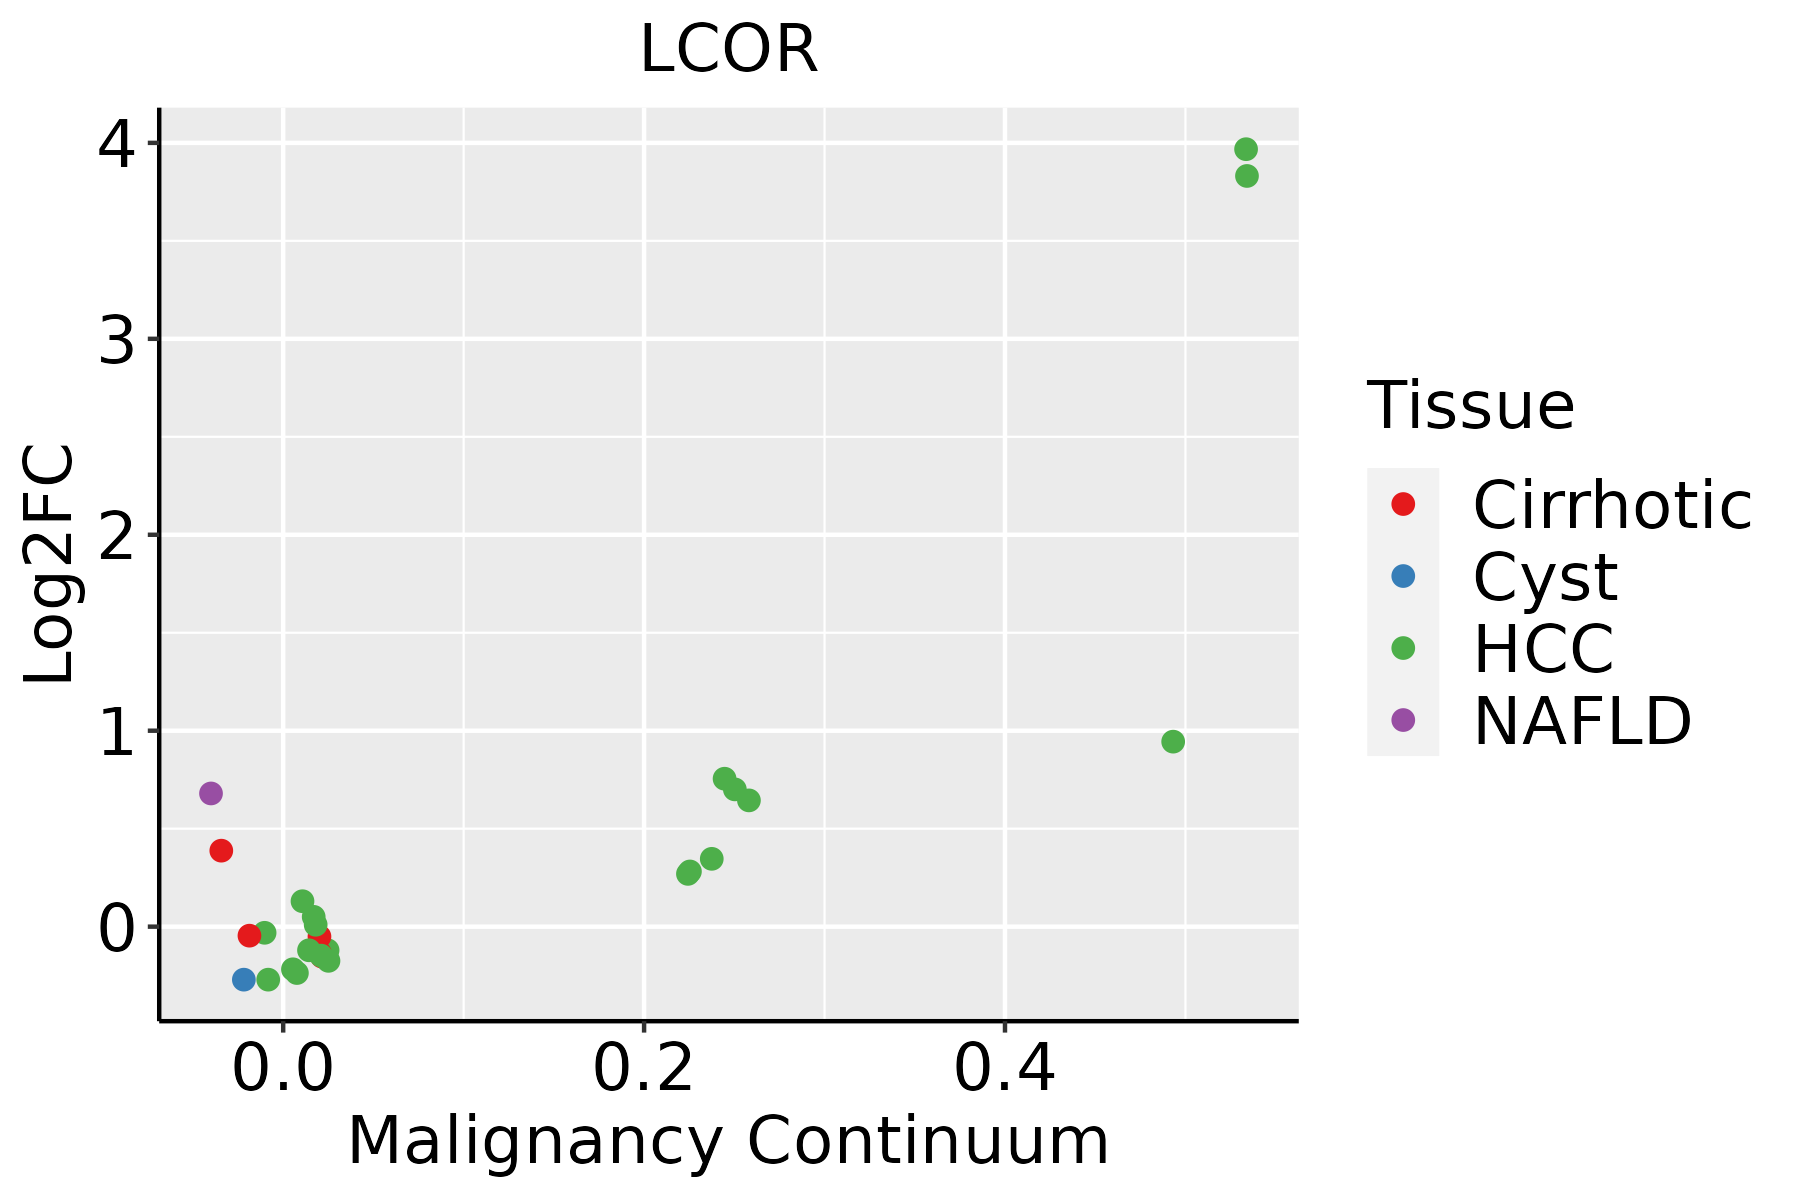 | HCC: Hepatocellular carcinoma |
| NAFLD: Non-alcoholic fatty liver disease | ||
| Lung | 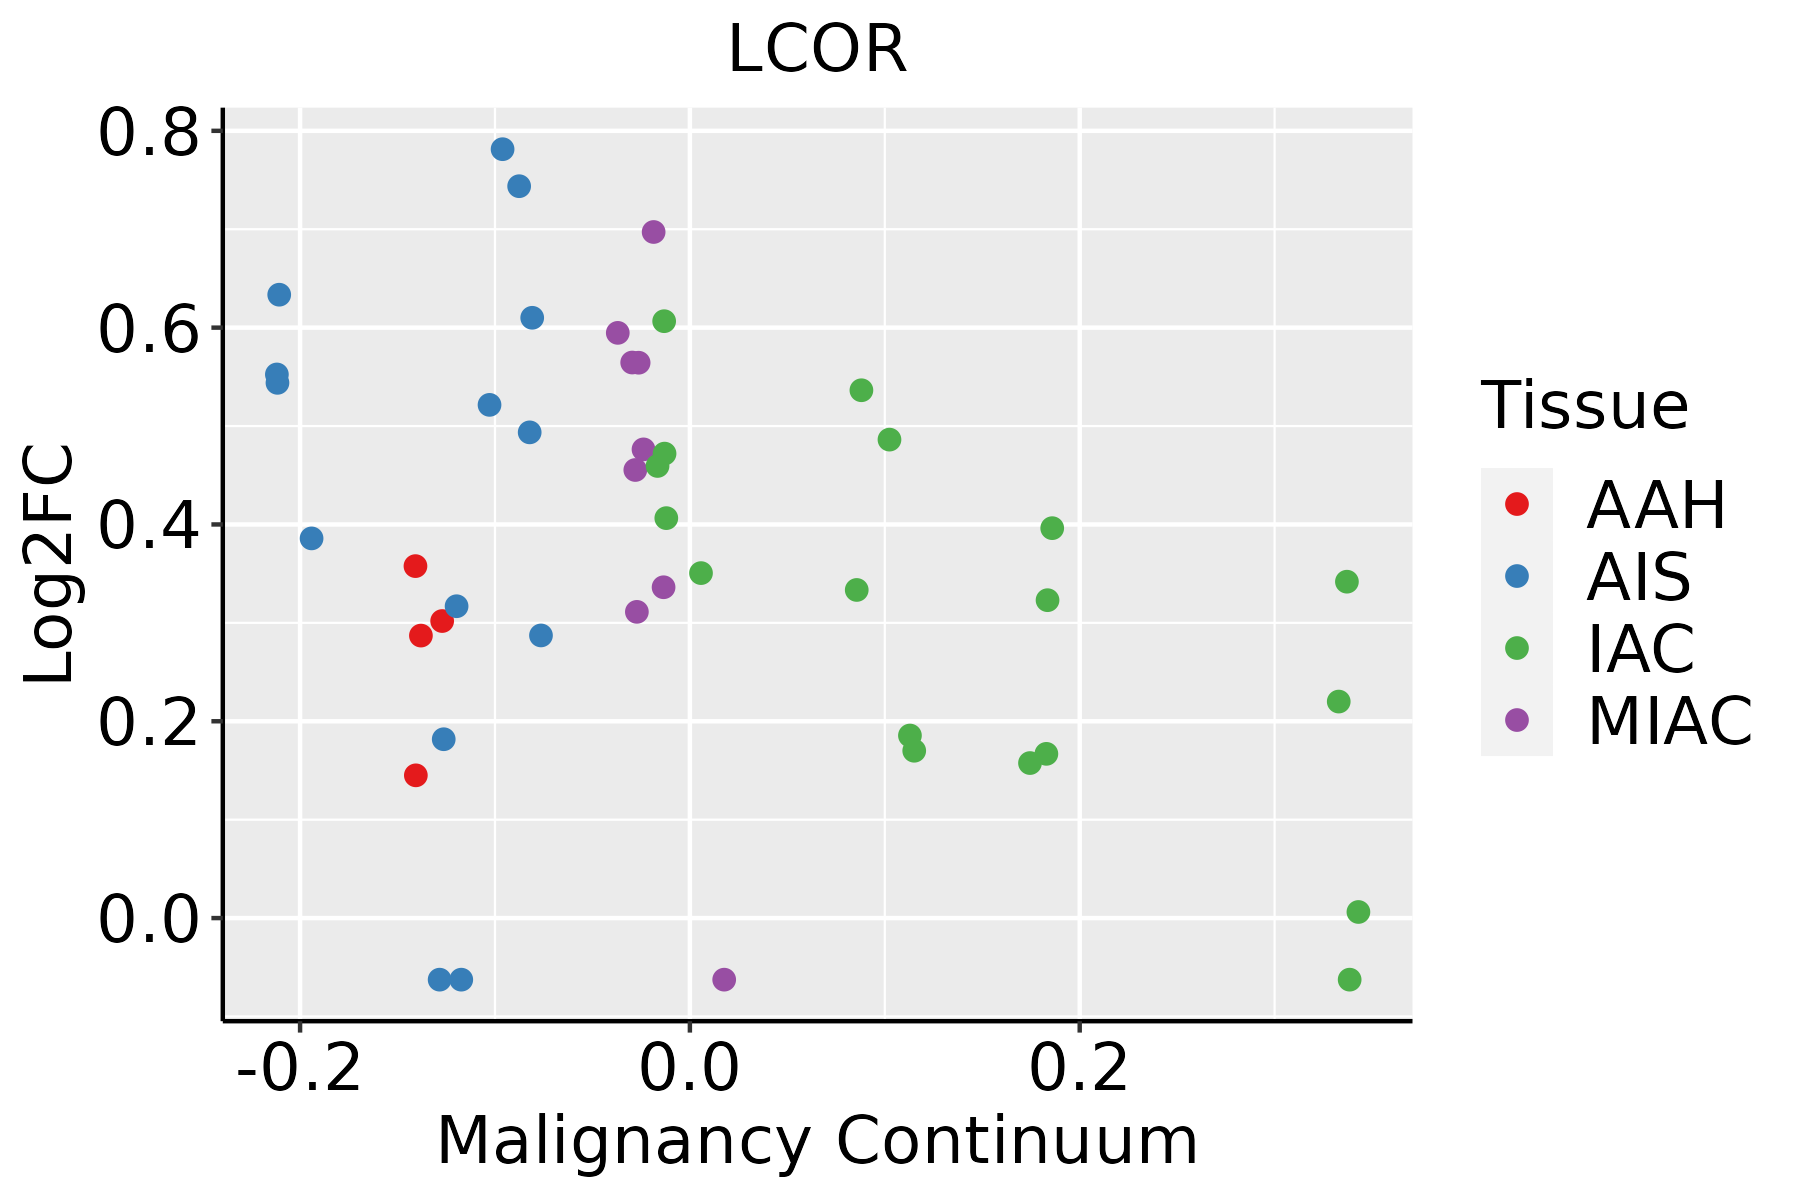 | AAH: Atypical adenomatous hyperplasia |
| AIS: Adenocarcinoma in situ | ||
| IAC: Invasive lung adenocarcinoma | ||
| MIA: Minimally invasive adenocarcinoma | ||
| Oral Cavity |  | EOLP: Erosive Oral lichen planus |
| LP: leukoplakia | ||
| NEOLP: Non-erosive oral lichen planus | ||
| OSCC: Oral squamous cell carcinoma | ||
| Prostate | 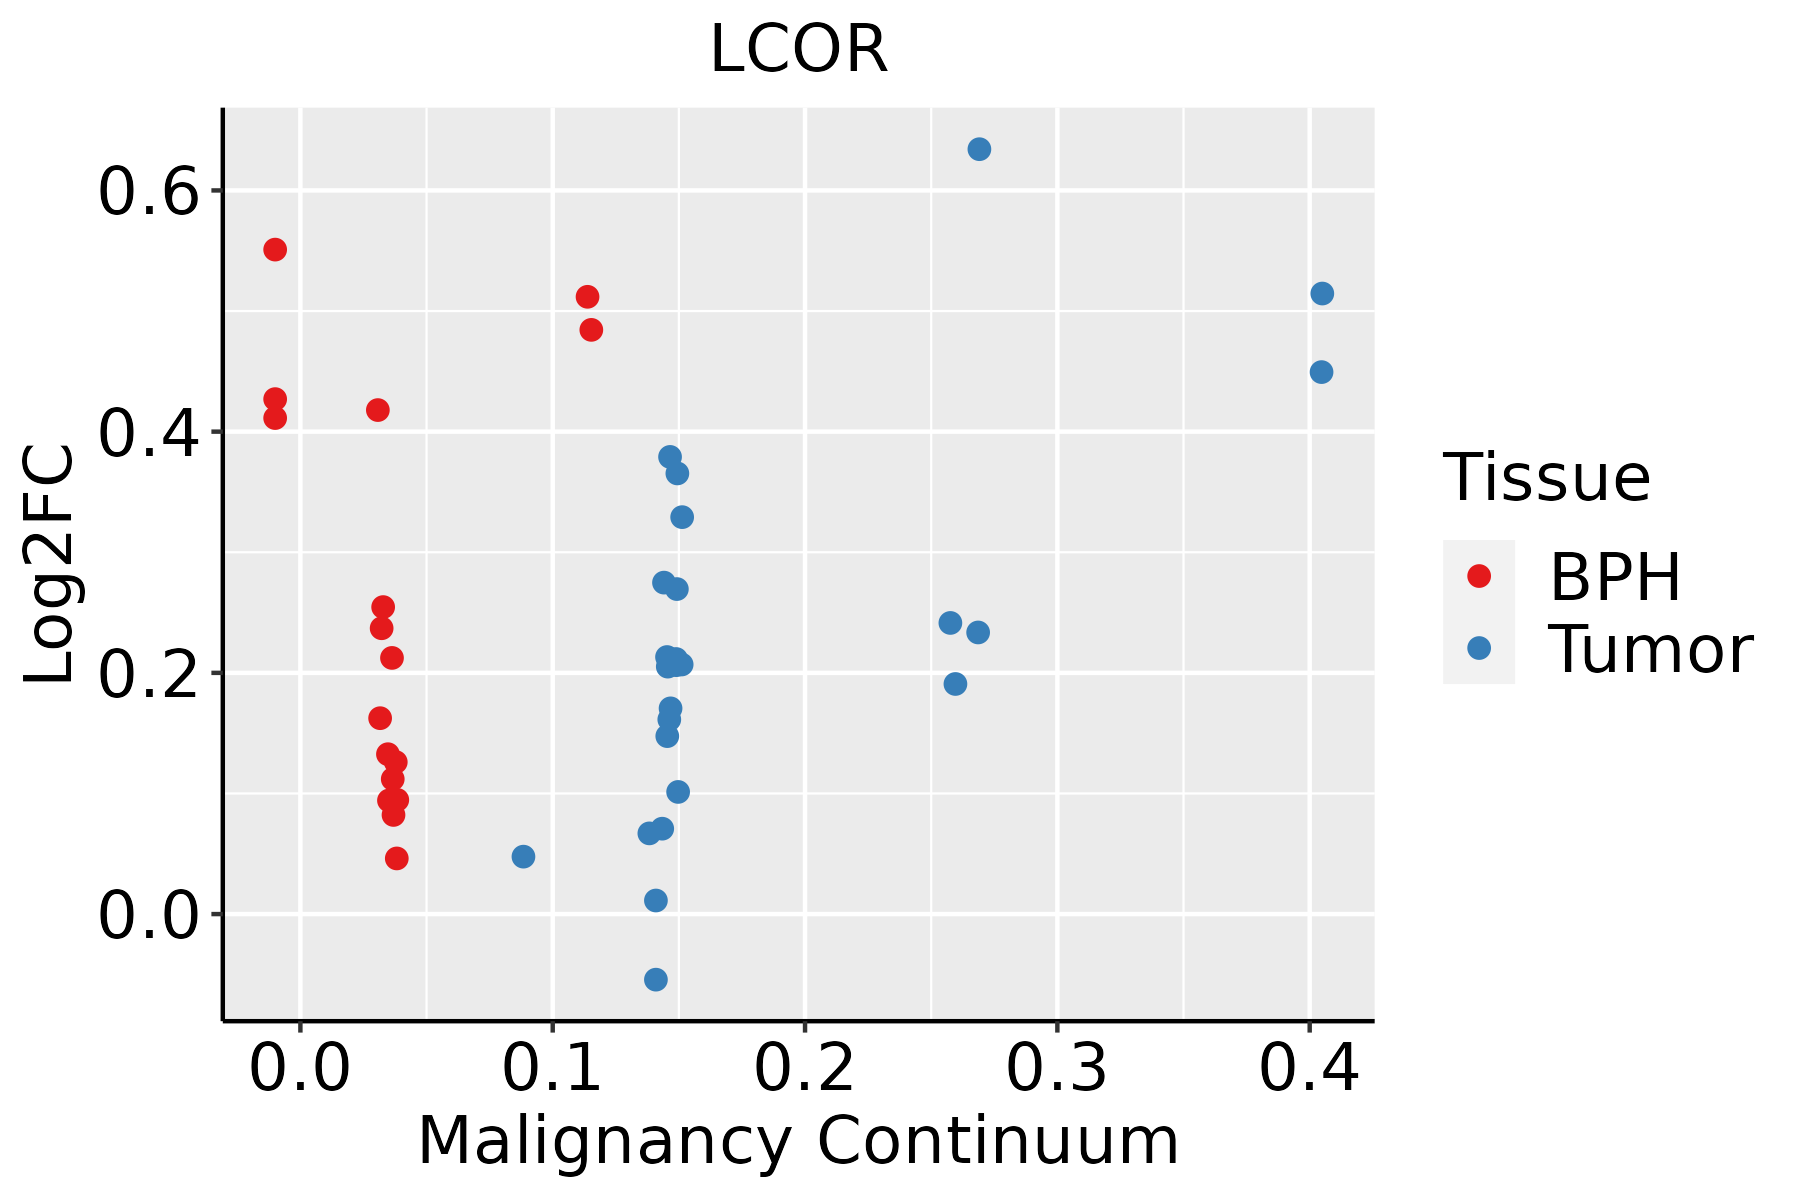 | BPH: Benign Prostatic Hyperplasia |
| Thyroid | 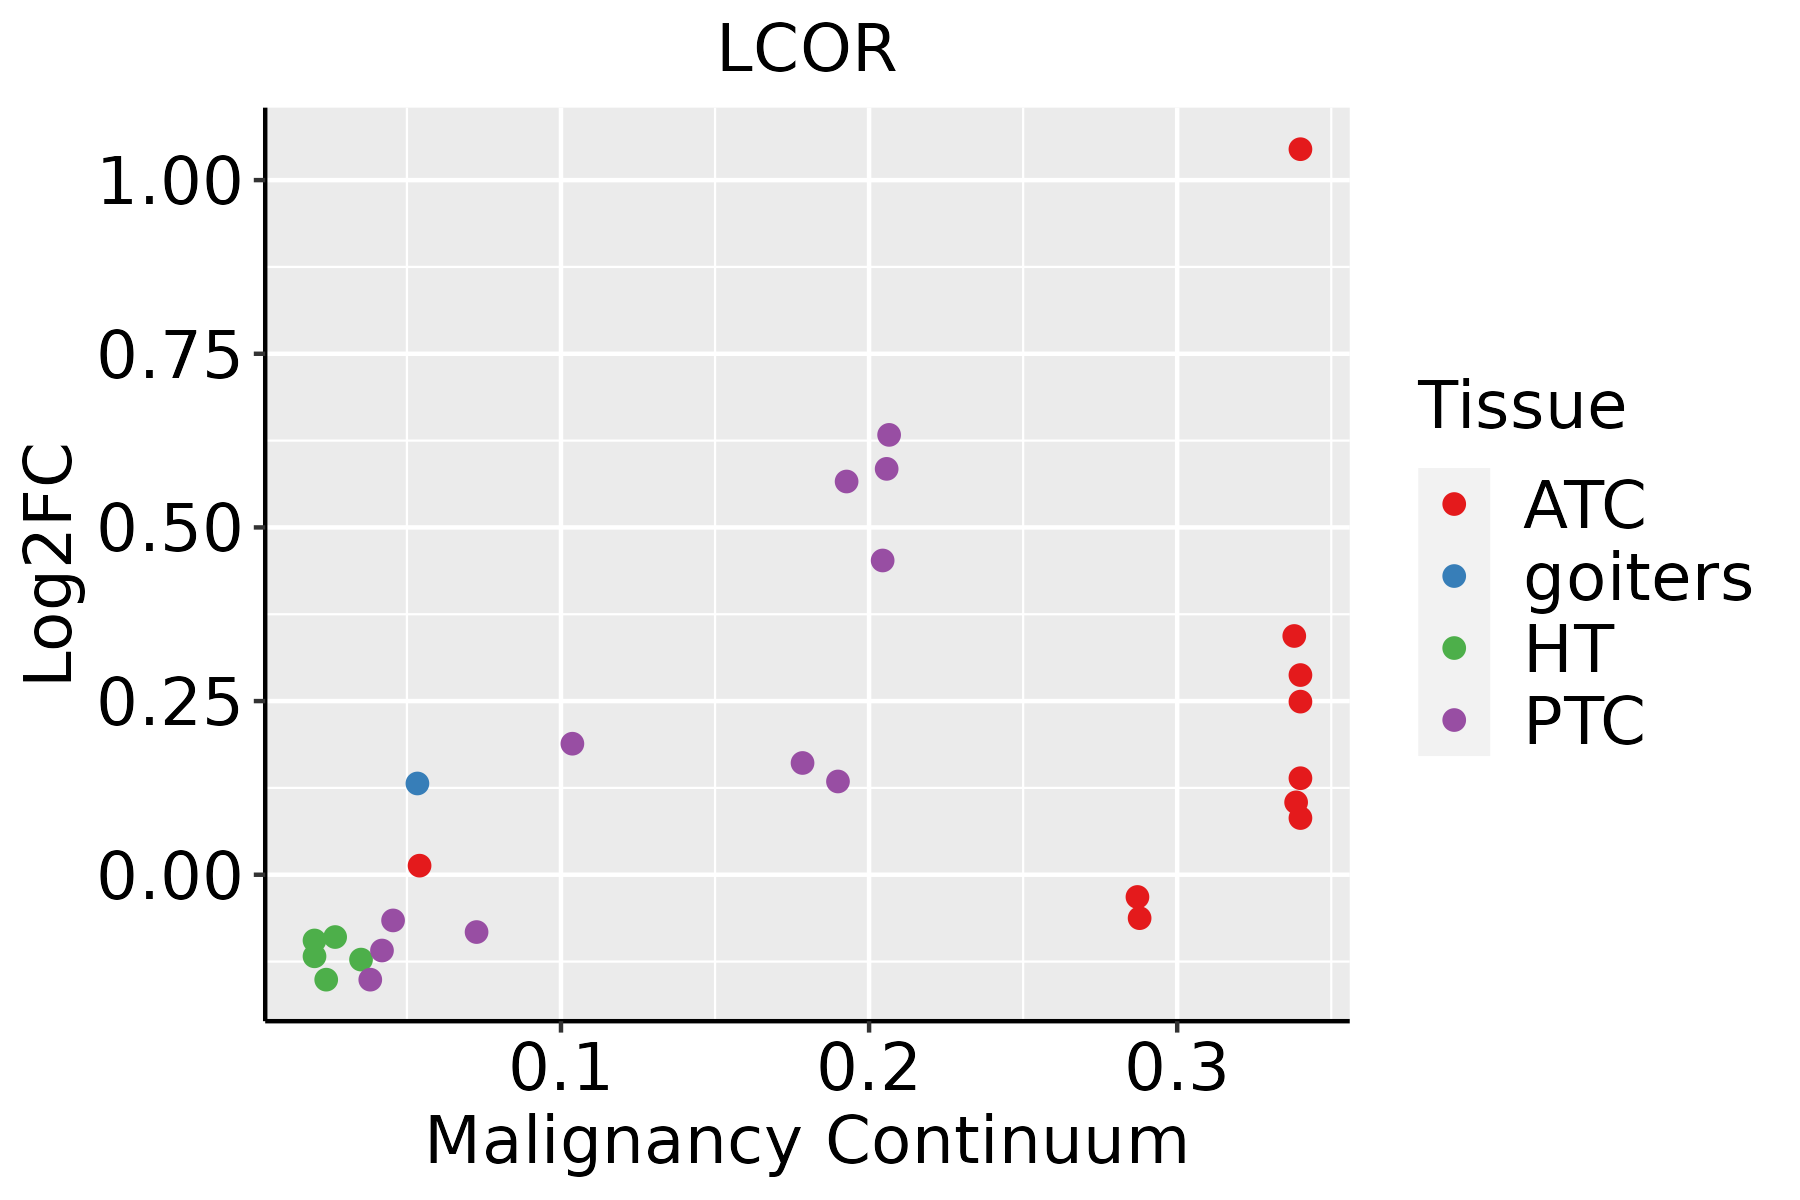 | ATC: Anaplastic thyroid cancer |
| HT: Hashimoto's thyroiditis | ||
| PTC: Papillary thyroid cancer |
| ∗log2FC in expression of this searched gene in stem-like cells from each diseased tissue sample relative to stem-like cells in normal samples in each tissue plotted against the malignancy continuum. Samples are colored based on if they are from different disease stage. |
Top |
Malignant transformation related pathway analysis |
| Find out the enriched GO biological processes and KEGG pathways involved in transition from healthy to precancer to cancer |
| Tissue | Disease Stage | Enriched GO biological Processes |
| Colorectum | AD |  |
| Colorectum | SER |  |
| Colorectum | MSS |  |
| Colorectum | MSI-H |  |
| Colorectum | FAP |  |
| ∗Top 15 enriched GO BP terms are showed in the bar plot of each disease state in each tissue. Each row represents a significant GO biological process which is colored according to the -log10(p.adjust). |
| Page: 1 2 3 4 5 6 7 8 9 |
| GO ID | Tissue | Disease Stage | Description | Gene Ratio | Bg Ratio | pvalue | p.adjust | Count |
| GO:00323556 | Cervix | CC | response to estradiol | 34/2311 | 141/18723 | 8.19e-05 | 1.11e-03 | 34 |
| GO:0032355 | Colorectum | CRC | response to estradiol | 27/2078 | 141/18723 | 3.24e-03 | 2.81e-02 | 27 |
| GO:00323557 | Endometrium | AEH | response to estradiol | 34/2100 | 141/18723 | 1.13e-05 | 2.53e-04 | 34 |
| GO:003235514 | Endometrium | EEC | response to estradiol | 34/2168 | 141/18723 | 2.22e-05 | 3.98e-04 | 34 |
| GO:00323553 | Liver | NAFLD | response to estradiol | 25/1882 | 141/18723 | 3.51e-03 | 3.01e-02 | 25 |
| GO:00323551 | Liver | Cirrhotic | response to estradiol | 51/4634 | 141/18723 | 1.60e-03 | 1.04e-02 | 51 |
| GO:00323552 | Liver | HCC | response to estradiol | 81/7958 | 141/18723 | 2.39e-04 | 1.79e-03 | 81 |
| GO:00323554 | Lung | IAC | response to estradiol | 27/2061 | 141/18723 | 2.89e-03 | 2.60e-02 | 27 |
| GO:003235511 | Lung | AIS | response to estradiol | 25/1849 | 141/18723 | 2.78e-03 | 2.77e-02 | 25 |
| GO:00323559 | Oral cavity | OSCC | response to estradiol | 79/7305 | 141/18723 | 3.01e-05 | 2.76e-04 | 79 |
| GO:003235516 | Oral cavity | LP | response to estradiol | 52/4623 | 141/18723 | 8.28e-04 | 7.24e-03 | 52 |
| GO:003235522 | Oral cavity | EOLP | response to estradiol | 36/2218 | 141/18723 | 5.44e-06 | 1.08e-04 | 36 |
| GO:003235531 | Oral cavity | NEOLP | response to estradiol | 27/2005 | 141/18723 | 1.95e-03 | 1.32e-02 | 27 |
| GO:00323558 | Prostate | BPH | response to estradiol | 38/3107 | 141/18723 | 1.25e-03 | 7.57e-03 | 38 |
| GO:003235515 | Prostate | Tumor | response to estradiol | 38/3246 | 141/18723 | 2.78e-03 | 1.52e-02 | 38 |
| GO:003235518 | Thyroid | PTC | response to estradiol | 62/5968 | 141/18723 | 1.67e-03 | 9.16e-03 | 62 |
| GO:003235519 | Thyroid | ATC | response to estradiol | 72/6293 | 141/18723 | 1.35e-05 | 1.29e-04 | 72 |
| Page: 1 |
| Pathway ID | Tissue | Disease Stage | Description | Gene Ratio | Bg Ratio | pvalue | p.adjust | qvalue | Count |
| Page: 1 |
Top |
Cell-cell communication analysis |
| Identification of potential cell-cell interactions between two cell types and their ligand-receptor pairs for different disease states |
| Ligand | Receptor | LRpair | Pathway | Tissue | Disease Stage |
| Page: 1 |
Top |
Single-cell gene regulatory network inference analysis |
| Find out the significant the regulons (TFs) and the target genes of each regulon across cell types for different disease states |
| TF | Cell Type | Tissue | Disease Stage | Target Gene | RSS | Regulon Activity |
| ∗The dot plots of a searched regulon are shown for all cell subpopulations in each disease state of each tissue based on the regulon specific score inferred using pySCENIC and by calculating the average expression. |
| Page: 1 |
Top |
Somatic mutation of malignant transformation related genes |
| Annotation of somatic variants for genes involved in malignant transformation |
| Hugo Symbol | Variant Class | Variant Classification | dbSNP RS | HGVSc | HGVSp | HGVSp Short | SWISSPROT | BIOTYPE | SIFT | PolyPhen | Tumor Sample Barcode | Tissue | Histology | Sex | Age | Stage | Therapy Types | Drugs | Outcome |
| LCOR | SNV | Missense_Mutation | c.2092G>A | p.Ala698Thr | p.A698T | Q8N655 | protein_coding | tolerated(0.37) | benign(0.003) | TCGA-A2-A0D0-01 | Breast | breast invasive carcinoma | Female | <65 | I/II | Chemotherapy | cytoxan | SD | |
| LCOR | SNV | Missense_Mutation | novel | c.515C>G | p.Ala172Gly | p.A172G | Q96JN0 | protein_coding | tolerated(0.38) | benign(0.015) | TCGA-A7-A26I-01 | Breast | breast invasive carcinoma | Female | >=65 | I/II | Chemotherapy | cytoxan | SD |
| LCOR | SNV | Missense_Mutation | c.585G>C | p.Trp195Cys | p.W195C | Q96JN0 | protein_coding | tolerated(0.05) | possibly_damaging(0.621) | TCGA-A8-A092-01 | Breast | breast invasive carcinoma | Female | <65 | III/IV | Chemotherapy | paclitaxel | CR | |
| LCOR | SNV | Missense_Mutation | c.1510G>C | p.Asp504His | p.D504H | Q8N655 | protein_coding | deleterious(0) | probably_damaging(1) | TCGA-AC-A23H-01 | Breast | breast invasive carcinoma | Female | >=65 | I/II | Unknown | Unknown | PD | |
| LCOR | SNV | Missense_Mutation | c.1977G>C | p.Lys659Asn | p.K659N | Q8N655 | protein_coding | tolerated(0.29) | benign(0.238) | TCGA-AC-A23H-01 | Breast | breast invasive carcinoma | Female | >=65 | I/II | Unknown | Unknown | PD | |
| LCOR | SNV | Missense_Mutation | novel | c.2281N>T | p.Pro761Ser | p.P761S | Q8N655 | protein_coding | tolerated(0.06) | benign(0.031) | TCGA-AN-A046-01 | Breast | breast invasive carcinoma | Female | >=65 | I/II | Unknown | Unknown | SD |
| LCOR | SNV | Missense_Mutation | c.226C>T | p.Pro76Ser | p.P76S | Q96JN0 | protein_coding | tolerated(0.12) | benign(0.007) | TCGA-AN-A0AK-01 | Breast | breast invasive carcinoma | Female | >=65 | I/II | Unknown | Unknown | SD | |
| LCOR | SNV | Missense_Mutation | c.3530C>T | p.Ala1177Val | p.A1177V | Q8N655 | protein_coding | tolerated(0.18) | benign(0.007) | TCGA-AO-A0J5-01 | Breast | breast invasive carcinoma | Female | <65 | III/IV | Other, specify in notesBisphosphonate | zoledronic | PD | |
| LCOR | SNV | Missense_Mutation | c.3044N>A | p.Arg1015His | p.R1015H | Q8N655 | protein_coding | deleterious(0) | possibly_damaging(0.882) | TCGA-AR-A1AK-01 | Breast | breast invasive carcinoma | Female | >=65 | I/II | Hormone Therapy | anastrozole | SD | |
| LCOR | SNV | Missense_Mutation | c.263N>G | p.Ser88Cys | p.S88C | Q8N655 | protein_coding | deleterious(0.01) | possibly_damaging(0.8) | TCGA-AR-A251-01 | Breast | breast invasive carcinoma | Female | <65 | III/IV | Chemotherapy | doxorubicin | SD |
| Page: 1 2 3 4 5 6 7 8 9 10 11 12 13 14 15 16 17 18 19 20 |
Top |
Related drugs of malignant transformation related genes |
| Identification of chemicals and drugs interact with genes involved in malignant transfromation |
| (DGIdb 4.0) |
| Entrez ID | Symbol | Category | Interaction Types | Drug Claim Name | Drug Name | PMIDs |
| Page: 1 |

Copyright 2023-Present -The University of Texas Health Science Center at Houston |