
|
|||||
|
 | |
| |
| |
| |
| |
| |
|
Gene: LCN2 |
Gene summary for LCN2 |
| Gene information | Species | Human | Gene symbol | LCN2 | Gene ID | 3934 |
| Gene name | lipocalin 2 | |
| Gene Alias | 24p3 | |
| Cytomap | 9q34.11 | |
| Gene Type | protein-coding | GO ID | GO:0000041 | UniProtAcc | P80188 |
Top |
Malignant transformation analysis |
| Identification of the aberrant gene expression in precancerous and cancerous lesions by comparing the gene expression of stem-like cells in diseased tissues with normal stem cells |
| Entrez ID | Symbol | Replicates | Species | Organ | Tissue | Adj P-value | Log2FC | Malignancy |
| 3934 | LCN2 | GSM4909281 | Human | Breast | IDC | 5.05e-10 | -5.16e-01 | 0.21 |
| 3934 | LCN2 | GSM4909282 | Human | Breast | IDC | 5.38e-05 | -7.97e-02 | -0.0288 |
| 3934 | LCN2 | GSM4909285 | Human | Breast | IDC | 5.46e-16 | -6.25e-01 | 0.21 |
| 3934 | LCN2 | GSM4909286 | Human | Breast | IDC | 1.25e-14 | -6.47e-01 | 0.1081 |
| 3934 | LCN2 | GSM4909287 | Human | Breast | IDC | 1.69e-12 | -5.90e-01 | 0.2057 |
| 3934 | LCN2 | GSM4909290 | Human | Breast | IDC | 7.89e-11 | -6.37e-01 | 0.2096 |
| 3934 | LCN2 | GSM4909291 | Human | Breast | IDC | 7.23e-12 | -6.60e-01 | 0.1753 |
| 3934 | LCN2 | GSM4909293 | Human | Breast | IDC | 1.37e-13 | -6.43e-01 | 0.1581 |
| 3934 | LCN2 | GSM4909294 | Human | Breast | IDC | 4.20e-17 | -6.39e-01 | 0.2022 |
| 3934 | LCN2 | GSM4909296 | Human | Breast | IDC | 1.41e-16 | -6.50e-01 | 0.1524 |
| 3934 | LCN2 | GSM4909297 | Human | Breast | IDC | 4.84e-18 | -6.54e-01 | 0.1517 |
| 3934 | LCN2 | GSM4909298 | Human | Breast | IDC | 8.86e-18 | -6.52e-01 | 0.1551 |
| 3934 | LCN2 | GSM4909299 | Human | Breast | IDC | 1.34e-04 | -3.33e-01 | 0.035 |
| 3934 | LCN2 | GSM4909301 | Human | Breast | IDC | 1.06e-23 | -6.89e-01 | 0.1577 |
| 3934 | LCN2 | GSM4909302 | Human | Breast | IDC | 3.10e-24 | -6.89e-01 | 0.1545 |
| 3934 | LCN2 | GSM4909303 | Human | Breast | IDC | 7.39e-07 | -6.89e-01 | 0.0438 |
| 3934 | LCN2 | GSM4909304 | Human | Breast | IDC | 5.41e-19 | -6.68e-01 | 0.1636 |
| 3934 | LCN2 | GSM4909306 | Human | Breast | IDC | 1.27e-10 | -5.38e-01 | 0.1564 |
| 3934 | LCN2 | GSM4909307 | Human | Breast | IDC | 1.86e-10 | -5.97e-01 | 0.1569 |
| 3934 | LCN2 | GSM4909308 | Human | Breast | IDC | 1.17e-21 | -6.89e-01 | 0.158 |
| Page: 1 2 3 4 5 6 7 8 9 10 11 12 |
| Tissue | Expression Dynamics | Abbreviation |
| Breast |  | IDC: Invasive ductal carcinoma |
| DCIS: Ductal carcinoma in situ | ||
| Precancer(BRCA1-mut): Precancerous lesion from BRCA1 mutation carriers | ||
| Cervix |  | CC: Cervix cancer |
| HSIL_HPV: HPV-infected high-grade squamous intraepithelial lesions | ||
| N_HPV: HPV-infected normal cervix | ||
| Colorectum (GSE201348) |  | FAP: Familial adenomatous polyposis |
| CRC: Colorectal cancer | ||
| Colorectum (HTA11) |  | AD: Adenomas |
| SER: Sessile serrated lesions | ||
| MSI-H: Microsatellite-high colorectal cancer | ||
| MSS: Microsatellite stable colorectal cancer | ||
| Endometrium | 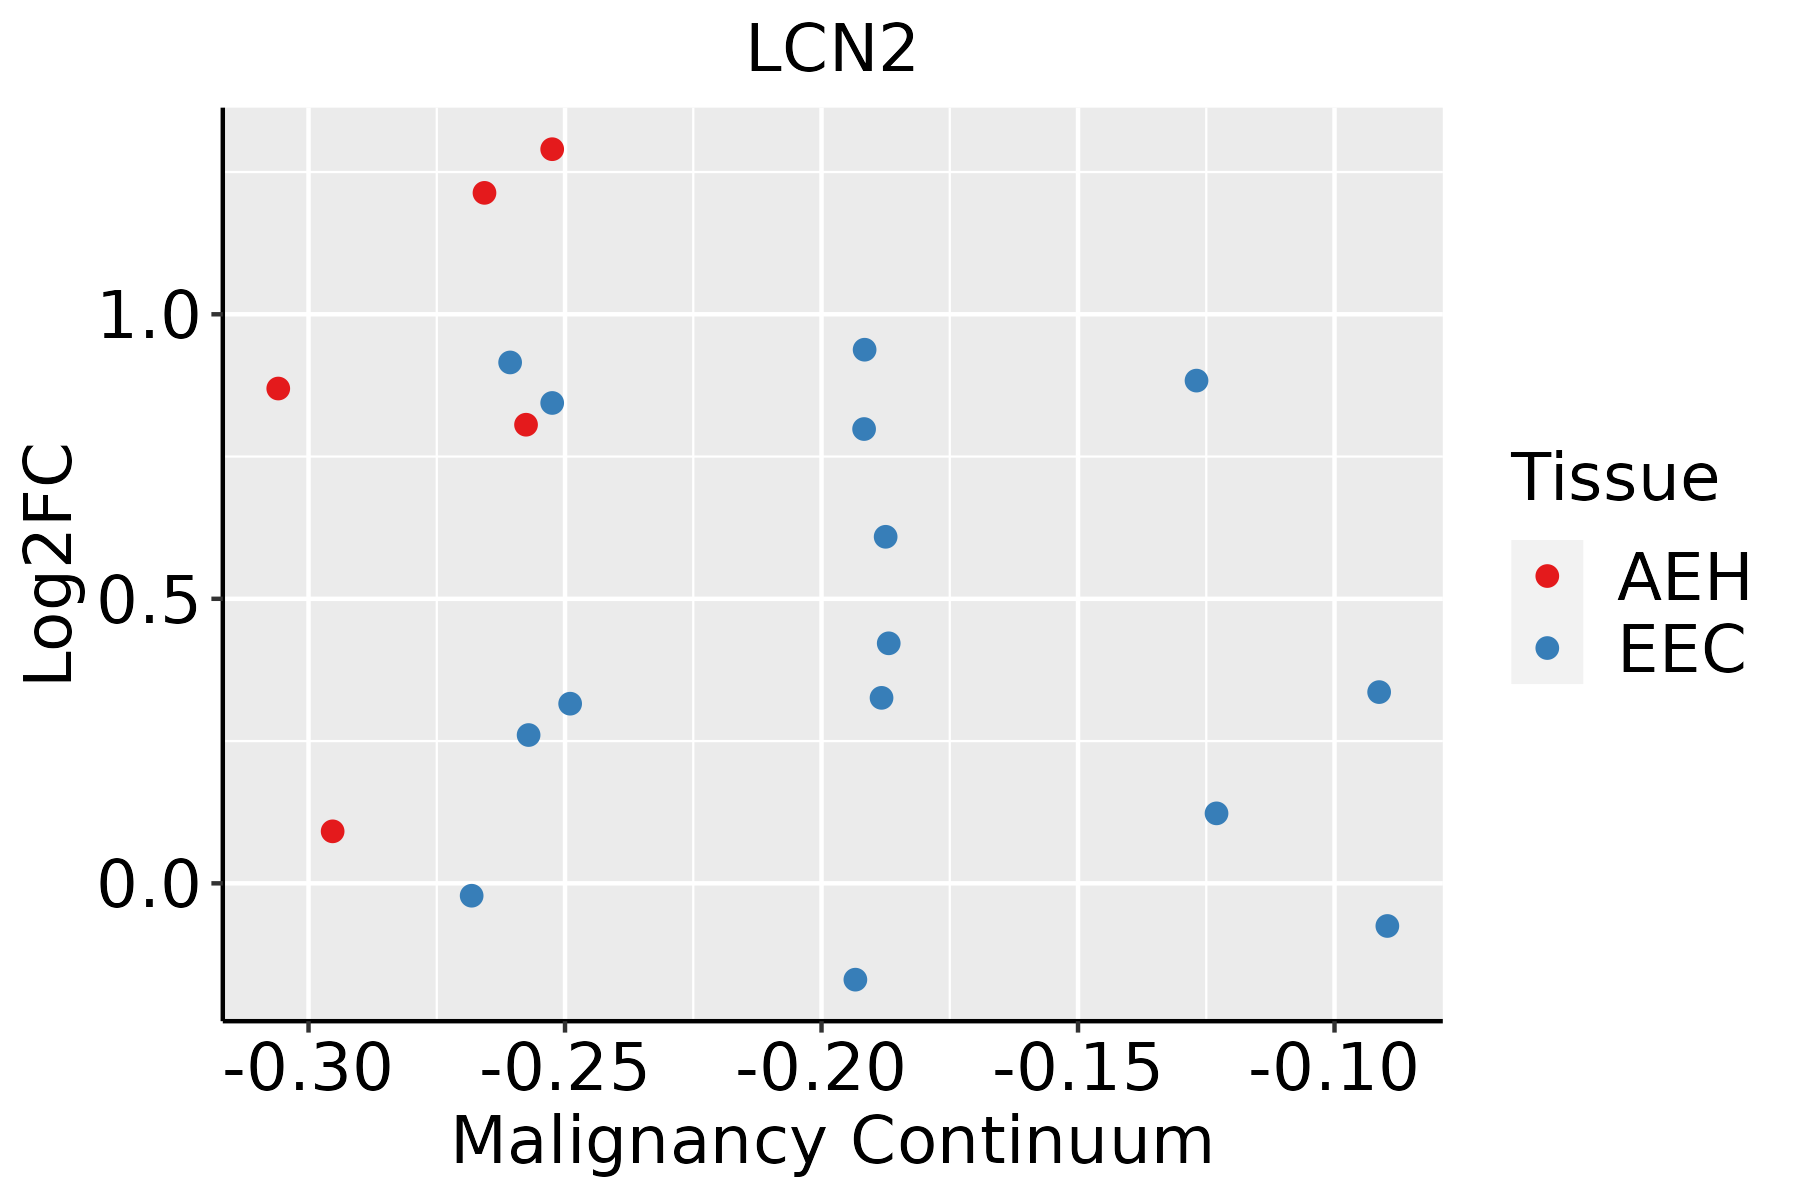 | AEH: Atypical endometrial hyperplasia |
| EEC: Endometrioid Cancer | ||
| Esophagus |  | ESCC: Esophageal squamous cell carcinoma |
| HGIN: High-grade intraepithelial neoplasias | ||
| LGIN: Low-grade intraepithelial neoplasias | ||
| GC |  | CAG: Chronic atrophic gastritis |
| CAG with IM: Chronic atrophic gastritis with intestinal metaplasia | ||
| CSG: Chronic superficial gastritis | ||
| GC: Gastric cancer | ||
| SIM: Severe intestinal metaplasia | ||
| WIM: Wild intestinal metaplasia | ||
| Liver |  | HCC: Hepatocellular carcinoma |
| NAFLD: Non-alcoholic fatty liver disease | ||
| Lung | 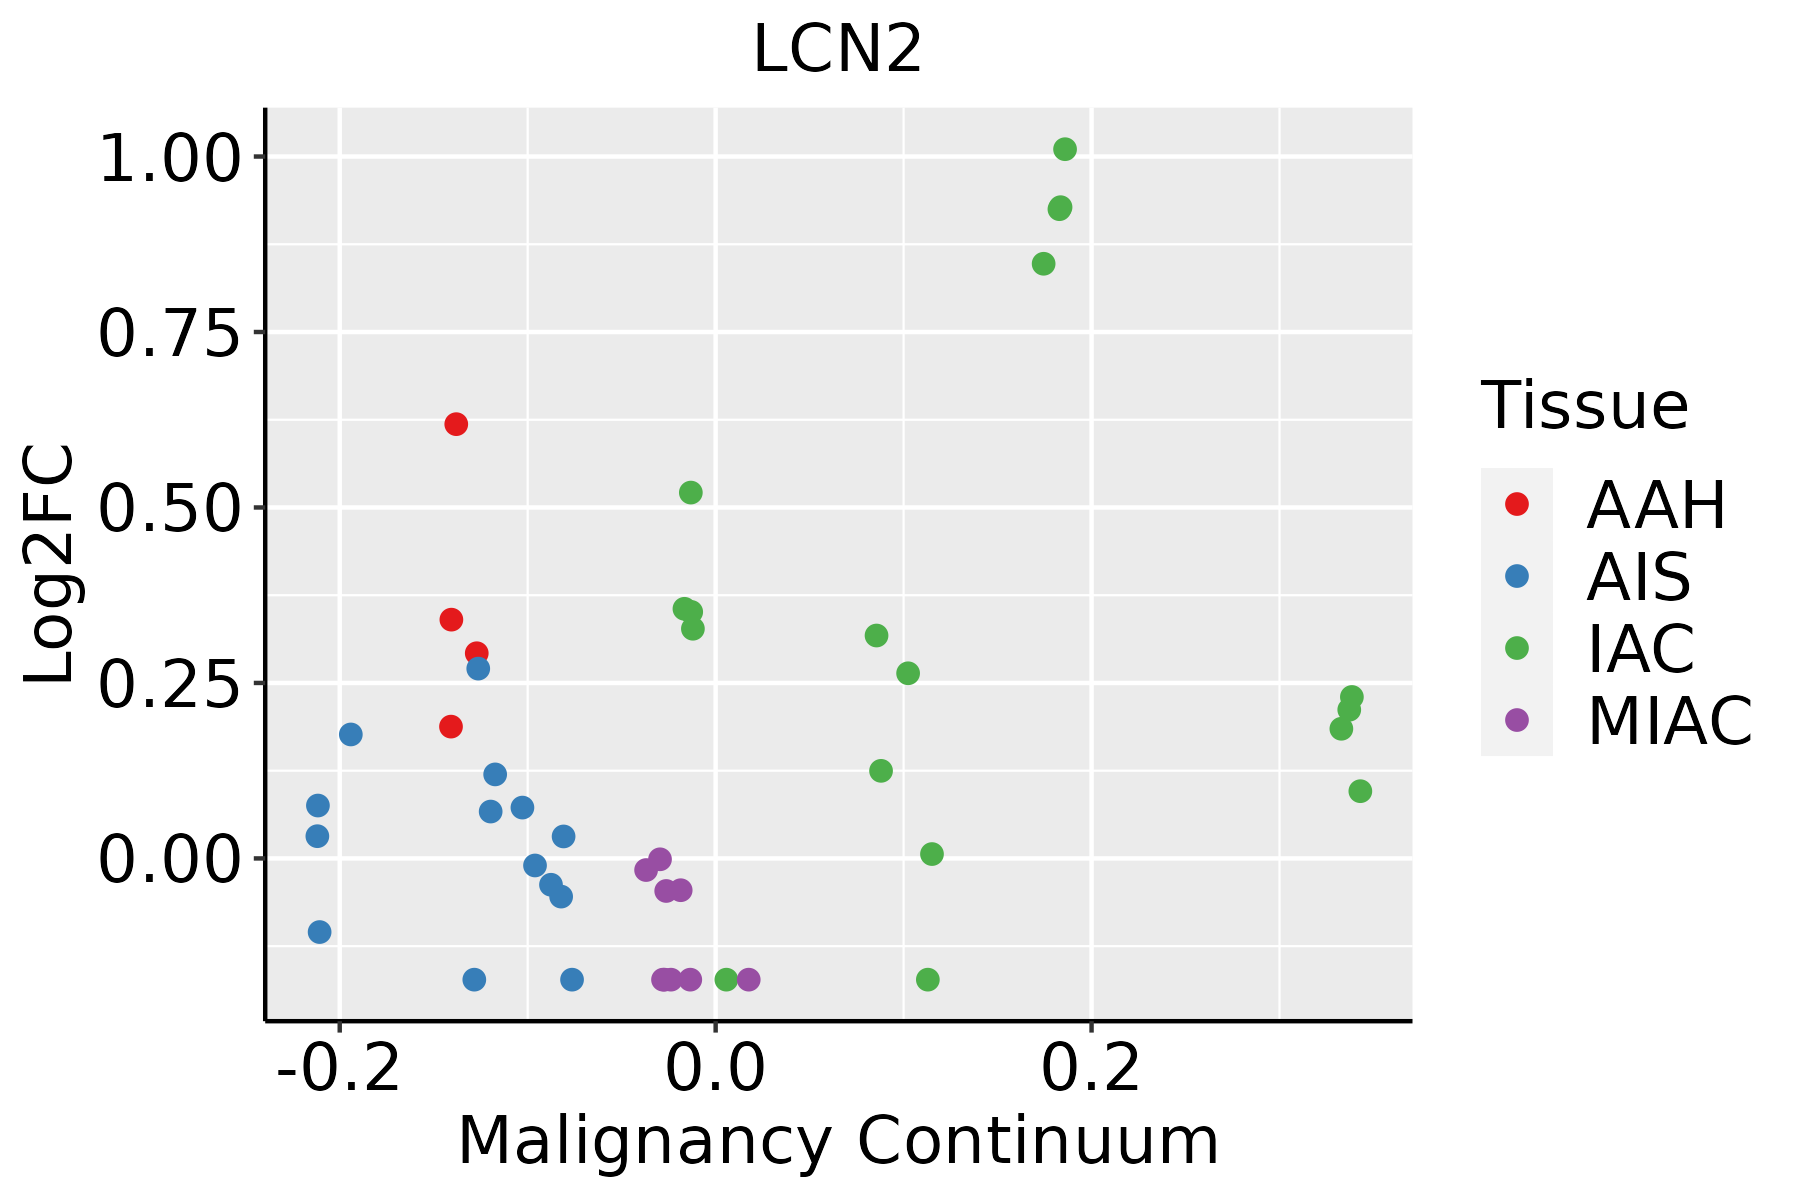 | AAH: Atypical adenomatous hyperplasia |
| AIS: Adenocarcinoma in situ | ||
| IAC: Invasive lung adenocarcinoma | ||
| MIA: Minimally invasive adenocarcinoma | ||
| Oral Cavity | 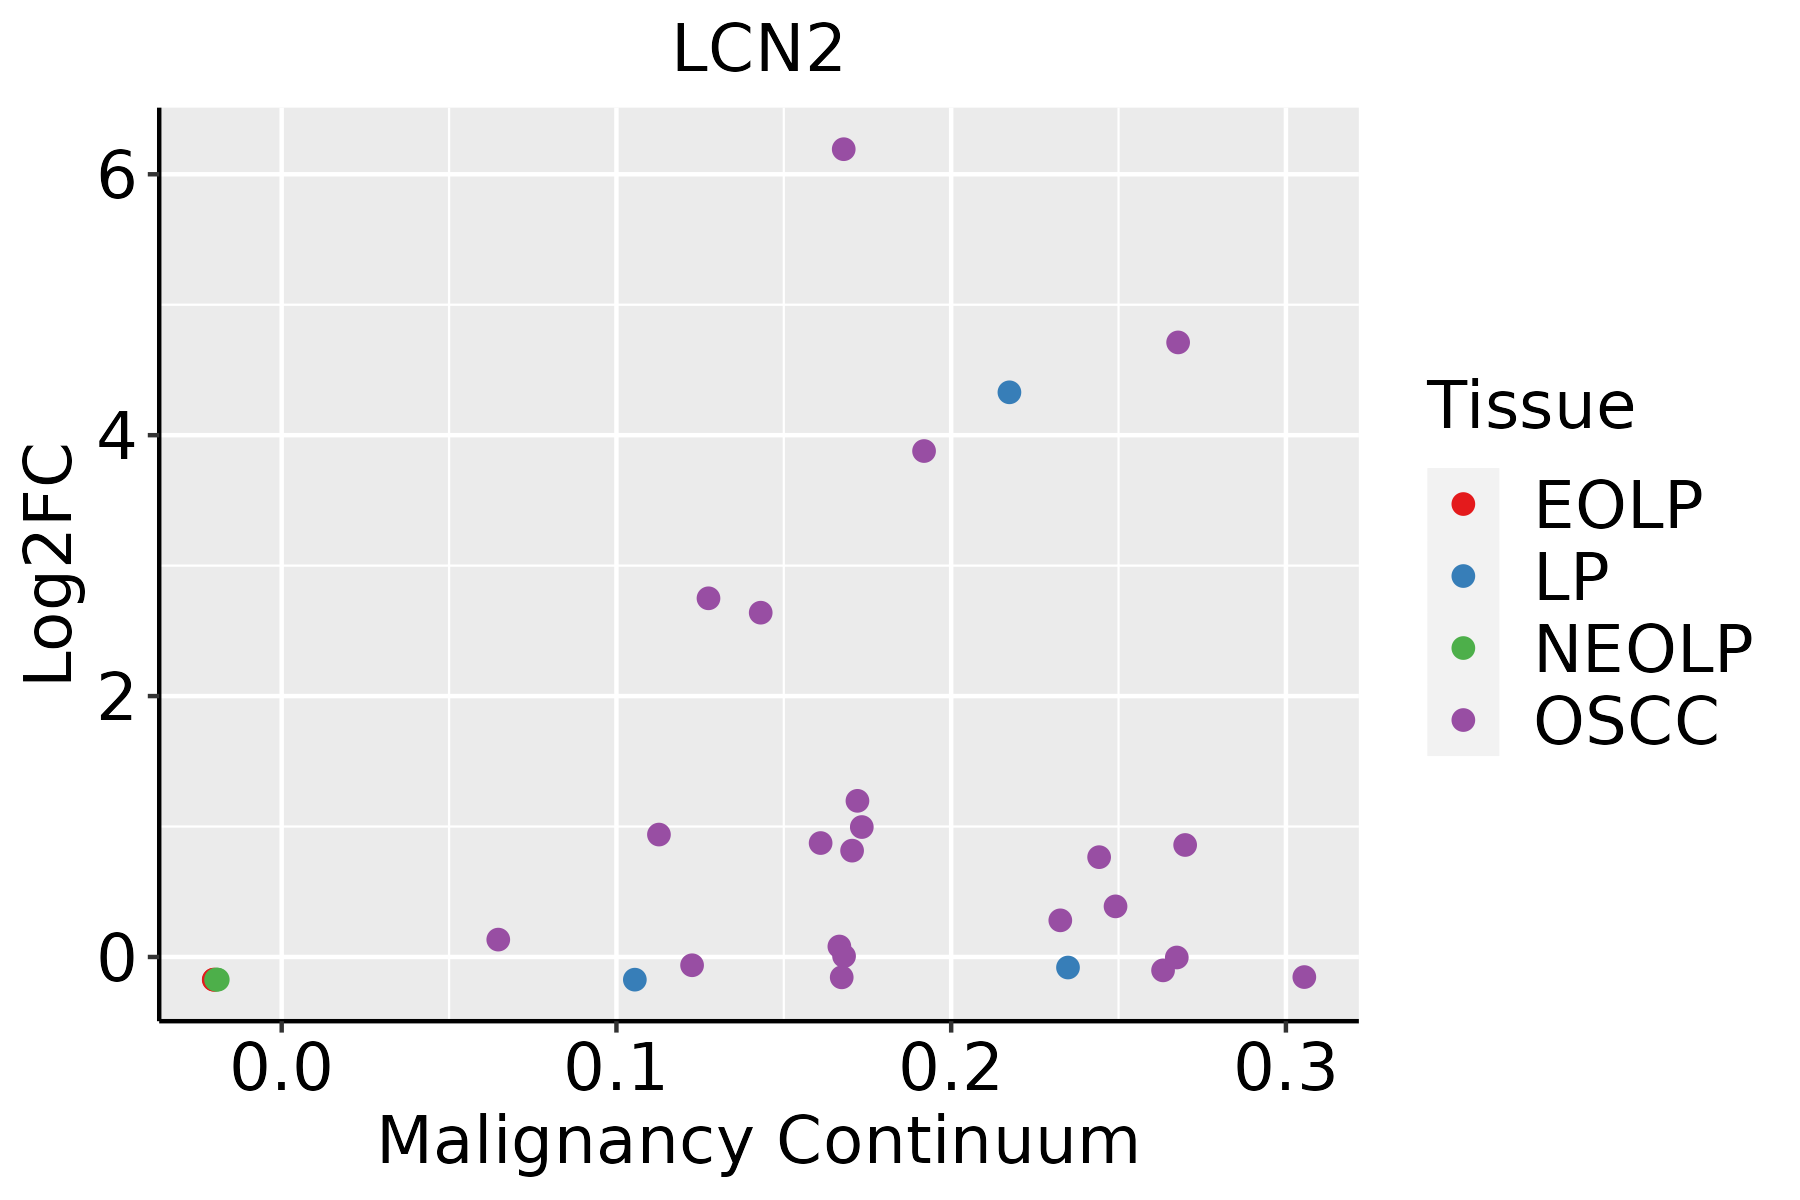 | EOLP: Erosive Oral lichen planus |
| LP: leukoplakia | ||
| NEOLP: Non-erosive oral lichen planus | ||
| OSCC: Oral squamous cell carcinoma | ||
| Prostate |  | BPH: Benign Prostatic Hyperplasia |
| Thyroid | 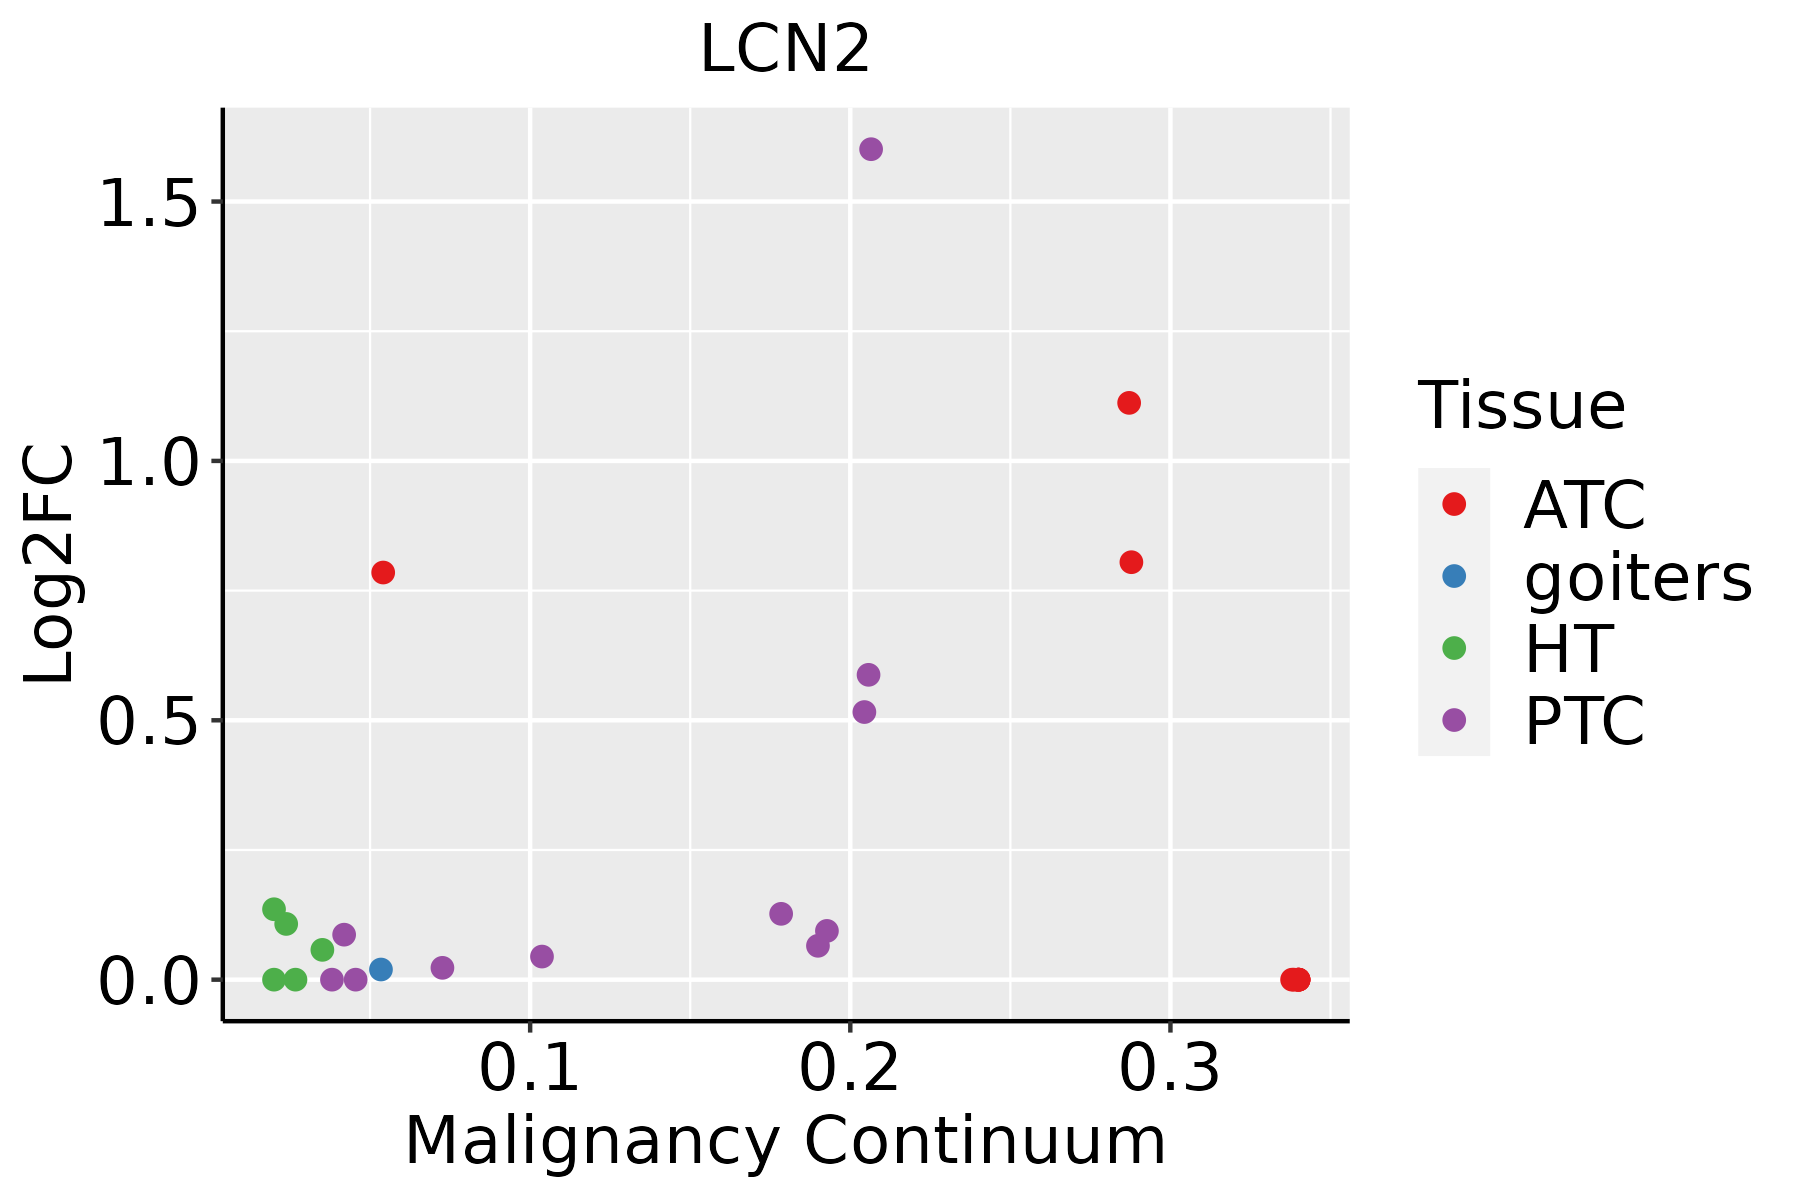 | ATC: Anaplastic thyroid cancer |
| HT: Hashimoto's thyroiditis | ||
| PTC: Papillary thyroid cancer |
| ∗log2FC in expression of this searched gene in stem-like cells from each diseased tissue sample relative to stem-like cells in normal samples in each tissue plotted against the malignancy continuum. Samples are colored based on if they are from different disease stage. |
Top |
Malignant transformation related pathway analysis |
| Find out the enriched GO biological processes and KEGG pathways involved in transition from healthy to precancer to cancer |
| Tissue | Disease Stage | Enriched GO biological Processes |
| Colorectum | AD |  |
| Colorectum | SER |  |
| Colorectum | MSS |  |
| Colorectum | MSI-H |  |
| Colorectum | FAP |  |
| ∗Top 15 enriched GO BP terms are showed in the bar plot of each disease state in each tissue. Each row represents a significant GO biological process which is colored according to the -log10(p.adjust). |
| Page: 1 2 3 4 5 6 7 8 9 |
| GO ID | Tissue | Disease Stage | Description | Gene Ratio | Bg Ratio | pvalue | p.adjust | Count |
| GO:00069799 | Breast | Precancer | response to oxidative stress | 70/1080 | 446/18723 | 1.59e-14 | 4.26e-12 | 70 |
| GO:00362939 | Breast | Precancer | response to decreased oxygen levels | 53/1080 | 322/18723 | 4.09e-12 | 6.84e-10 | 53 |
| GO:00704829 | Breast | Precancer | response to oxygen levels | 55/1080 | 347/18723 | 7.47e-12 | 1.11e-09 | 55 |
| GO:00621979 | Breast | Precancer | cellular response to chemical stress | 51/1080 | 337/18723 | 2.40e-10 | 2.34e-08 | 51 |
| GO:00003029 | Breast | Precancer | response to reactive oxygen species | 38/1080 | 222/18723 | 1.47e-09 | 1.23e-07 | 38 |
| GO:00362948 | Breast | Precancer | cellular response to decreased oxygen levels | 31/1080 | 161/18723 | 2.61e-09 | 2.11e-07 | 31 |
| GO:00714538 | Breast | Precancer | cellular response to oxygen levels | 32/1080 | 177/18723 | 7.32e-09 | 5.52e-07 | 32 |
| GO:00709979 | Breast | Precancer | neuron death | 50/1080 | 361/18723 | 7.75e-09 | 5.70e-07 | 50 |
| GO:00514029 | Breast | Precancer | neuron apoptotic process | 38/1080 | 246/18723 | 2.68e-08 | 1.75e-06 | 38 |
| GO:00345999 | Breast | Precancer | cellular response to oxidative stress | 42/1080 | 288/18723 | 2.78e-08 | 1.79e-06 | 42 |
| GO:00425429 | Breast | Precancer | response to hydrogen peroxide | 26/1080 | 146/18723 | 2.52e-07 | 1.26e-05 | 26 |
| GO:00100389 | Breast | Precancer | response to metal ion | 47/1080 | 373/18723 | 3.88e-07 | 1.79e-05 | 47 |
| GO:19012149 | Breast | Precancer | regulation of neuron death | 41/1080 | 319/18723 | 1.27e-06 | 4.80e-05 | 41 |
| GO:00435237 | Breast | Precancer | regulation of neuron apoptotic process | 31/1080 | 212/18723 | 1.69e-06 | 6.08e-05 | 31 |
| GO:00512358 | Breast | Precancer | maintenance of location | 40/1080 | 327/18723 | 5.85e-06 | 1.71e-04 | 40 |
| GO:00516519 | Breast | Precancer | maintenance of location in cell | 30/1080 | 214/18723 | 5.91e-06 | 1.71e-04 | 30 |
| GO:00022378 | Breast | Precancer | response to molecule of bacterial origin | 43/1080 | 363/18723 | 6.05e-06 | 1.72e-04 | 43 |
| GO:00324968 | Breast | Precancer | response to lipopolysaccharide | 41/1080 | 343/18723 | 7.94e-06 | 2.17e-04 | 41 |
| GO:00512383 | Breast | Precancer | sequestering of metal ion | 7/1080 | 16/18723 | 1.50e-05 | 3.71e-04 | 7 |
| GO:00106348 | Breast | Precancer | positive regulation of epithelial cell migration | 25/1080 | 176/18723 | 2.75e-05 | 6.21e-04 | 25 |
| Page: 1 2 3 4 5 6 7 8 9 10 11 12 13 14 15 16 17 18 19 20 21 22 23 24 25 26 27 28 29 30 31 32 33 34 35 36 37 38 39 40 41 42 43 44 45 46 47 48 49 50 51 52 53 54 55 56 57 58 59 60 61 62 63 64 65 66 67 68 69 70 71 72 73 74 |
| Pathway ID | Tissue | Disease Stage | Description | Gene Ratio | Bg Ratio | pvalue | p.adjust | qvalue | Count |
| hsa0465716 | Breast | Precancer | IL-17 signaling pathway | 20/684 | 94/8465 | 4.74e-05 | 4.54e-04 | 3.48e-04 | 20 |
| hsa0465717 | Breast | Precancer | IL-17 signaling pathway | 20/684 | 94/8465 | 4.74e-05 | 4.54e-04 | 3.48e-04 | 20 |
| hsa0465721 | Breast | IDC | IL-17 signaling pathway | 18/867 | 94/8465 | 6.39e-03 | 3.30e-02 | 2.47e-02 | 18 |
| hsa0465731 | Breast | IDC | IL-17 signaling pathway | 18/867 | 94/8465 | 6.39e-03 | 3.30e-02 | 2.47e-02 | 18 |
| hsa0465741 | Breast | DCIS | IL-17 signaling pathway | 18/846 | 94/8465 | 4.95e-03 | 2.67e-02 | 1.96e-02 | 18 |
| hsa0465751 | Breast | DCIS | IL-17 signaling pathway | 18/846 | 94/8465 | 4.95e-03 | 2.67e-02 | 1.96e-02 | 18 |
| hsa0465718 | Cervix | CC | IL-17 signaling pathway | 31/1267 | 94/8465 | 8.71e-06 | 7.43e-05 | 4.39e-05 | 31 |
| hsa0465719 | Cervix | CC | IL-17 signaling pathway | 31/1267 | 94/8465 | 8.71e-06 | 7.43e-05 | 4.39e-05 | 31 |
| hsa0465722 | Cervix | HSIL_HPV | IL-17 signaling pathway | 15/459 | 94/8465 | 1.45e-04 | 1.74e-03 | 1.40e-03 | 15 |
| hsa0465732 | Cervix | HSIL_HPV | IL-17 signaling pathway | 15/459 | 94/8465 | 1.45e-04 | 1.74e-03 | 1.40e-03 | 15 |
| hsa0465742 | Cervix | N_HPV | IL-17 signaling pathway | 16/349 | 94/8465 | 1.20e-06 | 1.64e-05 | 1.28e-05 | 16 |
| hsa0465752 | Cervix | N_HPV | IL-17 signaling pathway | 16/349 | 94/8465 | 1.20e-06 | 1.64e-05 | 1.28e-05 | 16 |
| hsa0465720 | Endometrium | EEC | IL-17 signaling pathway | 23/1237 | 94/8465 | 7.61e-03 | 3.63e-02 | 2.71e-02 | 23 |
| hsa04657110 | Endometrium | EEC | IL-17 signaling pathway | 23/1237 | 94/8465 | 7.61e-03 | 3.63e-02 | 2.71e-02 | 23 |
| hsa0465726 | Esophagus | HGIN | IL-17 signaling pathway | 25/1383 | 94/8465 | 7.52e-03 | 4.63e-02 | 3.68e-02 | 25 |
| hsa04657113 | Esophagus | HGIN | IL-17 signaling pathway | 25/1383 | 94/8465 | 7.52e-03 | 4.63e-02 | 3.68e-02 | 25 |
| hsa0465727 | Esophagus | ESCC | IL-17 signaling pathway | 66/4205 | 94/8465 | 3.93e-05 | 1.75e-04 | 8.99e-05 | 66 |
| hsa0465734 | Esophagus | ESCC | IL-17 signaling pathway | 66/4205 | 94/8465 | 3.93e-05 | 1.75e-04 | 8.99e-05 | 66 |
| hsa0465714 | Lung | IAC | IL-17 signaling pathway | 20/1053 | 94/8465 | 1.05e-02 | 3.90e-02 | 2.59e-02 | 20 |
| hsa0465715 | Lung | IAC | IL-17 signaling pathway | 20/1053 | 94/8465 | 1.05e-02 | 3.90e-02 | 2.59e-02 | 20 |
| Page: 1 2 |
Top |
Cell-cell communication analysis |
| Identification of potential cell-cell interactions between two cell types and their ligand-receptor pairs for different disease states |
| Ligand | Receptor | LRpair | Pathway | Tissue | Disease Stage |
| Page: 1 |
Top |
Single-cell gene regulatory network inference analysis |
| Find out the significant the regulons (TFs) and the target genes of each regulon across cell types for different disease states |
| TF | Cell Type | Tissue | Disease Stage | Target Gene | RSS | Regulon Activity |
| ∗The dot plots of a searched regulon are shown for all cell subpopulations in each disease state of each tissue based on the regulon specific score inferred using pySCENIC and by calculating the average expression. |
| Page: 1 |
Top |
Somatic mutation of malignant transformation related genes |
| Annotation of somatic variants for genes involved in malignant transformation |
| Hugo Symbol | Variant Class | Variant Classification | dbSNP RS | HGVSc | HGVSp | HGVSp Short | SWISSPROT | BIOTYPE | SIFT | PolyPhen | Tumor Sample Barcode | Tissue | Histology | Sex | Age | Stage | Therapy Types | Drugs | Outcome |
| LCN2 | SNV | Missense_Mutation | rs368254779 | c.497N>T | p.Ser166Leu | p.S166L | P80188 | protein_coding | tolerated(0.16) | benign(0.01) | TCGA-EI-6917-01 | Colorectum | rectum adenocarcinoma | Male | <65 | III/IV | Chemotherapy | 5fluorouracil+oxaciplatina+l-folinian | SD |
| LCN2 | SNV | Missense_Mutation | novel | c.237N>T | p.Lys79Asn | p.K79N | P80188 | protein_coding | tolerated(0.38) | benign(0.04) | TCGA-AJ-A3EL-01 | Endometrium | uterine corpus endometrioid carcinoma | Female | <65 | I/II | Unknown | Unknown | SD |
| LCN2 | SNV | Missense_Mutation | c.469N>A | p.Leu157Ile | p.L157I | P80188 | protein_coding | deleterious(0) | probably_damaging(0.997) | TCGA-AP-A054-01 | Endometrium | uterine corpus endometrioid carcinoma | Female | <65 | III/IV | Chemotherapy | carboplatin | PD | |
| LCN2 | SNV | Missense_Mutation | novel | c.217G>A | p.Ala73Thr | p.A73T | P80188 | protein_coding | tolerated(0.61) | benign(0.007) | TCGA-B5-A3FA-01 | Endometrium | uterine corpus endometrioid carcinoma | Female | >=65 | I/II | Unknown | Unknown | SD |
| LCN2 | SNV | Missense_Mutation | novel | c.395G>A | p.Ser132Asn | p.S132N | P80188 | protein_coding | tolerated(0.14) | benign(0) | TCGA-B5-A3FC-01 | Endometrium | uterine corpus endometrioid carcinoma | Female | <65 | I/II | Unknown | Unknown | SD |
| LCN2 | SNV | Missense_Mutation | rs781387356 | c.282N>T | p.Lys94Asn | p.K94N | P80188 | protein_coding | tolerated(0.18) | benign(0) | TCGA-EO-A22U-01 | Endometrium | uterine corpus endometrioid carcinoma | Female | >=65 | I/II | Unknown | Unknown | SD |
| LCN2 | SNV | Missense_Mutation | novel | c.298A>C | p.Ile100Leu | p.I100L | P80188 | protein_coding | tolerated(0.14) | benign(0.026) | TCGA-EO-A22X-01 | Endometrium | uterine corpus endometrioid carcinoma | Female | <65 | III/IV | Unspecific | Carboplatin | Complete Response |
| LCN2 | SNV | Missense_Mutation | novel | c.277N>G | p.Lys93Glu | p.K93E | P80188 | protein_coding | tolerated(0.36) | benign(0) | TCGA-EO-A3AY-01 | Endometrium | uterine corpus endometrioid carcinoma | Female | <65 | I/II | Unknown | Unknown | PD |
| LCN2 | SNV | Missense_Mutation | rs748856765 | c.432N>T | p.Lys144Asn | p.K144N | P80188 | protein_coding | tolerated(0.06) | benign(0.153) | TCGA-EO-A3AY-01 | Endometrium | uterine corpus endometrioid carcinoma | Female | <65 | I/II | Unknown | Unknown | PD |
| LCN2 | SNV | Missense_Mutation | c.132C>A | p.Asp44Glu | p.D44E | P80188 | protein_coding | tolerated(0.3) | benign(0.007) | TCGA-BC-A3KF-01 | Liver | liver hepatocellular carcinoma | Female | >=65 | I/II | Unknown | Unknown | SD |
| Page: 1 2 3 |
Top |
Related drugs of malignant transformation related genes |
| Identification of chemicals and drugs interact with genes involved in malignant transfromation |
| (DGIdb 4.0) |
| Entrez ID | Symbol | Category | Interaction Types | Drug Claim Name | Drug Name | PMIDs |
| Page: 1 |

Copyright 2023-Present -The University of Texas Health Science Center at Houston |