
|
|||||
|
 | |
| |
| |
| |
| |
| |
|
Gene: LCAT |
Gene summary for LCAT |
| Gene information | Species | Human | Gene symbol | LCAT | Gene ID | 3931 |
| Gene name | lecithin-cholesterol acyltransferase | |
| Gene Alias | LCAT | |
| Cytomap | 16q22.1 | |
| Gene Type | protein-coding | GO ID | GO:0006066 | UniProtAcc | A0A140VK24 |
Top |
Malignant transformation analysis |
| Identification of the aberrant gene expression in precancerous and cancerous lesions by comparing the gene expression of stem-like cells in diseased tissues with normal stem cells |
| Entrez ID | Symbol | Replicates | Species | Organ | Tissue | Adj P-value | Log2FC | Malignancy |
| 3931 | LCAT | male-WTA | Human | Thyroid | PTC | 2.77e-07 | 1.24e-01 | 0.1037 |
| 3931 | LCAT | PTC04 | Human | Thyroid | PTC | 5.43e-04 | 1.16e-01 | 0.1927 |
| 3931 | LCAT | PTC05 | Human | Thyroid | PTC | 1.59e-03 | 1.74e-01 | 0.2065 |
| 3931 | LCAT | PTC06 | Human | Thyroid | PTC | 5.58e-03 | 8.07e-02 | 0.2057 |
| 3931 | LCAT | PTC07 | Human | Thyroid | PTC | 1.28e-08 | 1.22e-01 | 0.2044 |
| 3931 | LCAT | ATC12 | Human | Thyroid | ATC | 5.43e-04 | 1.05e-01 | 0.34 |
| 3931 | LCAT | ATC13 | Human | Thyroid | ATC | 2.12e-37 | 5.56e-01 | 0.34 |
| 3931 | LCAT | ATC3 | Human | Thyroid | ATC | 1.02e-02 | 2.21e-01 | 0.338 |
| 3931 | LCAT | ATC4 | Human | Thyroid | ATC | 3.60e-04 | 1.34e-01 | 0.34 |
| 3931 | LCAT | ATC5 | Human | Thyroid | ATC | 4.37e-34 | 5.99e-01 | 0.34 |
| Page: 1 |
| Tissue | Expression Dynamics | Abbreviation |
| Thyroid | 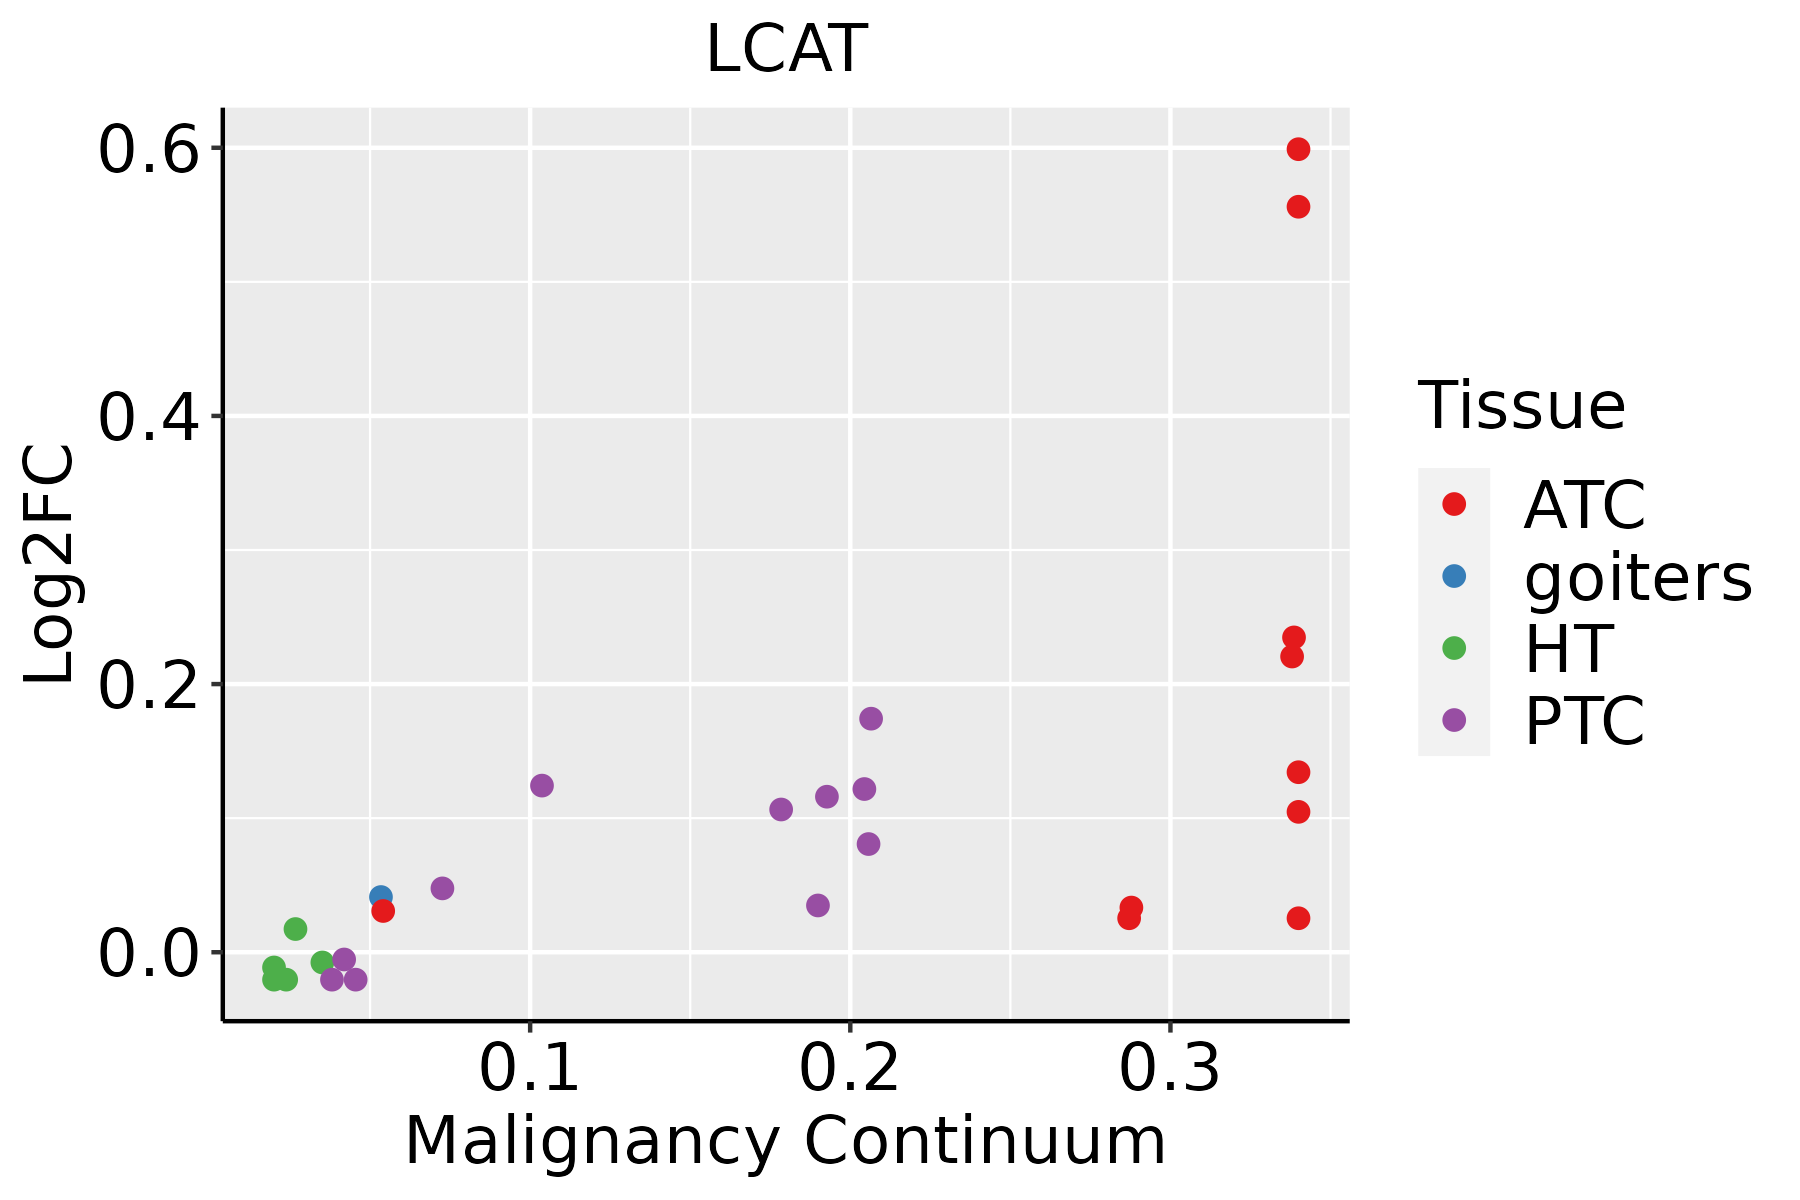 | ATC: Anaplastic thyroid cancer |
| HT: Hashimoto's thyroiditis | ||
| PTC: Papillary thyroid cancer |
| ∗log2FC in expression of this searched gene in stem-like cells from each diseased tissue sample relative to stem-like cells in normal samples in each tissue plotted against the malignancy continuum. Samples are colored based on if they are from different disease stage. |
Top |
Malignant transformation related pathway analysis |
| Find out the enriched GO biological processes and KEGG pathways involved in transition from healthy to precancer to cancer |
| Tissue | Disease Stage | Enriched GO biological Processes |
| Colorectum | AD |  |
| Colorectum | SER |  |
| Colorectum | MSS |  |
| Colorectum | MSI-H |  |
| Colorectum | FAP |  |
| ∗Top 15 enriched GO BP terms are showed in the bar plot of each disease state in each tissue. Each row represents a significant GO biological process which is colored according to the -log10(p.adjust). |
| Page: 1 2 3 4 5 6 7 8 9 |
| GO ID | Tissue | Disease Stage | Description | Gene Ratio | Bg Ratio | pvalue | p.adjust | Count |
| GO:0043254113 | Thyroid | PTC | regulation of protein-containing complex assembly | 215/5968 | 428/18723 | 1.23e-15 | 9.09e-14 | 215 |
| GO:0043254210 | Thyroid | ATC | regulation of protein-containing complex assembly | 225/6293 | 428/18723 | 2.72e-16 | 2.33e-14 | 225 |
| Page: 1 |
| Pathway ID | Tissue | Disease Stage | Description | Gene Ratio | Bg Ratio | pvalue | p.adjust | qvalue | Count |
| Page: 1 |
Top |
Cell-cell communication analysis |
| Identification of potential cell-cell interactions between two cell types and their ligand-receptor pairs for different disease states |
| Ligand | Receptor | LRpair | Pathway | Tissue | Disease Stage |
| Page: 1 |
Top |
Single-cell gene regulatory network inference analysis |
| Find out the significant the regulons (TFs) and the target genes of each regulon across cell types for different disease states |
| TF | Cell Type | Tissue | Disease Stage | Target Gene | RSS | Regulon Activity |
| ∗The dot plots of a searched regulon are shown for all cell subpopulations in each disease state of each tissue based on the regulon specific score inferred using pySCENIC and by calculating the average expression. |
| Page: 1 |
Top |
Somatic mutation of malignant transformation related genes |
| Annotation of somatic variants for genes involved in malignant transformation |
| Hugo Symbol | Variant Class | Variant Classification | dbSNP RS | HGVSc | HGVSp | HGVSp Short | SWISSPROT | BIOTYPE | SIFT | PolyPhen | Tumor Sample Barcode | Tissue | Histology | Sex | Age | Stage | Therapy Types | Drugs | Outcome |
| LCAT | SNV | Missense_Mutation | c.94T>A | p.Phe32Ile | p.F32I | P04180 | protein_coding | deleterious(0) | probably_damaging(0.994) | TCGA-AR-A1AS-01 | Breast | breast invasive carcinoma | Female | <65 | I/II | Chemotherapy | doxorubicin | SD | |
| LCAT | SNV | Missense_Mutation | c.1099N>C | p.Asp367His | p.D367H | P04180 | protein_coding | deleterious(0) | probably_damaging(0.995) | TCGA-LP-A5U2-01 | Cervix | cervical & endocervical cancer | Female | <65 | III/IV | Unknown | Unknown | SD | |
| LCAT | SNV | Missense_Mutation | novel | c.706N>T | p.Pro236Ser | p.P236S | P04180 | protein_coding | deleterious(0.01) | probably_damaging(0.999) | TCGA-VS-A958-01 | Cervix | cervical & endocervical cancer | Female | <65 | I/II | Chemotherapy | cisplatin | CR |
| LCAT | SNV | Missense_Mutation | c.989N>T | p.Ala330Val | p.A330V | P04180 | protein_coding | deleterious(0) | possibly_damaging(0.843) | TCGA-AA-3663-01 | Colorectum | colon adenocarcinoma | Male | <65 | I/II | Unknown | Unknown | SD | |
| LCAT | SNV | Missense_Mutation | c.563T>C | p.Val188Ala | p.V188A | P04180 | protein_coding | deleterious(0) | probably_damaging(0.936) | TCGA-AZ-6598-01 | Colorectum | colon adenocarcinoma | Female | >=65 | I/II | Unknown | Unknown | SD | |
| LCAT | SNV | Missense_Mutation | c.19C>T | p.Pro7Ser | p.P7S | P04180 | protein_coding | deleterious_low_confidence(0.01) | benign(0.023) | TCGA-CK-4951-01 | Colorectum | colon adenocarcinoma | Female | >=65 | I/II | Unknown | Unknown | PD | |
| LCAT | SNV | Missense_Mutation | c.17C>T | p.Ser6Phe | p.S6F | P04180 | protein_coding | deleterious_low_confidence(0) | benign(0.001) | TCGA-CK-4951-01 | Colorectum | colon adenocarcinoma | Female | >=65 | I/II | Unknown | Unknown | PD | |
| LCAT | SNV | Missense_Mutation | c.1127G>T | p.Ser376Ile | p.S376I | P04180 | protein_coding | deleterious(0) | probably_damaging(0.999) | TCGA-D5-6930-01 | Colorectum | colon adenocarcinoma | Male | >=65 | I/II | Unknown | Unknown | SD | |
| LCAT | SNV | Missense_Mutation | novel | c.970N>A | p.Leu324Ile | p.L324I | P04180 | protein_coding | deleterious(0) | possibly_damaging(0.71) | TCGA-F5-6814-01 | Colorectum | rectum adenocarcinoma | Male | <65 | I/II | Unknown | Unknown | SD |
| LCAT | SNV | Missense_Mutation | c.145G>A | p.Val49Ile | p.V49I | P04180 | protein_coding | tolerated(0.17) | benign(0.001) | TCGA-AJ-A3BG-01 | Endometrium | uterine corpus endometrioid carcinoma | Female | >=65 | I/II | Chemotherapy | carboplatin | PD |
| Page: 1 2 3 4 |
Top |
Related drugs of malignant transformation related genes |
| Identification of chemicals and drugs interact with genes involved in malignant transfromation |
| (DGIdb 4.0) |
| Entrez ID | Symbol | Category | Interaction Types | Drug Claim Name | Drug Name | PMIDs |
| 3931 | LCAT | ENZYME, TRANSPORTER, DRUGGABLE GENOME | MEDI6012 | RECOMBINANT HUMAN LECITHIN:CHOLESTEROL ACYLTRANSFERASE | 25657982 | |
| 3931 | LCAT | ENZYME, TRANSPORTER, DRUGGABLE GENOME | STREPTOZOTOCIN | STREPTOZOCIN | 18436977 | |
| 3931 | LCAT | ENZYME, TRANSPORTER, DRUGGABLE GENOME | TESTOSTERONE PROPIONATE | 3766045 | ||
| 3931 | LCAT | ENZYME, TRANSPORTER, DRUGGABLE GENOME | TESTOSTERONE | TESTOSTERONE | 3383436 | |
| 3931 | LCAT | ENZYME, TRANSPORTER, DRUGGABLE GENOME | PREDNISOLONE | PREDNISOLONE | 2314540 |
| Page: 1 |

Copyright 2023-Present -The University of Texas Health Science Center at Houston |