
|
|||||
|
 | |
| |
| |
| |
| |
| |
|
Gene: LBP |
Gene summary for LBP |
| Gene information | Species | Human | Gene symbol | LBP | Gene ID | 3929 |
| Gene name | lipopolysaccharide binding protein | |
| Gene Alias | BPIFD2 | |
| Cytomap | 20q11.23 | |
| Gene Type | protein-coding | GO ID | GO:0001775 | UniProtAcc | P18428 |
Top |
Malignant transformation analysis |
| Identification of the aberrant gene expression in precancerous and cancerous lesions by comparing the gene expression of stem-like cells in diseased tissues with normal stem cells |
| Entrez ID | Symbol | Replicates | Species | Organ | Tissue | Adj P-value | Log2FC | Malignancy |
| 3929 | LBP | NAFLD1 | Human | Liver | NAFLD | 1.07e-12 | 1.14e+00 | -0.04 |
| 3929 | LBP | S43 | Human | Liver | Cirrhotic | 2.63e-03 | 7.42e-02 | -0.0187 |
| 3929 | LBP | HCC1_Meng | Human | Liver | HCC | 1.47e-88 | 9.14e-01 | 0.0246 |
| 3929 | LBP | HCC2_Meng | Human | Liver | HCC | 3.31e-07 | -2.61e-01 | 0.0107 |
| 3929 | LBP | cirrhotic1 | Human | Liver | Cirrhotic | 1.49e-07 | -2.51e-01 | 0.0202 |
| 3929 | LBP | cirrhotic2 | Human | Liver | Cirrhotic | 1.11e-04 | -2.33e-01 | 0.0201 |
| 3929 | LBP | HCC1 | Human | Liver | HCC | 5.58e-09 | 3.73e+00 | 0.5336 |
| 3929 | LBP | HCC2 | Human | Liver | HCC | 2.68e-05 | 5.21e+00 | 0.5341 |
| 3929 | LBP | Pt13.a | Human | Liver | HCC | 2.28e-06 | 2.59e-01 | 0.021 |
| 3929 | LBP | Pt13.b | Human | Liver | HCC | 1.93e-23 | 3.97e-01 | 0.0251 |
| 3929 | LBP | Pt14.b | Human | Liver | HCC | 2.79e-05 | 1.30e-01 | 0.018 |
| 3929 | LBP | S027 | Human | Liver | HCC | 3.51e-25 | 3.04e+00 | 0.2446 |
| 3929 | LBP | S028 | Human | Liver | HCC | 9.12e-50 | 3.19e+00 | 0.2503 |
| 3929 | LBP | S029 | Human | Liver | HCC | 1.08e-62 | 4.08e+00 | 0.2581 |
| Page: 1 |
| Tissue | Expression Dynamics | Abbreviation |
| Liver | 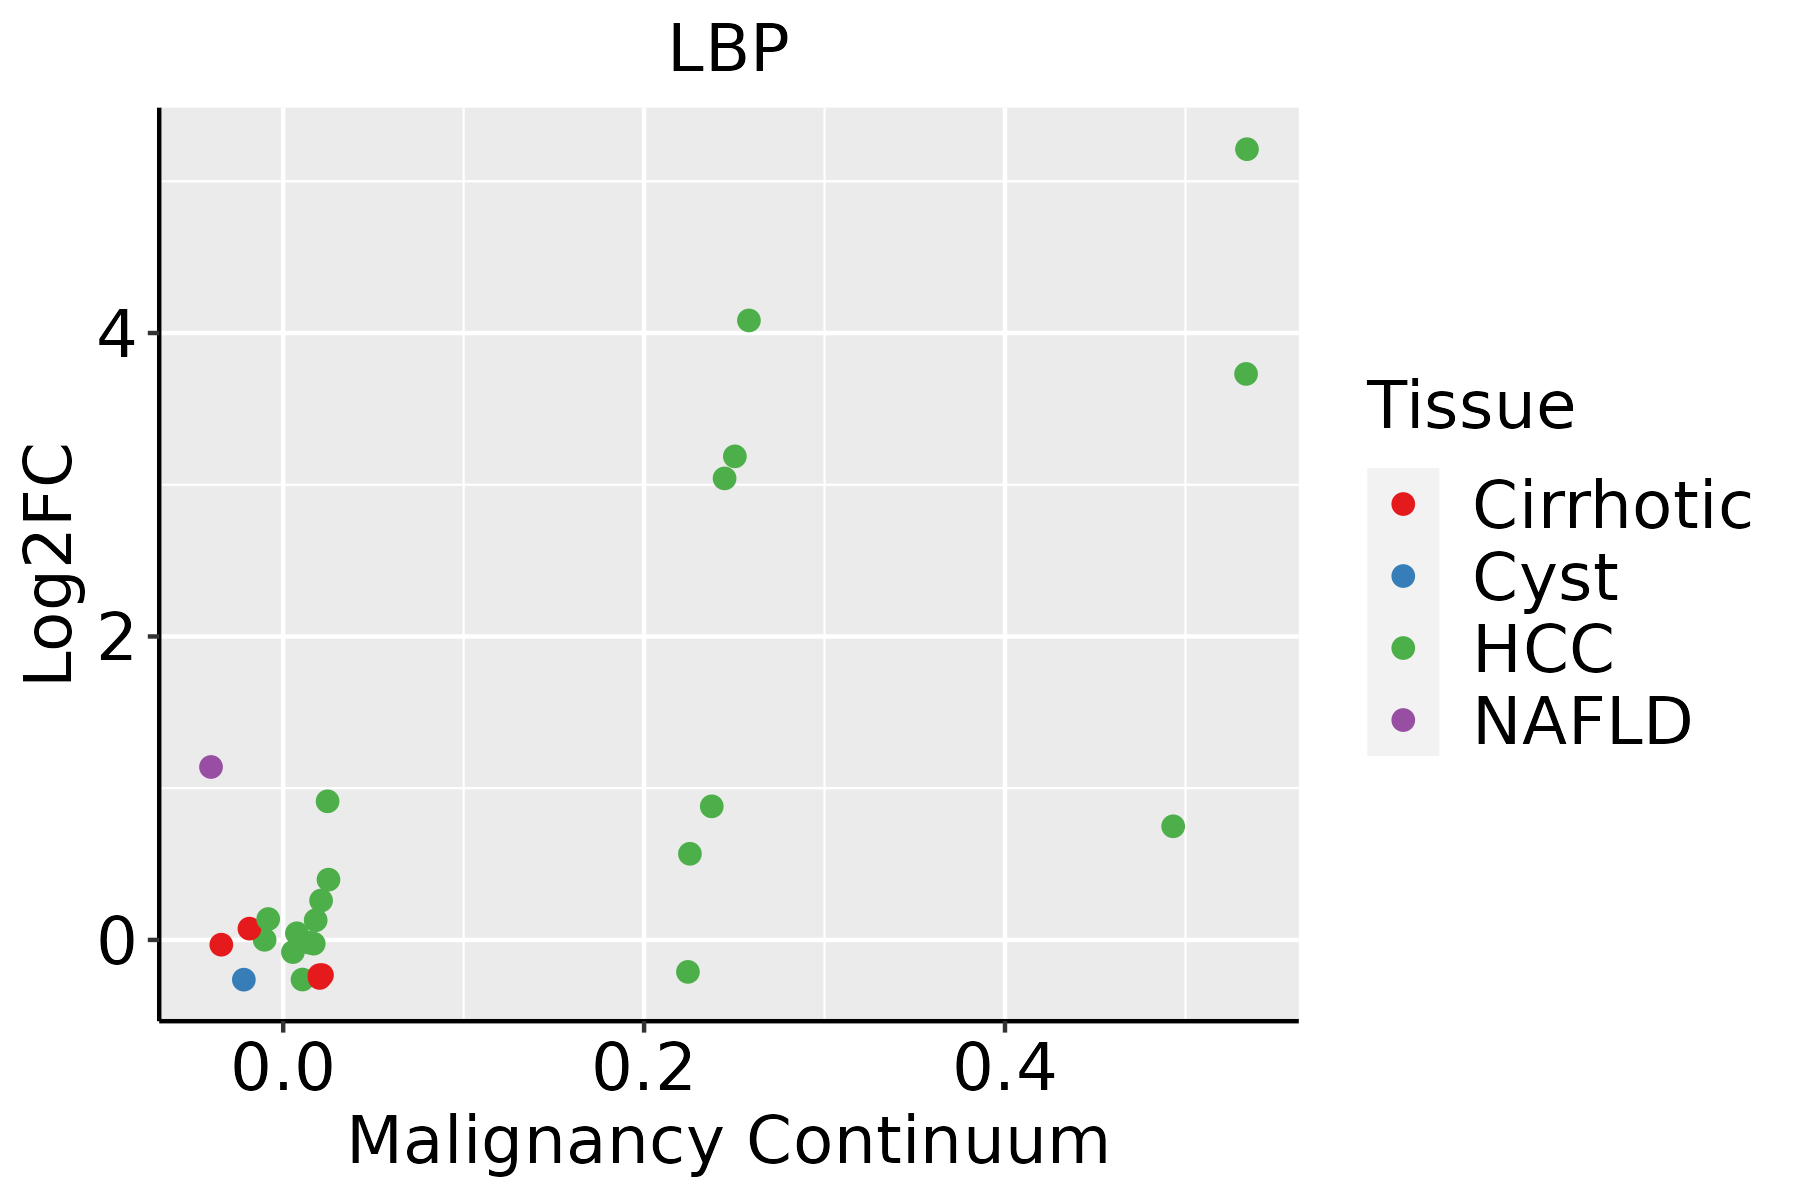 | HCC: Hepatocellular carcinoma |
| NAFLD: Non-alcoholic fatty liver disease |
| ∗log2FC in expression of this searched gene in stem-like cells from each diseased tissue sample relative to stem-like cells in normal samples in each tissue plotted against the malignancy continuum. Samples are colored based on if they are from different disease stage. |
Top |
Malignant transformation related pathway analysis |
| Find out the enriched GO biological processes and KEGG pathways involved in transition from healthy to precancer to cancer |
| Tissue | Disease Stage | Enriched GO biological Processes |
| Colorectum | AD |  |
| Colorectum | SER |  |
| Colorectum | MSS |  |
| Colorectum | MSI-H |  |
| Colorectum | FAP |  |
| ∗Top 15 enriched GO BP terms are showed in the bar plot of each disease state in each tissue. Each row represents a significant GO biological process which is colored according to the -log10(p.adjust). |
| Page: 1 2 3 4 5 6 7 8 9 |
| GO ID | Tissue | Disease Stage | Description | Gene Ratio | Bg Ratio | pvalue | p.adjust | Count |
| GO:0010821 | Colorectum | AD | regulation of mitochondrion organization | 57/3918 | 144/18723 | 2.43e-07 | 9.92e-06 | 57 |
| GO:0009636 | Colorectum | AD | response to toxic substance | 88/3918 | 262/18723 | 1.12e-06 | 3.72e-05 | 88 |
| GO:0006403 | Colorectum | AD | RNA localization | 71/3918 | 201/18723 | 1.54e-06 | 4.76e-05 | 71 |
| GO:0043087 | Colorectum | AD | regulation of GTPase activity | 110/3918 | 348/18723 | 1.64e-06 | 5.03e-05 | 110 |
| GO:0007265 | Colorectum | AD | Ras protein signal transduction | 104/3918 | 337/18723 | 1.01e-05 | 2.35e-04 | 104 |
| GO:0010822 | Colorectum | AD | positive regulation of mitochondrion organization | 32/3918 | 74/18723 | 1.22e-05 | 2.68e-04 | 32 |
| GO:0051056 | Colorectum | AD | regulation of small GTPase mediated signal transduction | 94/3918 | 302/18723 | 1.81e-05 | 3.76e-04 | 94 |
| GO:0051236 | Colorectum | AD | establishment of RNA localization | 58/3918 | 166/18723 | 1.95e-05 | 4.01e-04 | 58 |
| GO:0015931 | Colorectum | AD | nucleobase-containing compound transport | 73/3918 | 222/18723 | 2.02e-05 | 4.10e-04 | 73 |
| GO:0050657 | Colorectum | AD | nucleic acid transport | 57/3918 | 163/18723 | 2.22e-05 | 4.39e-04 | 57 |
| GO:0050658 | Colorectum | AD | RNA transport | 57/3918 | 163/18723 | 2.22e-05 | 4.39e-04 | 57 |
| GO:0006066 | Colorectum | AD | alcohol metabolic process | 106/3918 | 353/18723 | 3.02e-05 | 5.57e-04 | 106 |
| GO:0098754 | Colorectum | AD | detoxification | 53/3918 | 152/18723 | 4.63e-05 | 7.98e-04 | 53 |
| GO:0043547 | Colorectum | AD | positive regulation of GTPase activity | 75/3918 | 255/18723 | 7.95e-04 | 7.91e-03 | 75 |
| GO:0051028 | Colorectum | AD | mRNA transport | 42/3918 | 130/18723 | 1.57e-03 | 1.32e-02 | 42 |
| GO:0010876 | Colorectum | AD | lipid localization | 120/3918 | 448/18723 | 1.59e-03 | 1.33e-02 | 120 |
| GO:0006869 | Colorectum | AD | lipid transport | 108/3918 | 398/18723 | 1.67e-03 | 1.39e-02 | 108 |
| GO:0046578 | Colorectum | AD | regulation of Ras protein signal transduction | 56/3918 | 189/18723 | 2.85e-03 | 2.14e-02 | 56 |
| GO:0007266 | Colorectum | AD | Rho protein signal transduction | 42/3918 | 137/18723 | 4.64e-03 | 3.16e-02 | 42 |
| GO:0008202 | Colorectum | AD | steroid metabolic process | 85/3918 | 319/18723 | 8.07e-03 | 4.75e-02 | 85 |
| Page: 1 2 3 4 5 6 7 8 9 10 11 12 13 14 15 16 |
| Pathway ID | Tissue | Disease Stage | Description | Gene Ratio | Bg Ratio | pvalue | p.adjust | qvalue | Count |
| hsa0541714 | Liver | NAFLD | Lipid and atherosclerosis | 42/1043 | 215/8465 | 1.46e-03 | 1.71e-02 | 1.38e-02 | 42 |
| hsa0541715 | Liver | NAFLD | Lipid and atherosclerosis | 42/1043 | 215/8465 | 1.46e-03 | 1.71e-02 | 1.38e-02 | 42 |
| hsa04936 | Liver | Cirrhotic | Alcoholic liver disease | 60/2530 | 142/8465 | 1.07e-03 | 5.85e-03 | 3.61e-03 | 60 |
| hsa0541722 | Liver | Cirrhotic | Lipid and atherosclerosis | 80/2530 | 215/8465 | 1.18e-02 | 3.81e-02 | 2.35e-02 | 80 |
| hsa049361 | Liver | Cirrhotic | Alcoholic liver disease | 60/2530 | 142/8465 | 1.07e-03 | 5.85e-03 | 3.61e-03 | 60 |
| hsa0541732 | Liver | Cirrhotic | Lipid and atherosclerosis | 80/2530 | 215/8465 | 1.18e-02 | 3.81e-02 | 2.35e-02 | 80 |
| hsa049362 | Liver | HCC | Alcoholic liver disease | 89/4020 | 142/8465 | 1.73e-04 | 8.53e-04 | 4.75e-04 | 89 |
| hsa0541742 | Liver | HCC | Lipid and atherosclerosis | 118/4020 | 215/8465 | 1.66e-02 | 3.92e-02 | 2.18e-02 | 118 |
| hsa049363 | Liver | HCC | Alcoholic liver disease | 89/4020 | 142/8465 | 1.73e-04 | 8.53e-04 | 4.75e-04 | 89 |
| hsa0541752 | Liver | HCC | Lipid and atherosclerosis | 118/4020 | 215/8465 | 1.66e-02 | 3.92e-02 | 2.18e-02 | 118 |
| Page: 1 |
Top |
Cell-cell communication analysis |
| Identification of potential cell-cell interactions between two cell types and their ligand-receptor pairs for different disease states |
| Ligand | Receptor | LRpair | Pathway | Tissue | Disease Stage |
| Page: 1 |
Top |
Single-cell gene regulatory network inference analysis |
| Find out the significant the regulons (TFs) and the target genes of each regulon across cell types for different disease states |
| TF | Cell Type | Tissue | Disease Stage | Target Gene | RSS | Regulon Activity |
| ∗The dot plots of a searched regulon are shown for all cell subpopulations in each disease state of each tissue based on the regulon specific score inferred using pySCENIC and by calculating the average expression. |
| Page: 1 |
Top |
Somatic mutation of malignant transformation related genes |
| Annotation of somatic variants for genes involved in malignant transformation |
| Hugo Symbol | Variant Class | Variant Classification | dbSNP RS | HGVSc | HGVSp | HGVSp Short | SWISSPROT | BIOTYPE | SIFT | PolyPhen | Tumor Sample Barcode | Tissue | Histology | Sex | Age | Stage | Therapy Types | Drugs | Outcome |
| LBP | SNV | Missense_Mutation | c.799A>G | p.Met267Val | p.M267V | P18428 | protein_coding | tolerated(0.05) | benign(0.199) | TCGA-A8-A08J-01 | Breast | breast invasive carcinoma | Female | <65 | III/IV | Unknown | Unknown | PD | |
| LBP | SNV | Missense_Mutation | c.1237G>A | p.Glu413Lys | p.E413K | P18428 | protein_coding | deleterious(0.03) | possibly_damaging(0.577) | TCGA-AC-A23H-01 | Breast | breast invasive carcinoma | Female | >=65 | I/II | Unknown | Unknown | PD | |
| LBP | insertion | Frame_Shift_Ins | novel | c.312_313insGTTTCCTTCATTCCTGCCTTCTTTTATTCAGTCCATCAGCAAAA | p.Ile105ValfsTer89 | p.I105Vfs*89 | P18428 | protein_coding | TCGA-A7-A0CJ-01 | Breast | breast invasive carcinoma | Female | <65 | I/II | Chemotherapy | cytoxan | SD | ||
| LBP | SNV | Missense_Mutation | novel | c.1090N>C | p.Ile364Leu | p.I364L | P18428 | protein_coding | tolerated(0.05) | benign(0.05) | TCGA-2W-A8YY-01 | Cervix | cervical & endocervical cancer | Female | <65 | I/II | Chemotherapy | cisplatin | CR |
| LBP | SNV | Missense_Mutation | novel | c.388N>A | p.Asp130Asn | p.D130N | P18428 | protein_coding | tolerated(0.08) | possibly_damaging(0.679) | TCGA-VS-A8QC-01 | Cervix | cervical & endocervical cancer | Female | <65 | I/II | Chemotherapy | paclitaxel | PD |
| LBP | SNV | Missense_Mutation | rs374882159 | c.217N>T | p.Arg73Cys | p.R73C | P18428 | protein_coding | deleterious(0) | probably_damaging(0.93) | TCGA-5M-AAT6-01 | Colorectum | colon adenocarcinoma | Female | <65 | III/IV | Unknown | Unknown | PD |
| LBP | SNV | Missense_Mutation | c.913G>A | p.Asp305Asn | p.D305N | P18428 | protein_coding | tolerated(0.28) | benign(0.136) | TCGA-AA-3872-01 | Colorectum | colon adenocarcinoma | Male | <65 | III/IV | Unknown | Unknown | SD | |
| LBP | SNV | Missense_Mutation | rs545550026 | c.676N>A | p.Ala226Thr | p.A226T | P18428 | protein_coding | tolerated(0.13) | benign(0.086) | TCGA-AD-5900-01 | Colorectum | colon adenocarcinoma | Male | >=65 | I/II | Unknown | Unknown | SD |
| LBP | SNV | Missense_Mutation | c.1096N>A | p.Ala366Thr | p.A366T | P18428 | protein_coding | deleterious(0.04) | possibly_damaging(0.681) | TCGA-CA-5797-01 | Colorectum | colon adenocarcinoma | Male | <65 | I/II | Unknown | Unknown | SD | |
| LBP | SNV | Missense_Mutation | rs374549700 | c.1040C>T | p.Pro347Leu | p.P347L | P18428 | protein_coding | deleterious(0.02) | possibly_damaging(0.906) | TCGA-CK-5913-01 | Colorectum | colon adenocarcinoma | Female | <65 | I/II | Unknown | Unknown | SD |
| Page: 1 2 3 4 5 6 7 |
Top |
Related drugs of malignant transformation related genes |
| Identification of chemicals and drugs interact with genes involved in malignant transfromation |
| (DGIdb 4.0) |
| Entrez ID | Symbol | Category | Interaction Types | Drug Claim Name | Drug Name | PMIDs |
| Page: 1 |

Copyright 2023-Present -The University of Texas Health Science Center at Houston |