
|
|||||
|
 | |
| |
| |
| |
| |
| |
|
Gene: LATS2 |
Gene summary for LATS2 |
| Gene information | Species | Human | Gene symbol | LATS2 | Gene ID | 26524 |
| Gene name | large tumor suppressor kinase 2 | |
| Gene Alias | KPM | |
| Cytomap | 13q12.11 | |
| Gene Type | protein-coding | GO ID | GO:0000079 | UniProtAcc | A0A024RDM3 |
Top |
Malignant transformation analysis |
| Identification of the aberrant gene expression in precancerous and cancerous lesions by comparing the gene expression of stem-like cells in diseased tissues with normal stem cells |
| Entrez ID | Symbol | Replicates | Species | Organ | Tissue | Adj P-value | Log2FC | Malignancy |
| 26524 | LATS2 | PTCwithHT_6 | Human | Thyroid | HT | 5.67e-05 | -2.61e-01 | 0.02 |
| 26524 | LATS2 | PTCwithoutHT_2 | Human | Thyroid | PTC | 2.43e-03 | -2.72e-01 | 0.0419 |
| 26524 | LATS2 | male-WTA | Human | Thyroid | PTC | 6.72e-18 | -7.45e-02 | 0.1037 |
| 26524 | LATS2 | PTC01 | Human | Thyroid | PTC | 8.77e-06 | -1.40e-01 | 0.1899 |
| 26524 | LATS2 | PTC04 | Human | Thyroid | PTC | 1.76e-07 | -1.09e-01 | 0.1927 |
| 26524 | LATS2 | PTC05 | Human | Thyroid | PTC | 2.30e-09 | 8.17e-02 | 0.2065 |
| 26524 | LATS2 | PTC06 | Human | Thyroid | PTC | 1.17e-15 | 2.27e-01 | 0.2057 |
| 26524 | LATS2 | PTC07 | Human | Thyroid | PTC | 4.81e-21 | 1.46e-01 | 0.2044 |
| 26524 | LATS2 | ATC12 | Human | Thyroid | ATC | 2.13e-07 | -1.10e-01 | 0.34 |
| 26524 | LATS2 | ATC13 | Human | Thyroid | ATC | 8.34e-22 | 8.30e-02 | 0.34 |
| 26524 | LATS2 | ATC1 | Human | Thyroid | ATC | 1.07e-02 | -1.00e-01 | 0.2878 |
| 26524 | LATS2 | ATC4 | Human | Thyroid | ATC | 3.39e-04 | -5.50e-02 | 0.34 |
| 26524 | LATS2 | ATC5 | Human | Thyroid | ATC | 7.96e-16 | 1.14e-01 | 0.34 |
| Page: 1 |
| Tissue | Expression Dynamics | Abbreviation |
| Thyroid | 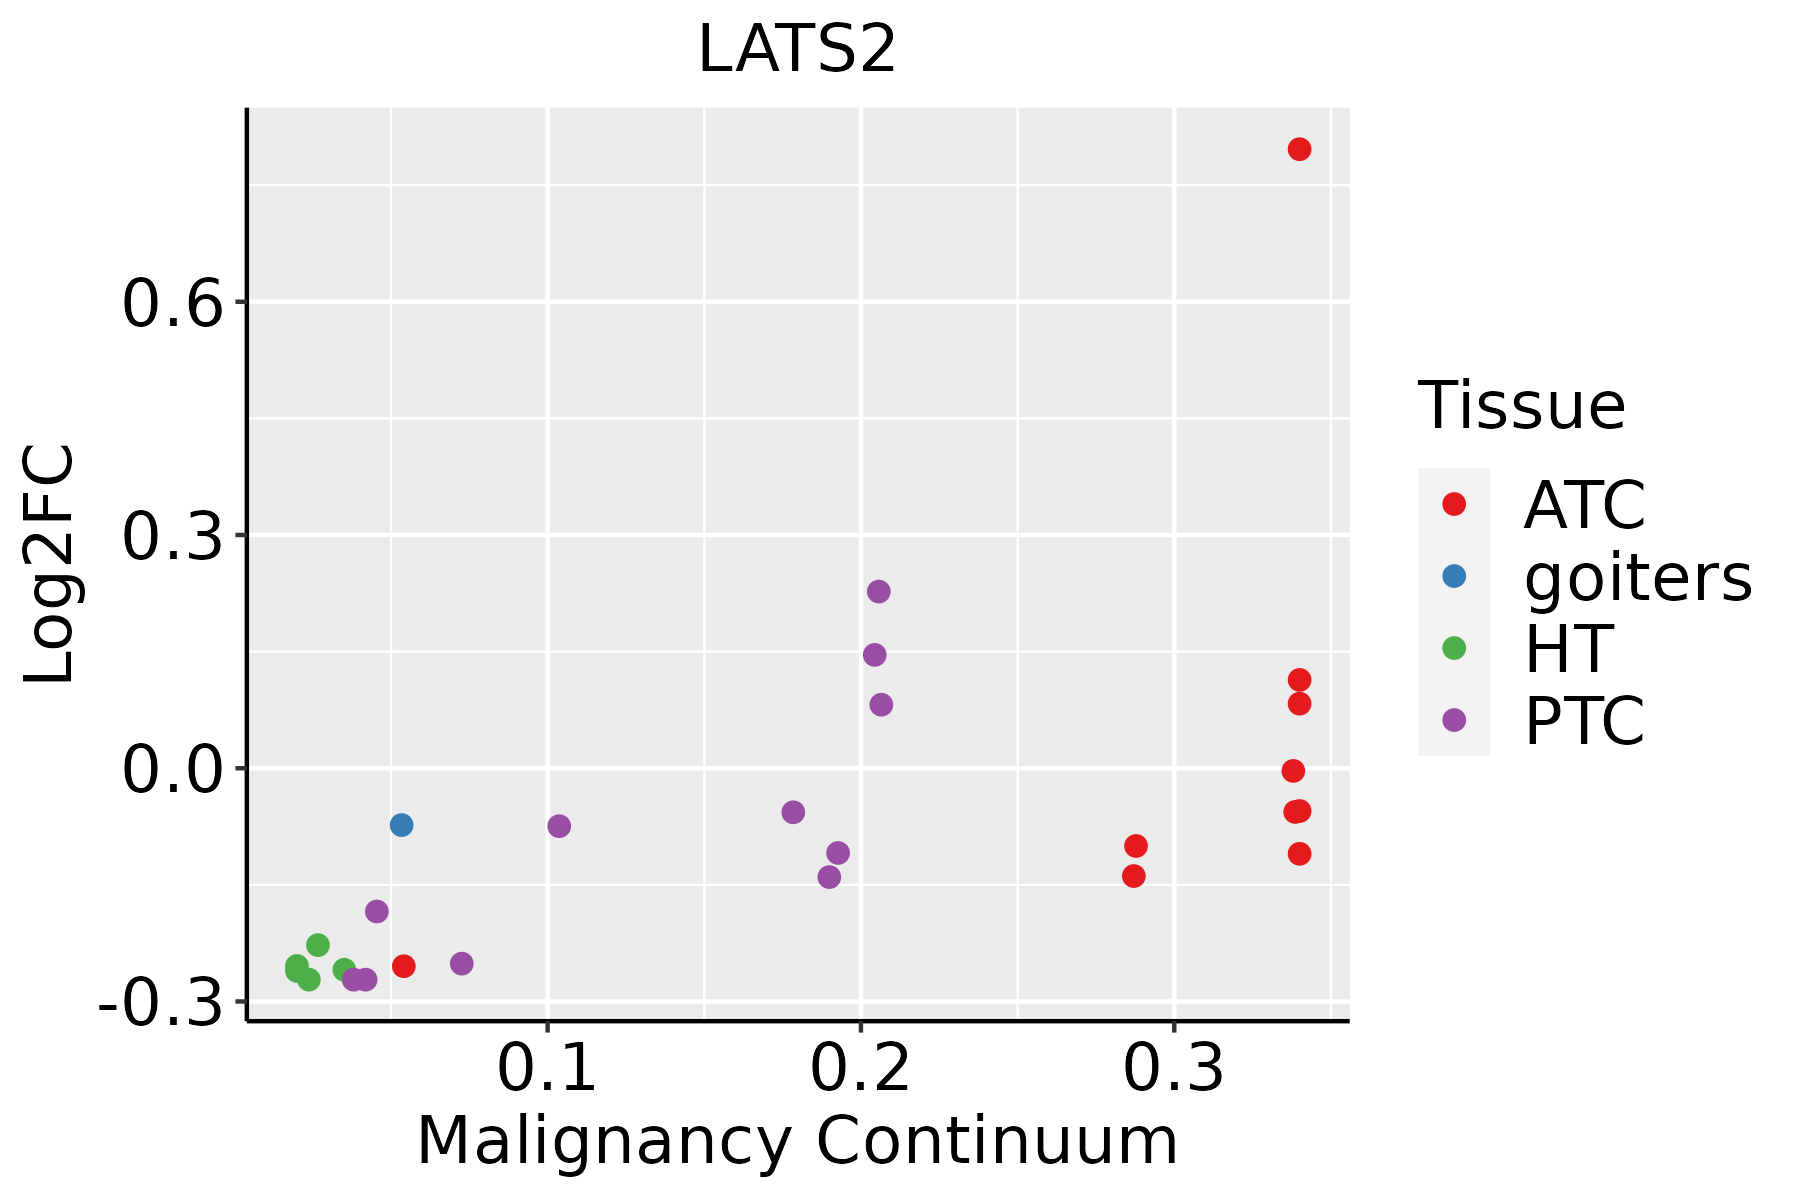 | ATC: Anaplastic thyroid cancer |
| HT: Hashimoto's thyroiditis | ||
| PTC: Papillary thyroid cancer |
| ∗log2FC in expression of this searched gene in stem-like cells from each diseased tissue sample relative to stem-like cells in normal samples in each tissue plotted against the malignancy continuum. Samples are colored based on if they are from different disease stage. |
Top |
Malignant transformation related pathway analysis |
| Find out the enriched GO biological processes and KEGG pathways involved in transition from healthy to precancer to cancer |
| Tissue | Disease Stage | Enriched GO biological Processes |
| Colorectum | AD |  |
| Colorectum | SER |  |
| Colorectum | MSS |  |
| Colorectum | MSI-H |  |
| Colorectum | FAP |  |
| ∗Top 15 enriched GO BP terms are showed in the bar plot of each disease state in each tissue. Each row represents a significant GO biological process which is colored according to the -log10(p.adjust). |
| Page: 1 2 3 4 5 6 7 8 9 |
| GO ID | Tissue | Disease Stage | Description | Gene Ratio | Bg Ratio | pvalue | p.adjust | Count |
| GO:005134830 | Thyroid | HT | negative regulation of transferase activity | 45/1272 | 268/18723 | 1.49e-08 | 1.20e-06 | 45 |
| GO:003450420 | Thyroid | HT | protein localization to nucleus | 42/1272 | 290/18723 | 2.68e-06 | 9.37e-05 | 42 |
| GO:000646924 | Thyroid | HT | negative regulation of protein kinase activity | 33/1272 | 212/18723 | 6.62e-06 | 1.95e-04 | 33 |
| GO:003367324 | Thyroid | HT | negative regulation of kinase activity | 35/1272 | 237/18723 | 1.16e-05 | 3.05e-04 | 35 |
| GO:000193327 | Thyroid | HT | negative regulation of protein phosphorylation | 45/1272 | 342/18723 | 1.54e-05 | 3.80e-04 | 45 |
| GO:004232627 | Thyroid | HT | negative regulation of phosphorylation | 49/1272 | 385/18723 | 1.62e-05 | 3.95e-04 | 49 |
| GO:004593629 | Thyroid | HT | negative regulation of phosphate metabolic process | 54/1272 | 441/18723 | 1.86e-05 | 4.39e-04 | 54 |
| GO:001056329 | Thyroid | HT | negative regulation of phosphorus metabolic process | 54/1272 | 442/18723 | 1.99e-05 | 4.60e-04 | 54 |
| GO:007155918 | Thyroid | HT | response to transforming growth factor beta | 35/1272 | 256/18723 | 6.03e-05 | 1.13e-03 | 35 |
| GO:007156018 | Thyroid | HT | cellular response to transforming growth factor beta stimulus | 34/1272 | 250/18723 | 8.48e-05 | 1.46e-03 | 34 |
| GO:00719015 | Thyroid | HT | negative regulation of protein serine/threonine kinase activity | 20/1272 | 120/18723 | 1.62e-04 | 2.43e-03 | 20 |
| GO:007190019 | Thyroid | HT | regulation of protein serine/threonine kinase activity | 43/1272 | 359/18723 | 2.09e-04 | 3.01e-03 | 43 |
| GO:000717818 | Thyroid | HT | transmembrane receptor protein serine/threonine kinase signaling pathway | 42/1272 | 355/18723 | 3.21e-04 | 4.20e-03 | 42 |
| GO:000717918 | Thyroid | HT | transforming growth factor beta receptor signaling pathway | 26/1272 | 198/18723 | 9.39e-04 | 9.80e-03 | 26 |
| GO:001605520 | Thyroid | HT | Wnt signaling pathway | 48/1272 | 444/18723 | 9.68e-04 | 9.93e-03 | 48 |
| GO:019873820 | Thyroid | HT | cell-cell signaling by wnt | 48/1272 | 446/18723 | 1.07e-03 | 1.07e-02 | 48 |
| GO:190018020 | Thyroid | HT | regulation of protein localization to nucleus | 19/1272 | 136/18723 | 2.13e-03 | 1.86e-02 | 19 |
| GO:19040296 | Thyroid | HT | regulation of cyclin-dependent protein kinase activity | 15/1272 | 98/18723 | 2.47e-03 | 2.08e-02 | 15 |
| GO:006007019 | Thyroid | HT | canonical Wnt signaling pathway | 34/1272 | 303/18723 | 2.76e-03 | 2.27e-02 | 34 |
| GO:19038449 | Thyroid | HT | regulation of cellular response to transforming growth factor beta stimulus | 18/1272 | 131/18723 | 3.30e-03 | 2.59e-02 | 18 |
| Page: 1 2 3 4 5 6 |
| Pathway ID | Tissue | Disease Stage | Description | Gene Ratio | Bg Ratio | pvalue | p.adjust | qvalue | Count |
| Page: 1 |
Top |
Cell-cell communication analysis |
| Identification of potential cell-cell interactions between two cell types and their ligand-receptor pairs for different disease states |
| Ligand | Receptor | LRpair | Pathway | Tissue | Disease Stage |
| Page: 1 |
Top |
Single-cell gene regulatory network inference analysis |
| Find out the significant the regulons (TFs) and the target genes of each regulon across cell types for different disease states |
| TF | Cell Type | Tissue | Disease Stage | Target Gene | RSS | Regulon Activity |
| ∗The dot plots of a searched regulon are shown for all cell subpopulations in each disease state of each tissue based on the regulon specific score inferred using pySCENIC and by calculating the average expression. |
| Page: 1 |
Top |
Somatic mutation of malignant transformation related genes |
| Annotation of somatic variants for genes involved in malignant transformation |
| Hugo Symbol | Variant Class | Variant Classification | dbSNP RS | HGVSc | HGVSp | HGVSp Short | SWISSPROT | BIOTYPE | SIFT | PolyPhen | Tumor Sample Barcode | Tissue | Histology | Sex | Age | Stage | Therapy Types | Drugs | Outcome |
| LATS2 | SNV | Missense_Mutation | novel | c.2785N>C | p.Glu929Gln | p.E929Q | Q9NRM7 | protein_coding | tolerated(0.43) | benign(0.374) | TCGA-5L-AAT1-01 | Breast | breast invasive carcinoma | Female | <65 | III/IV | Hormone Therapy | letrozol | SD |
| LATS2 | SNV | Missense_Mutation | novel | c.1938N>T | p.Lys646Asn | p.K646N | Q9NRM7 | protein_coding | deleterious(0.03) | possibly_damaging(0.885) | TCGA-A8-A06P-01 | Breast | breast invasive carcinoma | Female | <65 | III/IV | Unspecific | SD | |
| LATS2 | SNV | Missense_Mutation | novel | c.2398N>T | p.Asp800Tyr | p.D800Y | Q9NRM7 | protein_coding | deleterious(0) | probably_damaging(0.999) | TCGA-AN-A046-01 | Breast | breast invasive carcinoma | Female | >=65 | I/II | Unknown | Unknown | SD |
| LATS2 | SNV | Missense_Mutation | c.536N>T | p.Ser179Leu | p.S179L | Q9NRM7 | protein_coding | deleterious(0.01) | benign(0.011) | TCGA-AN-A046-01 | Breast | breast invasive carcinoma | Female | >=65 | I/II | Unknown | Unknown | SD | |
| LATS2 | SNV | Missense_Mutation | novel | c.737T>C | p.Phe246Ser | p.F246S | Q9NRM7 | protein_coding | tolerated_low_confidence(0.46) | benign(0) | TCGA-C8-A8HQ-01 | Breast | breast invasive carcinoma | Female | <65 | I/II | Unknown | Unknown | SD |
| LATS2 | insertion | Frame_Shift_Ins | novel | c.1936_1937insGTGCA | p.Lys646SerfsTer15 | p.K646Sfs*15 | Q9NRM7 | protein_coding | TCGA-A8-A06P-01 | Breast | breast invasive carcinoma | Female | <65 | III/IV | Unspecific | SD | |||
| LATS2 | SNV | Missense_Mutation | novel | c.2875C>A | p.Leu959Met | p.L959M | Q9NRM7 | protein_coding | deleterious(0.01) | probably_damaging(0.954) | TCGA-2W-A8YY-01 | Cervix | cervical & endocervical cancer | Female | <65 | I/II | Chemotherapy | cisplatin | CR |
| LATS2 | SNV | Missense_Mutation | novel | c.2755A>G | p.Thr919Ala | p.T919A | Q9NRM7 | protein_coding | tolerated(0.65) | benign(0.089) | TCGA-2W-A8YY-01 | Cervix | cervical & endocervical cancer | Female | <65 | I/II | Chemotherapy | cisplatin | CR |
| LATS2 | SNV | Missense_Mutation | novel | c.1801G>A | p.Ala601Thr | p.A601T | Q9NRM7 | protein_coding | deleterious(0) | probably_damaging(0.932) | TCGA-2W-A8YY-01 | Cervix | cervical & endocervical cancer | Female | <65 | I/II | Chemotherapy | cisplatin | CR |
| LATS2 | SNV | Missense_Mutation | rs765917652 | c.1583C>T | p.Ser528Leu | p.S528L | Q9NRM7 | protein_coding | tolerated(0.12) | benign(0.01) | TCGA-2W-A8YY-01 | Cervix | cervical & endocervical cancer | Female | <65 | I/II | Chemotherapy | cisplatin | CR |
| Page: 1 2 3 4 5 6 7 8 9 10 11 12 |
Top |
Related drugs of malignant transformation related genes |
| Identification of chemicals and drugs interact with genes involved in malignant transfromation |
| (DGIdb 4.0) |
| Entrez ID | Symbol | Category | Interaction Types | Drug Claim Name | Drug Name | PMIDs |
| 26524 | LATS2 | KINASE, ENZYME, DRUGGABLE GENOME, SERINE THREONINE KINASE, CLINICALLY ACTIONABLE | inhibitor | 249565889 |
| Page: 1 |

Copyright 2023-Present -The University of Texas Health Science Center at Houston |