
|
|||||
|
 | |
| |
| |
| |
| |
| |
|
Gene: LATS1 |
Gene summary for LATS1 |
| Gene information | Species | Human | Gene symbol | LATS1 | Gene ID | 9113 |
| Gene name | large tumor suppressor kinase 1 | |
| Gene Alias | WARTS | |
| Cytomap | 6q25.1 | |
| Gene Type | protein-coding | GO ID | GO:0000079 | UniProtAcc | O95835 |
Top |
Malignant transformation analysis |
| Identification of the aberrant gene expression in precancerous and cancerous lesions by comparing the gene expression of stem-like cells in diseased tissues with normal stem cells |
| Entrez ID | Symbol | Replicates | Species | Organ | Tissue | Adj P-value | Log2FC | Malignancy |
| 9113 | LATS1 | LZE4T | Human | Esophagus | ESCC | 2.28e-14 | 4.14e-01 | 0.0811 |
| 9113 | LATS1 | LZE7T | Human | Esophagus | ESCC | 4.06e-11 | 5.08e-01 | 0.0667 |
| 9113 | LATS1 | LZE8T | Human | Esophagus | ESCC | 3.83e-03 | 2.12e-01 | 0.067 |
| 9113 | LATS1 | LZE24T | Human | Esophagus | ESCC | 6.42e-14 | 3.31e-01 | 0.0596 |
| 9113 | LATS1 | LZE6T | Human | Esophagus | ESCC | 3.34e-04 | 1.51e-01 | 0.0845 |
| 9113 | LATS1 | P1T-E | Human | Esophagus | ESCC | 4.35e-12 | 3.14e-01 | 0.0875 |
| 9113 | LATS1 | P2T-E | Human | Esophagus | ESCC | 2.91e-20 | 3.61e-01 | 0.1177 |
| 9113 | LATS1 | P4T-E | Human | Esophagus | ESCC | 3.05e-17 | 2.85e-01 | 0.1323 |
| 9113 | LATS1 | P5T-E | Human | Esophagus | ESCC | 5.50e-10 | 1.44e-01 | 0.1327 |
| 9113 | LATS1 | P8T-E | Human | Esophagus | ESCC | 1.02e-19 | 1.99e-01 | 0.0889 |
| 9113 | LATS1 | P9T-E | Human | Esophagus | ESCC | 3.49e-12 | 1.37e-01 | 0.1131 |
| 9113 | LATS1 | P10T-E | Human | Esophagus | ESCC | 3.42e-18 | 2.43e-01 | 0.116 |
| 9113 | LATS1 | P11T-E | Human | Esophagus | ESCC | 1.56e-13 | 3.81e-01 | 0.1426 |
| 9113 | LATS1 | P12T-E | Human | Esophagus | ESCC | 4.29e-11 | 2.70e-01 | 0.1122 |
| 9113 | LATS1 | P15T-E | Human | Esophagus | ESCC | 1.46e-12 | 3.73e-01 | 0.1149 |
| 9113 | LATS1 | P16T-E | Human | Esophagus | ESCC | 1.98e-30 | 5.35e-01 | 0.1153 |
| 9113 | LATS1 | P17T-E | Human | Esophagus | ESCC | 5.19e-07 | 1.69e-01 | 0.1278 |
| 9113 | LATS1 | P20T-E | Human | Esophagus | ESCC | 1.43e-12 | 2.68e-01 | 0.1124 |
| 9113 | LATS1 | P21T-E | Human | Esophagus | ESCC | 1.08e-20 | 3.16e-01 | 0.1617 |
| 9113 | LATS1 | P22T-E | Human | Esophagus | ESCC | 1.55e-14 | 1.53e-01 | 0.1236 |
| Page: 1 2 3 4 |
| Tissue | Expression Dynamics | Abbreviation |
| Esophagus |  | ESCC: Esophageal squamous cell carcinoma |
| HGIN: High-grade intraepithelial neoplasias | ||
| LGIN: Low-grade intraepithelial neoplasias | ||
| Liver |  | HCC: Hepatocellular carcinoma |
| NAFLD: Non-alcoholic fatty liver disease | ||
| Thyroid | 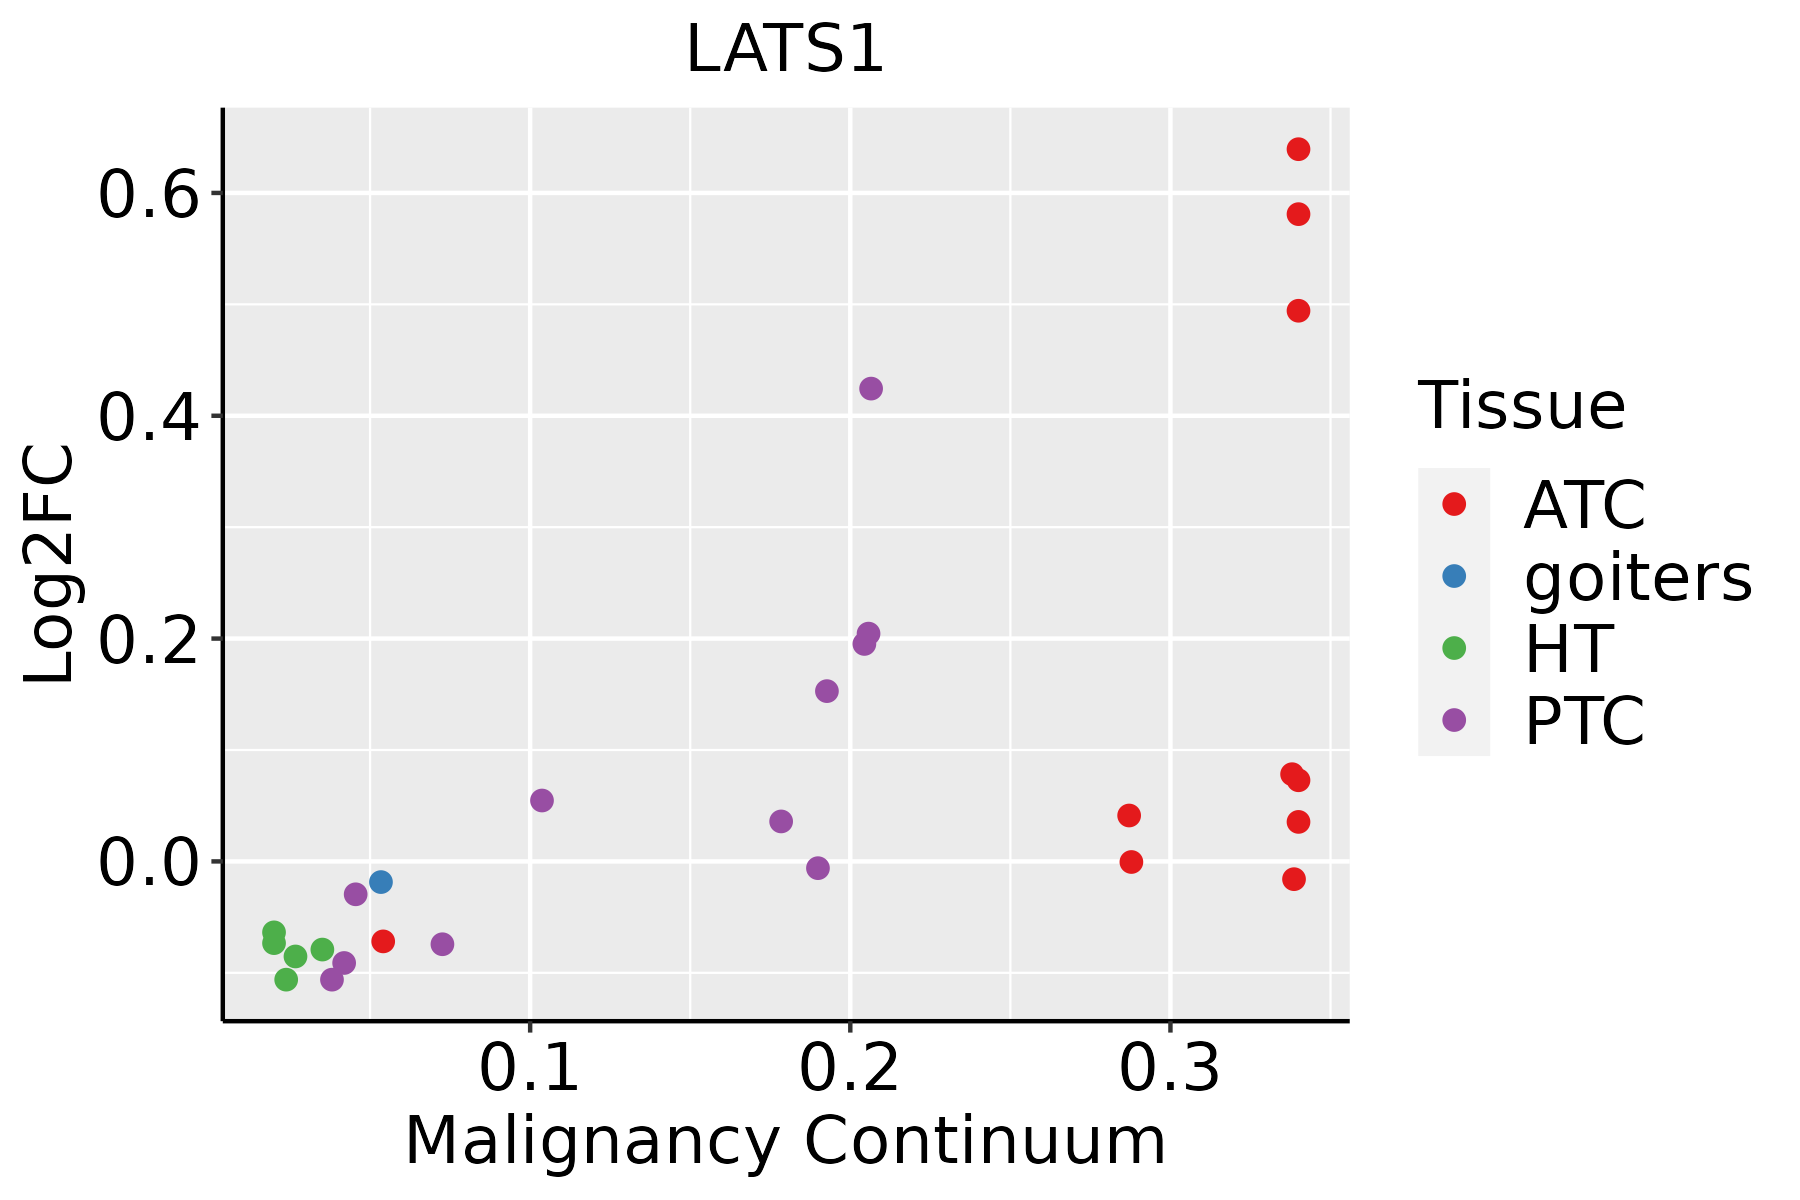 | ATC: Anaplastic thyroid cancer |
| HT: Hashimoto's thyroiditis | ||
| PTC: Papillary thyroid cancer |
| ∗log2FC in expression of this searched gene in stem-like cells from each diseased tissue sample relative to stem-like cells in normal samples in each tissue plotted against the malignancy continuum. Samples are colored based on if they are from different disease stage. |
Top |
Malignant transformation related pathway analysis |
| Find out the enriched GO biological processes and KEGG pathways involved in transition from healthy to precancer to cancer |
| Tissue | Disease Stage | Enriched GO biological Processes |
| Colorectum | AD |  |
| Colorectum | SER |  |
| Colorectum | MSS |  |
| Colorectum | MSI-H |  |
| Colorectum | FAP |  |
| ∗Top 15 enriched GO BP terms are showed in the bar plot of each disease state in each tissue. Each row represents a significant GO biological process which is colored according to the -log10(p.adjust). |
| Page: 1 2 3 4 5 6 7 8 9 |
| GO ID | Tissue | Disease Stage | Description | Gene Ratio | Bg Ratio | pvalue | p.adjust | Count |
| GO:0042176111 | Esophagus | ESCC | regulation of protein catabolic process | 280/8552 | 391/18723 | 8.65e-26 | 2.39e-23 | 280 |
| GO:003450418 | Esophagus | ESCC | protein localization to nucleus | 211/8552 | 290/18723 | 4.06e-21 | 6.60e-19 | 211 |
| GO:00008194 | Esophagus | ESCC | sister chromatid segregation | 157/8552 | 202/18723 | 8.41e-21 | 1.33e-18 | 157 |
| GO:1903362111 | Esophagus | ESCC | regulation of cellular protein catabolic process | 188/8552 | 255/18723 | 5.12e-20 | 6.62e-18 | 188 |
| GO:000705911 | Esophagus | ESCC | chromosome segregation | 238/8552 | 346/18723 | 1.72e-18 | 1.82e-16 | 238 |
| GO:004477216 | Esophagus | ESCC | mitotic cell cycle phase transition | 281/8552 | 424/18723 | 4.63e-18 | 4.45e-16 | 281 |
| GO:1903050111 | Esophagus | ESCC | regulation of proteolysis involved in cellular protein catabolic process | 163/8552 | 221/18723 | 1.44e-17 | 1.27e-15 | 163 |
| GO:0043254111 | Esophagus | ESCC | regulation of protein-containing complex assembly | 278/8552 | 428/18723 | 3.81e-16 | 2.77e-14 | 278 |
| GO:000170119 | Esophagus | ESCC | in utero embryonic development | 243/8552 | 367/18723 | 1.00e-15 | 6.86e-14 | 243 |
| GO:2000058111 | Esophagus | ESCC | regulation of ubiquitin-dependent protein catabolic process | 125/8552 | 164/18723 | 1.17e-15 | 7.76e-14 | 125 |
| GO:00988133 | Esophagus | ESCC | nuclear chromosome segregation | 187/8552 | 281/18723 | 1.00e-12 | 4.36e-11 | 187 |
| GO:0010563111 | Esophagus | ESCC | negative regulation of phosphorus metabolic process | 274/8552 | 442/18723 | 2.32e-12 | 9.41e-11 | 274 |
| GO:190018018 | Esophagus | ESCC | regulation of protein localization to nucleus | 102/8552 | 136/18723 | 2.84e-12 | 1.13e-10 | 102 |
| GO:0045936111 | Esophagus | ESCC | negative regulation of phosphate metabolic process | 273/8552 | 441/18723 | 3.18e-12 | 1.25e-10 | 273 |
| GO:0048732111 | Esophagus | ESCC | gland development | 269/8552 | 436/18723 | 7.81e-12 | 2.95e-10 | 269 |
| GO:0051348111 | Esophagus | ESCC | negative regulation of transferase activity | 177/8552 | 268/18723 | 1.08e-11 | 4.00e-10 | 177 |
| GO:007190016 | Esophagus | ESCC | regulation of protein serine/threonine kinase activity | 227/8552 | 359/18723 | 1.12e-11 | 4.10e-10 | 227 |
| GO:1902903111 | Esophagus | ESCC | regulation of supramolecular fiber organization | 237/8552 | 383/18723 | 9.06e-11 | 2.75e-09 | 237 |
| GO:0042326111 | Esophagus | ESCC | negative regulation of phosphorylation | 237/8552 | 385/18723 | 1.86e-10 | 5.33e-09 | 237 |
| GO:001605517 | Esophagus | ESCC | Wnt signaling pathway | 268/8552 | 444/18723 | 2.32e-10 | 6.58e-09 | 268 |
| Page: 1 2 3 4 5 6 7 8 9 10 11 12 13 14 15 16 17 18 19 |
| Pathway ID | Tissue | Disease Stage | Description | Gene Ratio | Bg Ratio | pvalue | p.adjust | qvalue | Count |
| hsa0439018 | Esophagus | ESCC | Hippo signaling pathway | 92/4205 | 157/8465 | 1.46e-02 | 3.31e-02 | 1.69e-02 | 92 |
| hsa0439019 | Esophagus | ESCC | Hippo signaling pathway | 92/4205 | 157/8465 | 1.46e-02 | 3.31e-02 | 1.69e-02 | 92 |
| Page: 1 |
Top |
Cell-cell communication analysis |
| Identification of potential cell-cell interactions between two cell types and their ligand-receptor pairs for different disease states |
| Ligand | Receptor | LRpair | Pathway | Tissue | Disease Stage |
| Page: 1 |
Top |
Single-cell gene regulatory network inference analysis |
| Find out the significant the regulons (TFs) and the target genes of each regulon across cell types for different disease states |
| TF | Cell Type | Tissue | Disease Stage | Target Gene | RSS | Regulon Activity |
| ∗The dot plots of a searched regulon are shown for all cell subpopulations in each disease state of each tissue based on the regulon specific score inferred using pySCENIC and by calculating the average expression. |
| Page: 1 |
Top |
Somatic mutation of malignant transformation related genes |
| Annotation of somatic variants for genes involved in malignant transformation |
| Hugo Symbol | Variant Class | Variant Classification | dbSNP RS | HGVSc | HGVSp | HGVSp Short | SWISSPROT | BIOTYPE | SIFT | PolyPhen | Tumor Sample Barcode | Tissue | Histology | Sex | Age | Stage | Therapy Types | Drugs | Outcome |
| LATS1 | SNV | Missense_Mutation | c.2259G>C | p.Glu753Asp | p.E753D | O95835 | protein_coding | deleterious(0) | probably_damaging(1) | TCGA-A2-A0YK-01 | Breast | breast invasive carcinoma | Female | <65 | I/II | Chemotherapy | cytoxan | SD | |
| LATS1 | SNV | Missense_Mutation | c.3082C>G | p.Pro1028Ala | p.P1028A | O95835 | protein_coding | deleterious(0) | probably_damaging(0.999) | TCGA-A8-A07R-01 | Breast | breast invasive carcinoma | Female | >=65 | III/IV | Ancillary | zoledronic | SD | |
| LATS1 | SNV | Missense_Mutation | c.2512C>G | p.Arg838Gly | p.R838G | O95835 | protein_coding | tolerated(0.28) | benign(0.408) | TCGA-AC-A23H-01 | Breast | breast invasive carcinoma | Female | >=65 | I/II | Unknown | Unknown | PD | |
| LATS1 | SNV | Missense_Mutation | novel | c.2995A>G | p.Asn999Asp | p.N999D | O95835 | protein_coding | tolerated(0.14) | benign(0.05) | TCGA-AN-A046-01 | Breast | breast invasive carcinoma | Female | >=65 | I/II | Unknown | Unknown | SD |
| LATS1 | SNV | Missense_Mutation | novel | c.2869G>C | p.Glu957Gln | p.E957Q | O95835 | protein_coding | deleterious(0.04) | benign(0.411) | TCGA-BH-A0H5-01 | Breast | breast invasive carcinoma | Female | <65 | I/II | Chemotherapy | cytoxan | CR |
| LATS1 | SNV | Missense_Mutation | c.108A>T | p.Glu36Asp | p.E36D | O95835 | protein_coding | deleterious_low_confidence(0.01) | benign(0.055) | TCGA-C8-A26V-01 | Breast | breast invasive carcinoma | Female | <65 | III/IV | Hormone Therapy | tamoxiphen | CR | |
| LATS1 | SNV | Missense_Mutation | rs139248642 | c.3373C>T | p.Arg1125Cys | p.R1125C | O95835 | protein_coding | tolerated_low_confidence(0.17) | benign(0) | TCGA-OK-A5Q2-01 | Breast | breast invasive carcinoma | Female | <65 | I/II | Unknown | Unknown | SD |
| LATS1 | insertion | In_Frame_Ins | novel | c.944_945insTAAATT | p.Gln315delinsHisLysLeu | p.Q315delinsHKL | O95835 | protein_coding | TCGA-A8-A06P-01 | Breast | breast invasive carcinoma | Female | <65 | III/IV | Unspecific | SD | |||
| LATS1 | insertion | In_Frame_Ins | novel | c.942_943insTATTTAACATTG | p.Asn314_Gln315insTyrLeuThrLeu | p.N314_Q315insYLTL | O95835 | protein_coding | TCGA-A8-A06P-01 | Breast | breast invasive carcinoma | Female | <65 | III/IV | Unspecific | SD | |||
| LATS1 | SNV | Missense_Mutation | c.1604G>A | p.Gly535Glu | p.G535E | O95835 | protein_coding | tolerated(0.32) | benign(0) | TCGA-DR-A0ZM-01 | Cervix | cervical & endocervical cancer | Female | <65 | III/IV | Unspecific | Cisplatin | SD |
| Page: 1 2 3 4 5 6 7 8 9 10 11 12 13 14 |
Top |
Related drugs of malignant transformation related genes |
| Identification of chemicals and drugs interact with genes involved in malignant transfromation |
| (DGIdb 4.0) |
| Entrez ID | Symbol | Category | Interaction Types | Drug Claim Name | Drug Name | PMIDs |
| Page: 1 |

Copyright 2023-Present -The University of Texas Health Science Center at Houston |