
|
|||||
|
 | |
| |
| |
| |
| |
| |
|
Gene: LARP6 |
Gene summary for LARP6 |
| Gene information | Species | Human | Gene symbol | LARP6 | Gene ID | 55323 |
| Gene name | La ribonucleoprotein 6, translational regulator | |
| Gene Alias | ACHN | |
| Cytomap | 15q23 | |
| Gene Type | protein-coding | GO ID | GO:0006139 | UniProtAcc | Q9BRS8 |
Top |
Malignant transformation analysis |
| Identification of the aberrant gene expression in precancerous and cancerous lesions by comparing the gene expression of stem-like cells in diseased tissues with normal stem cells |
| Entrez ID | Symbol | Replicates | Species | Organ | Tissue | Adj P-value | Log2FC | Malignancy |
| 55323 | LARP6 | LZE4T | Human | Esophagus | ESCC | 1.52e-11 | 3.77e-01 | 0.0811 |
| 55323 | LARP6 | LZE5T | Human | Esophagus | ESCC | 1.12e-03 | 3.42e-01 | 0.0514 |
| 55323 | LARP6 | LZE22T | Human | Esophagus | ESCC | 2.27e-07 | 6.48e-01 | 0.068 |
| 55323 | LARP6 | LZE24T | Human | Esophagus | ESCC | 8.29e-24 | 5.56e-01 | 0.0596 |
| 55323 | LARP6 | P1T-E | Human | Esophagus | ESCC | 3.32e-06 | 4.48e-01 | 0.0875 |
| 55323 | LARP6 | P2T-E | Human | Esophagus | ESCC | 7.25e-43 | 7.32e-01 | 0.1177 |
| 55323 | LARP6 | P4T-E | Human | Esophagus | ESCC | 2.04e-36 | 7.94e-01 | 0.1323 |
| 55323 | LARP6 | P8T-E | Human | Esophagus | ESCC | 8.80e-49 | 8.74e-01 | 0.0889 |
| 55323 | LARP6 | P9T-E | Human | Esophagus | ESCC | 7.33e-39 | 9.83e-01 | 0.1131 |
| 55323 | LARP6 | P10T-E | Human | Esophagus | ESCC | 4.91e-52 | 8.08e-01 | 0.116 |
| 55323 | LARP6 | P11T-E | Human | Esophagus | ESCC | 1.62e-15 | 6.27e-01 | 0.1426 |
| 55323 | LARP6 | P12T-E | Human | Esophagus | ESCC | 2.44e-75 | 1.37e+00 | 0.1122 |
| 55323 | LARP6 | P15T-E | Human | Esophagus | ESCC | 7.11e-28 | 6.27e-01 | 0.1149 |
| 55323 | LARP6 | P16T-E | Human | Esophagus | ESCC | 1.60e-51 | 9.10e-01 | 0.1153 |
| 55323 | LARP6 | P17T-E | Human | Esophagus | ESCC | 4.26e-05 | 3.11e-01 | 0.1278 |
| 55323 | LARP6 | P19T-E | Human | Esophagus | ESCC | 3.19e-10 | 1.07e+00 | 0.1662 |
| 55323 | LARP6 | P20T-E | Human | Esophagus | ESCC | 4.10e-12 | 4.31e-01 | 0.1124 |
| 55323 | LARP6 | P21T-E | Human | Esophagus | ESCC | 1.21e-17 | 3.07e-01 | 0.1617 |
| 55323 | LARP6 | P22T-E | Human | Esophagus | ESCC | 2.75e-63 | 1.08e+00 | 0.1236 |
| 55323 | LARP6 | P23T-E | Human | Esophagus | ESCC | 2.94e-35 | 1.04e+00 | 0.108 |
| Page: 1 2 3 4 5 6 |
| Tissue | Expression Dynamics | Abbreviation |
| Esophagus | 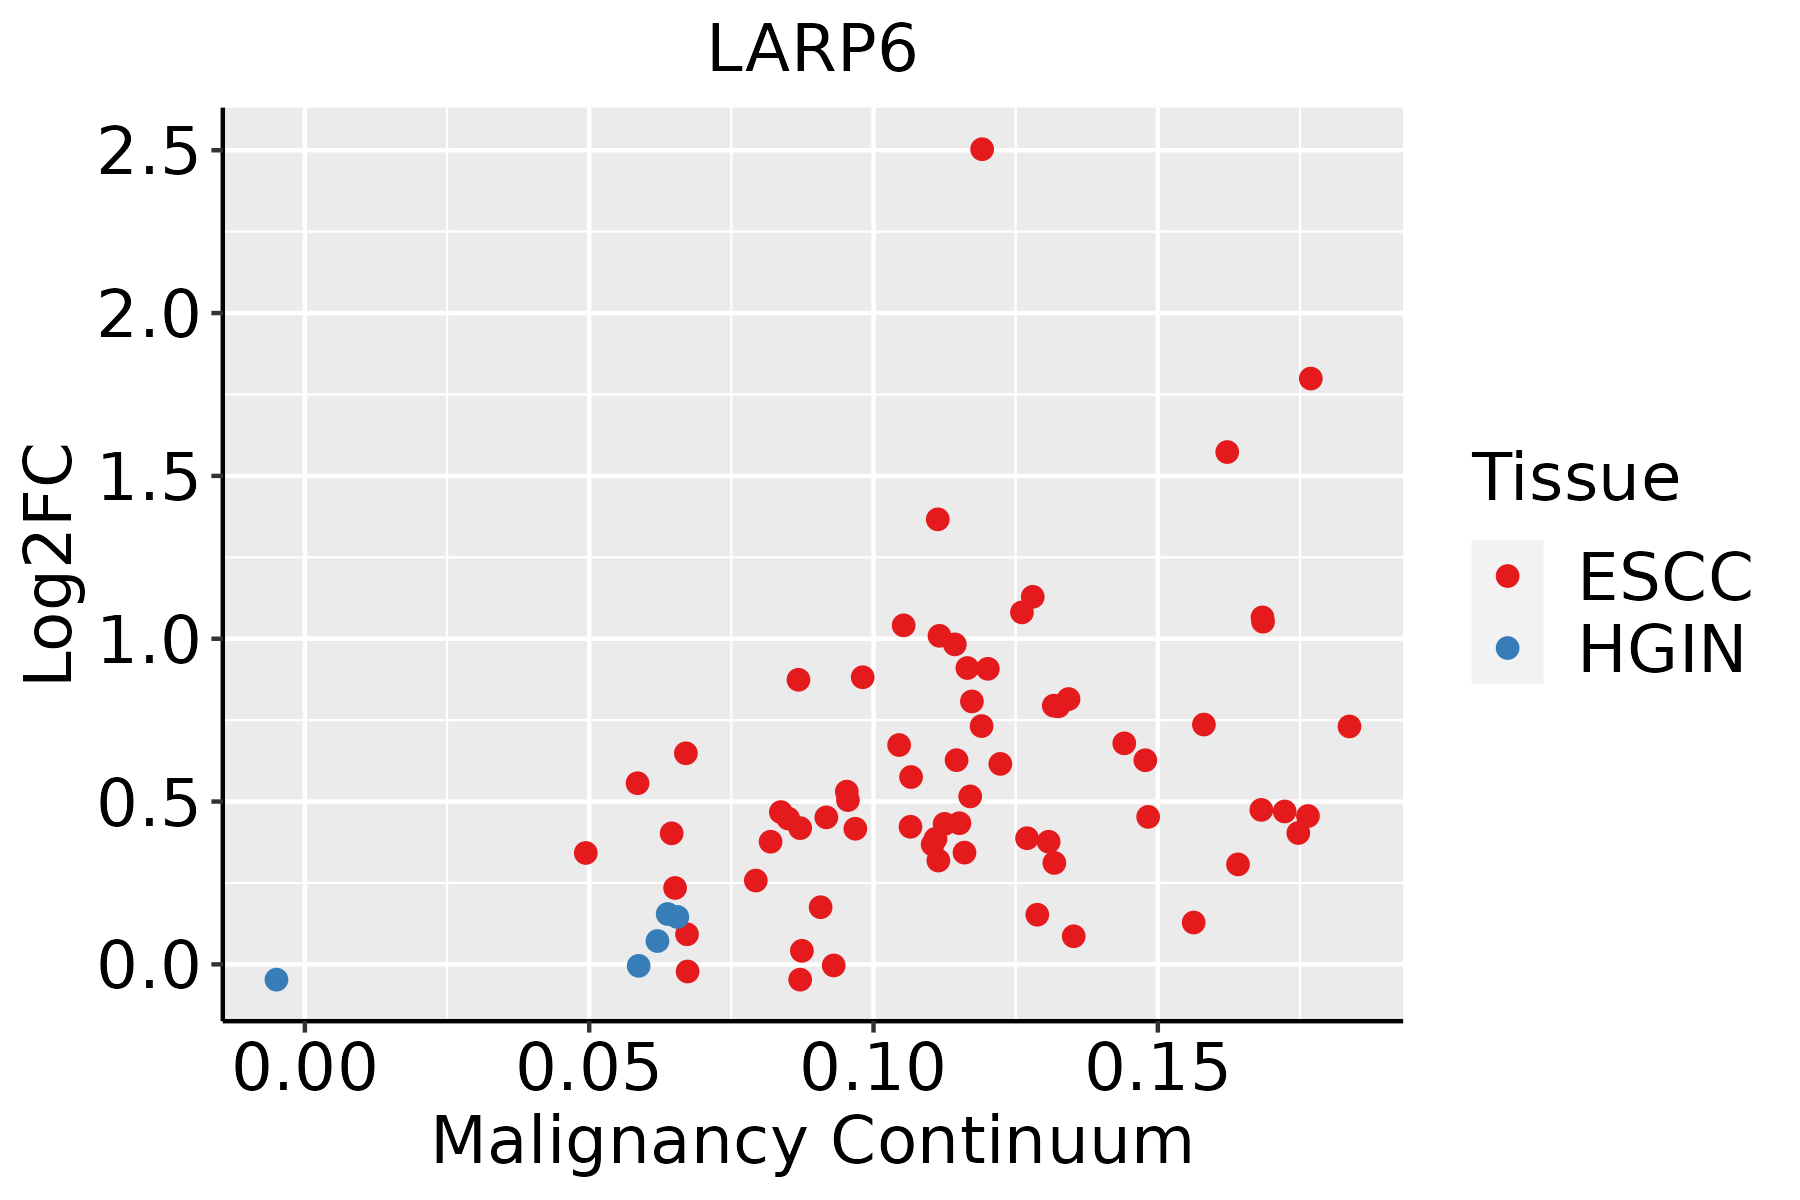 | ESCC: Esophageal squamous cell carcinoma |
| HGIN: High-grade intraepithelial neoplasias | ||
| LGIN: Low-grade intraepithelial neoplasias | ||
| Liver | 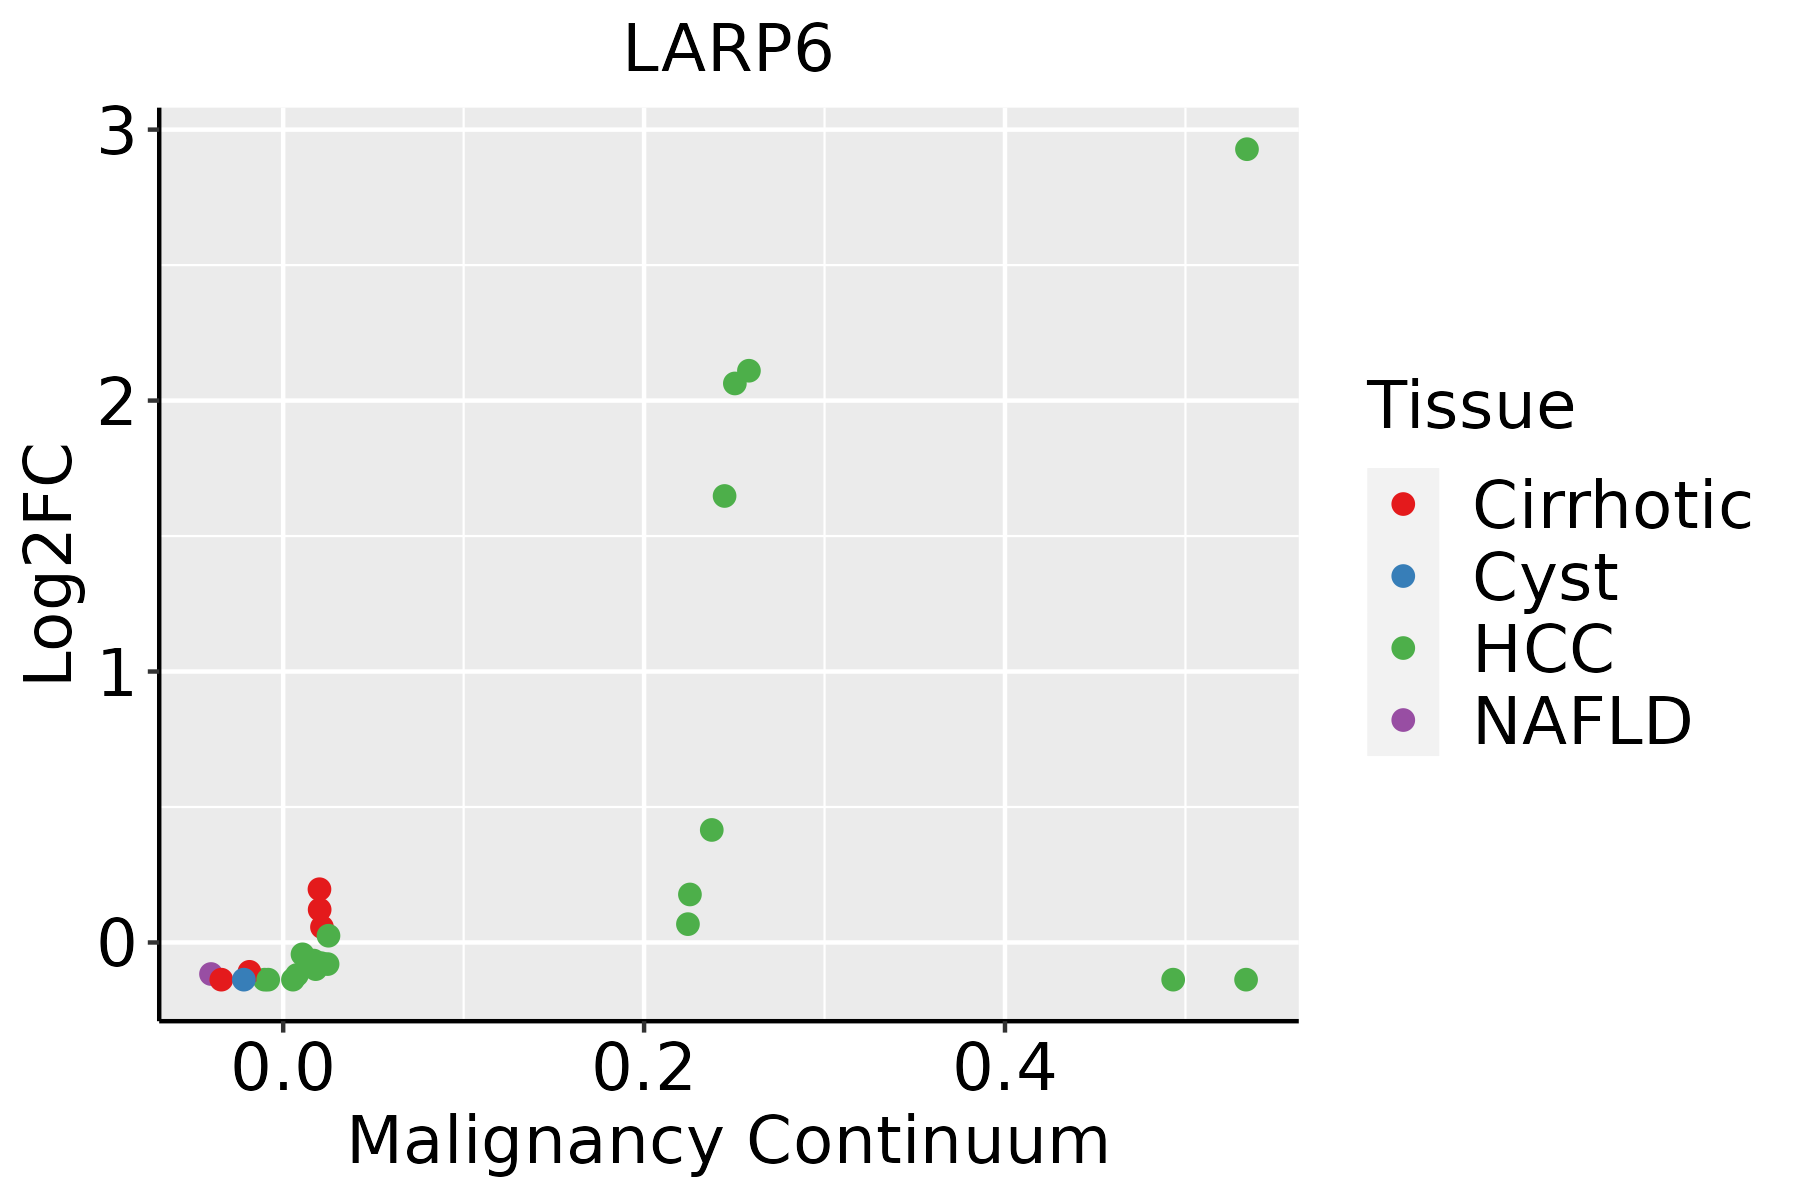 | HCC: Hepatocellular carcinoma |
| NAFLD: Non-alcoholic fatty liver disease | ||
| Oral Cavity |  | EOLP: Erosive Oral lichen planus |
| LP: leukoplakia | ||
| NEOLP: Non-erosive oral lichen planus | ||
| OSCC: Oral squamous cell carcinoma | ||
| Thyroid |  | ATC: Anaplastic thyroid cancer |
| HT: Hashimoto's thyroiditis | ||
| PTC: Papillary thyroid cancer |
| ∗log2FC in expression of this searched gene in stem-like cells from each diseased tissue sample relative to stem-like cells in normal samples in each tissue plotted against the malignancy continuum. Samples are colored based on if they are from different disease stage. |
Top |
Malignant transformation related pathway analysis |
| Find out the enriched GO biological processes and KEGG pathways involved in transition from healthy to precancer to cancer |
| Tissue | Disease Stage | Enriched GO biological Processes |
| Colorectum | AD |  |
| Colorectum | SER |  |
| Colorectum | MSS |  |
| Colorectum | MSI-H |  |
| Colorectum | FAP |  |
| ∗Top 15 enriched GO BP terms are showed in the bar plot of each disease state in each tissue. Each row represents a significant GO biological process which is colored according to the -log10(p.adjust). |
| Page: 1 2 3 4 5 6 7 8 9 |
| GO ID | Tissue | Disease Stage | Description | Gene Ratio | Bg Ratio | pvalue | p.adjust | Count |
| GO:0051098111 | Esophagus | ESCC | regulation of binding | 251/8552 | 363/18723 | 6.73e-20 | 8.46e-18 | 251 |
| GO:0006417111 | Esophagus | ESCC | regulation of translation | 304/8552 | 468/18723 | 1.53e-17 | 1.33e-15 | 304 |
| GO:0045727111 | Esophagus | ESCC | positive regulation of translation | 107/8552 | 136/18723 | 2.79e-15 | 1.68e-13 | 107 |
| GO:0034250111 | Esophagus | ESCC | positive regulation of cellular amide metabolic process | 123/8552 | 162/18723 | 3.32e-15 | 1.93e-13 | 123 |
| GO:0051099111 | Esophagus | ESCC | positive regulation of binding | 122/8552 | 173/18723 | 2.79e-11 | 9.45e-10 | 122 |
| GO:19052142 | Esophagus | ESCC | regulation of RNA binding | 12/8552 | 12/18723 | 8.21e-05 | 6.01e-04 | 12 |
| GO:00329631 | Esophagus | ESCC | collagen metabolic process | 62/8552 | 104/18723 | 2.90e-03 | 1.22e-02 | 62 |
| GO:000641712 | Liver | Cirrhotic | regulation of translation | 194/4634 | 468/18723 | 7.28e-16 | 8.79e-14 | 194 |
| GO:00457277 | Liver | Cirrhotic | positive regulation of translation | 71/4634 | 136/18723 | 4.99e-12 | 3.52e-10 | 71 |
| GO:005109812 | Liver | Cirrhotic | regulation of binding | 148/4634 | 363/18723 | 9.14e-12 | 5.97e-10 | 148 |
| GO:003425012 | Liver | Cirrhotic | positive regulation of cellular amide metabolic process | 78/4634 | 162/18723 | 8.62e-11 | 4.66e-09 | 78 |
| GO:005109912 | Liver | Cirrhotic | positive regulation of binding | 74/4634 | 173/18723 | 1.44e-07 | 3.87e-06 | 74 |
| GO:000641722 | Liver | HCC | regulation of translation | 287/7958 | 468/18723 | 8.79e-17 | 8.08e-15 | 287 |
| GO:005109822 | Liver | HCC | regulation of binding | 225/7958 | 363/18723 | 3.78e-14 | 2.37e-12 | 225 |
| GO:004572712 | Liver | HCC | positive regulation of translation | 97/7958 | 136/18723 | 8.51e-12 | 3.55e-10 | 97 |
| GO:003425022 | Liver | HCC | positive regulation of cellular amide metabolic process | 110/7958 | 162/18723 | 5.14e-11 | 1.92e-09 | 110 |
| GO:005109922 | Liver | HCC | positive regulation of binding | 108/7958 | 173/18723 | 9.22e-08 | 1.83e-06 | 108 |
| GO:1905214 | Liver | HCC | regulation of RNA binding | 10/7958 | 12/18723 | 4.79e-03 | 2.02e-02 | 10 |
| GO:000641720 | Oral cavity | OSCC | regulation of translation | 274/7305 | 468/18723 | 4.39e-18 | 4.63e-16 | 274 |
| GO:004572719 | Oral cavity | OSCC | positive regulation of translation | 101/7305 | 136/18723 | 5.85e-17 | 4.94e-15 | 101 |
| Page: 1 2 3 |
| Pathway ID | Tissue | Disease Stage | Description | Gene Ratio | Bg Ratio | pvalue | p.adjust | qvalue | Count |
| Page: 1 |
Top |
Cell-cell communication analysis |
| Identification of potential cell-cell interactions between two cell types and their ligand-receptor pairs for different disease states |
| Ligand | Receptor | LRpair | Pathway | Tissue | Disease Stage |
| Page: 1 |
Top |
Single-cell gene regulatory network inference analysis |
| Find out the significant the regulons (TFs) and the target genes of each regulon across cell types for different disease states |
| TF | Cell Type | Tissue | Disease Stage | Target Gene | RSS | Regulon Activity |
| ∗The dot plots of a searched regulon are shown for all cell subpopulations in each disease state of each tissue based on the regulon specific score inferred using pySCENIC and by calculating the average expression. |
| Page: 1 |
Top |
Somatic mutation of malignant transformation related genes |
| Annotation of somatic variants for genes involved in malignant transformation |
| Hugo Symbol | Variant Class | Variant Classification | dbSNP RS | HGVSc | HGVSp | HGVSp Short | SWISSPROT | BIOTYPE | SIFT | PolyPhen | Tumor Sample Barcode | Tissue | Histology | Sex | Age | Stage | Therapy Types | Drugs | Outcome |
| LARP6 | SNV | Missense_Mutation | c.712N>C | p.Glu238Gln | p.E238Q | Q9BRS8 | protein_coding | deleterious(0.01) | possibly_damaging(0.658) | TCGA-AN-A0XW-01 | Breast | breast invasive carcinoma | Female | <65 | III/IV | Unknown | Unknown | SD | |
| LARP6 | SNV | Missense_Mutation | rs771366776 | c.337N>A | p.Ala113Thr | p.A113T | Q9BRS8 | protein_coding | deleterious(0) | probably_damaging(0.97) | TCGA-AR-A1AS-01 | Breast | breast invasive carcinoma | Female | <65 | I/II | Chemotherapy | doxorubicin | SD |
| LARP6 | SNV | Missense_Mutation | novel | c.1058G>A | p.Arg353Gln | p.R353Q | Q9BRS8 | protein_coding | tolerated(0.18) | probably_damaging(0.92) | TCGA-C8-A8HQ-01 | Breast | breast invasive carcinoma | Female | <65 | I/II | Unknown | Unknown | SD |
| LARP6 | SNV | Missense_Mutation | rs147847290 | c.385G>A | p.Val129Ile | p.V129I | Q9BRS8 | protein_coding | tolerated(0.63) | benign(0.082) | TCGA-GM-A2DH-01 | Breast | breast invasive carcinoma | Female | <65 | I/II | Chemotherapy | taxol | CR |
| LARP6 | deletion | Frame_Shift_Del | novel | c.985delN | p.Tyr329ThrfsTer43 | p.Y329Tfs*43 | Q9BRS8 | protein_coding | TCGA-EW-A2FV-01 | Breast | breast invasive carcinoma | Female | <65 | III/IV | Chemotherapy | docetaxel | SD | ||
| LARP6 | SNV | Missense_Mutation | novel | c.691N>T | p.Arg231Trp | p.R231W | Q9BRS8 | protein_coding | deleterious(0) | probably_damaging(0.999) | TCGA-2W-A8YY-01 | Cervix | cervical & endocervical cancer | Female | <65 | I/II | Chemotherapy | cisplatin | CR |
| LARP6 | SNV | Missense_Mutation | rs765085044 | c.1273N>A | p.Val425Ile | p.V425I | Q9BRS8 | protein_coding | tolerated(1) | benign(0) | TCGA-C5-A7UI-01 | Cervix | cervical & endocervical cancer | Female | <65 | I/II | Unknown | Unknown | SD |
| LARP6 | SNV | Missense_Mutation | c.421C>G | p.Leu141Val | p.L141V | Q9BRS8 | protein_coding | deleterious(0) | probably_damaging(0.999) | TCGA-DR-A0ZM-01 | Cervix | cervical & endocervical cancer | Female | <65 | III/IV | Unspecific | Cisplatin | SD | |
| LARP6 | SNV | Missense_Mutation | c.1249N>G | p.Met417Val | p.M417V | Q9BRS8 | protein_coding | tolerated(0.6) | benign(0) | TCGA-AA-3492-01 | Colorectum | colon adenocarcinoma | Female | >=65 | I/II | Unknown | Unknown | SD | |
| LARP6 | SNV | Missense_Mutation | rs765085044 | c.1273N>A | p.Val425Ile | p.V425I | Q9BRS8 | protein_coding | tolerated(1) | benign(0) | TCGA-AA-A00N-01 | Colorectum | colon adenocarcinoma | Male | >=65 | I/II | Unknown | Unknown | PD |
| Page: 1 2 3 4 5 6 |
Top |
Related drugs of malignant transformation related genes |
| Identification of chemicals and drugs interact with genes involved in malignant transfromation |
| (DGIdb 4.0) |
| Entrez ID | Symbol | Category | Interaction Types | Drug Claim Name | Drug Name | PMIDs |
| Page: 1 |

Copyright 2023-Present -The University of Texas Health Science Center at Houston |