| Tissue | Expression Dynamics | Abbreviation |
| Cervix | 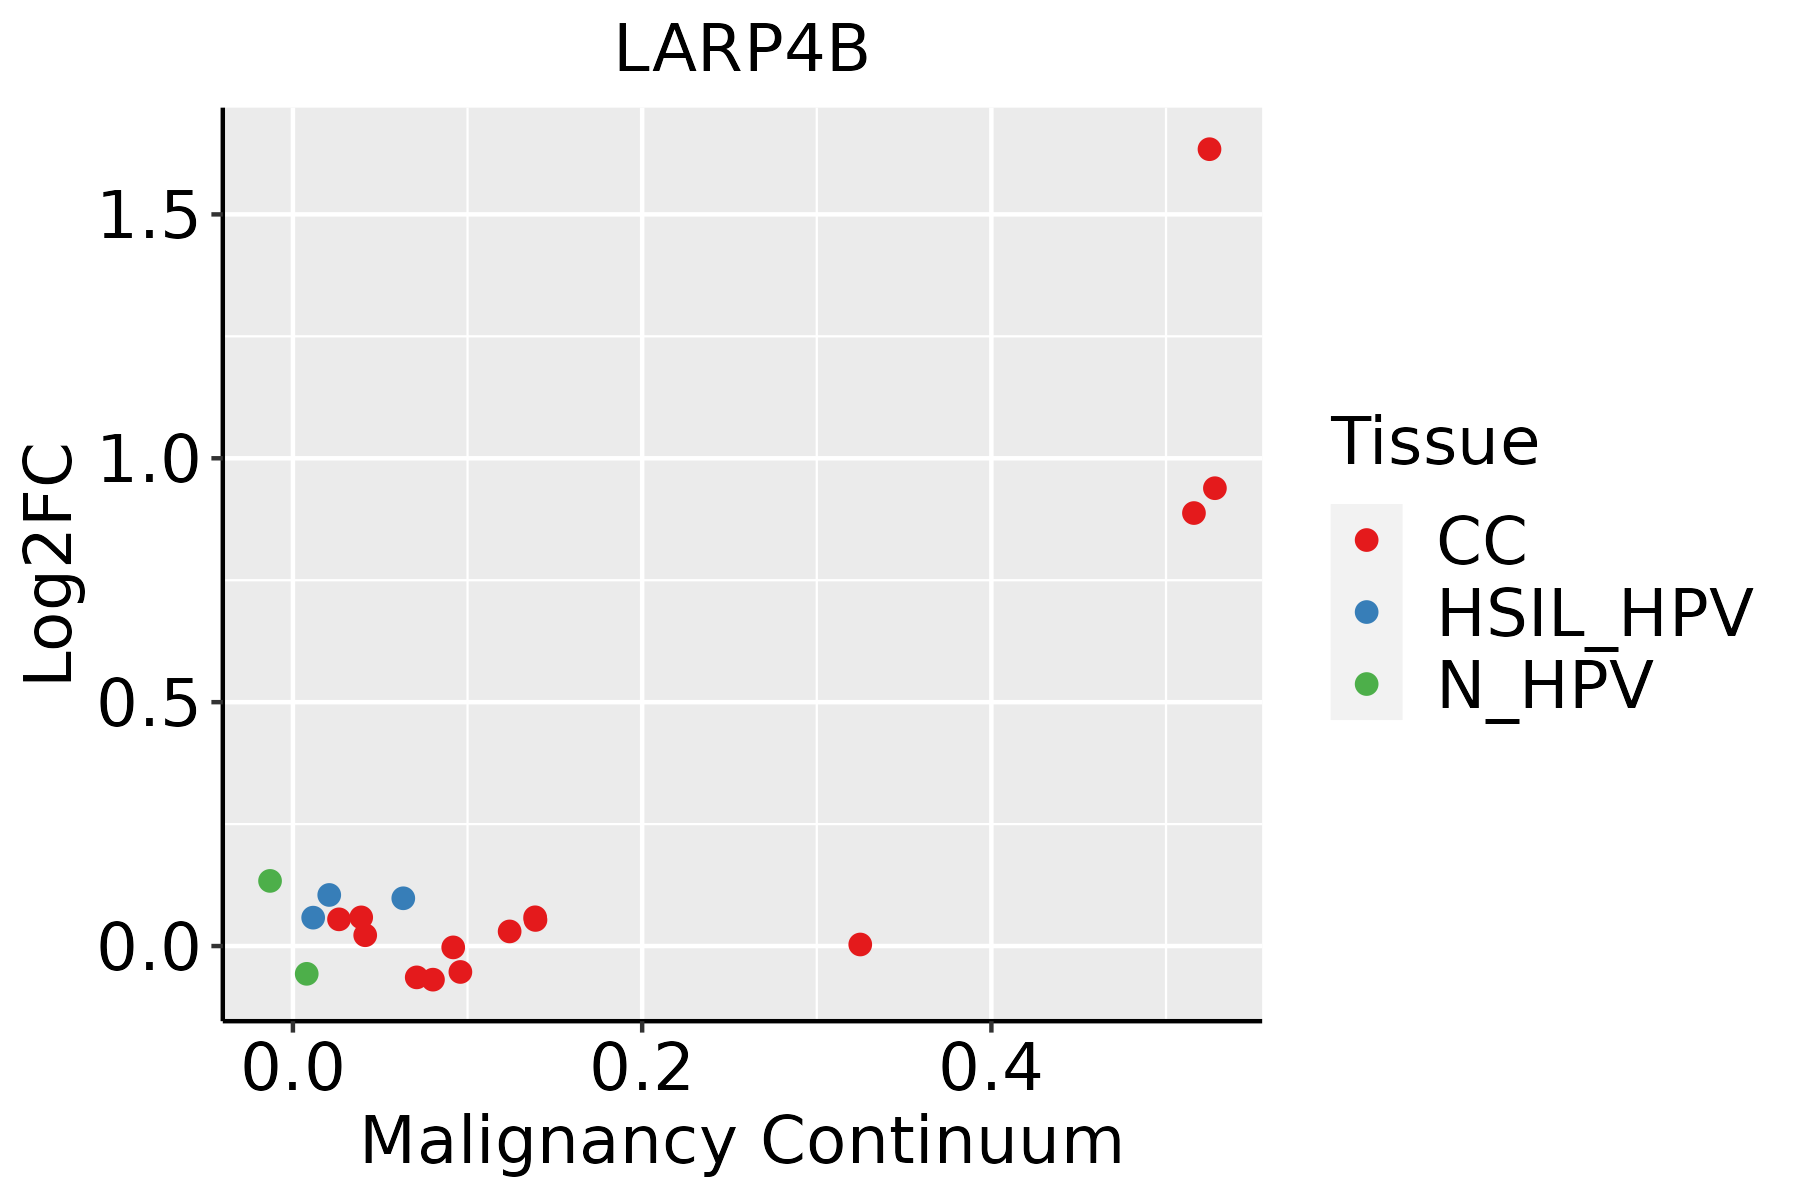 | CC: Cervix cancer |
| HSIL_HPV: HPV-infected high-grade squamous intraepithelial lesions |
| N_HPV: HPV-infected normal cervix |
| Colorectum (GSE201348) |  | FAP: Familial adenomatous polyposis |
| CRC: Colorectal cancer |
| Colorectum (HTA11) |  | AD: Adenomas |
| SER: Sessile serrated lesions |
| MSI-H: Microsatellite-high colorectal cancer |
| MSS: Microsatellite stable colorectal cancer |
| Endometrium | 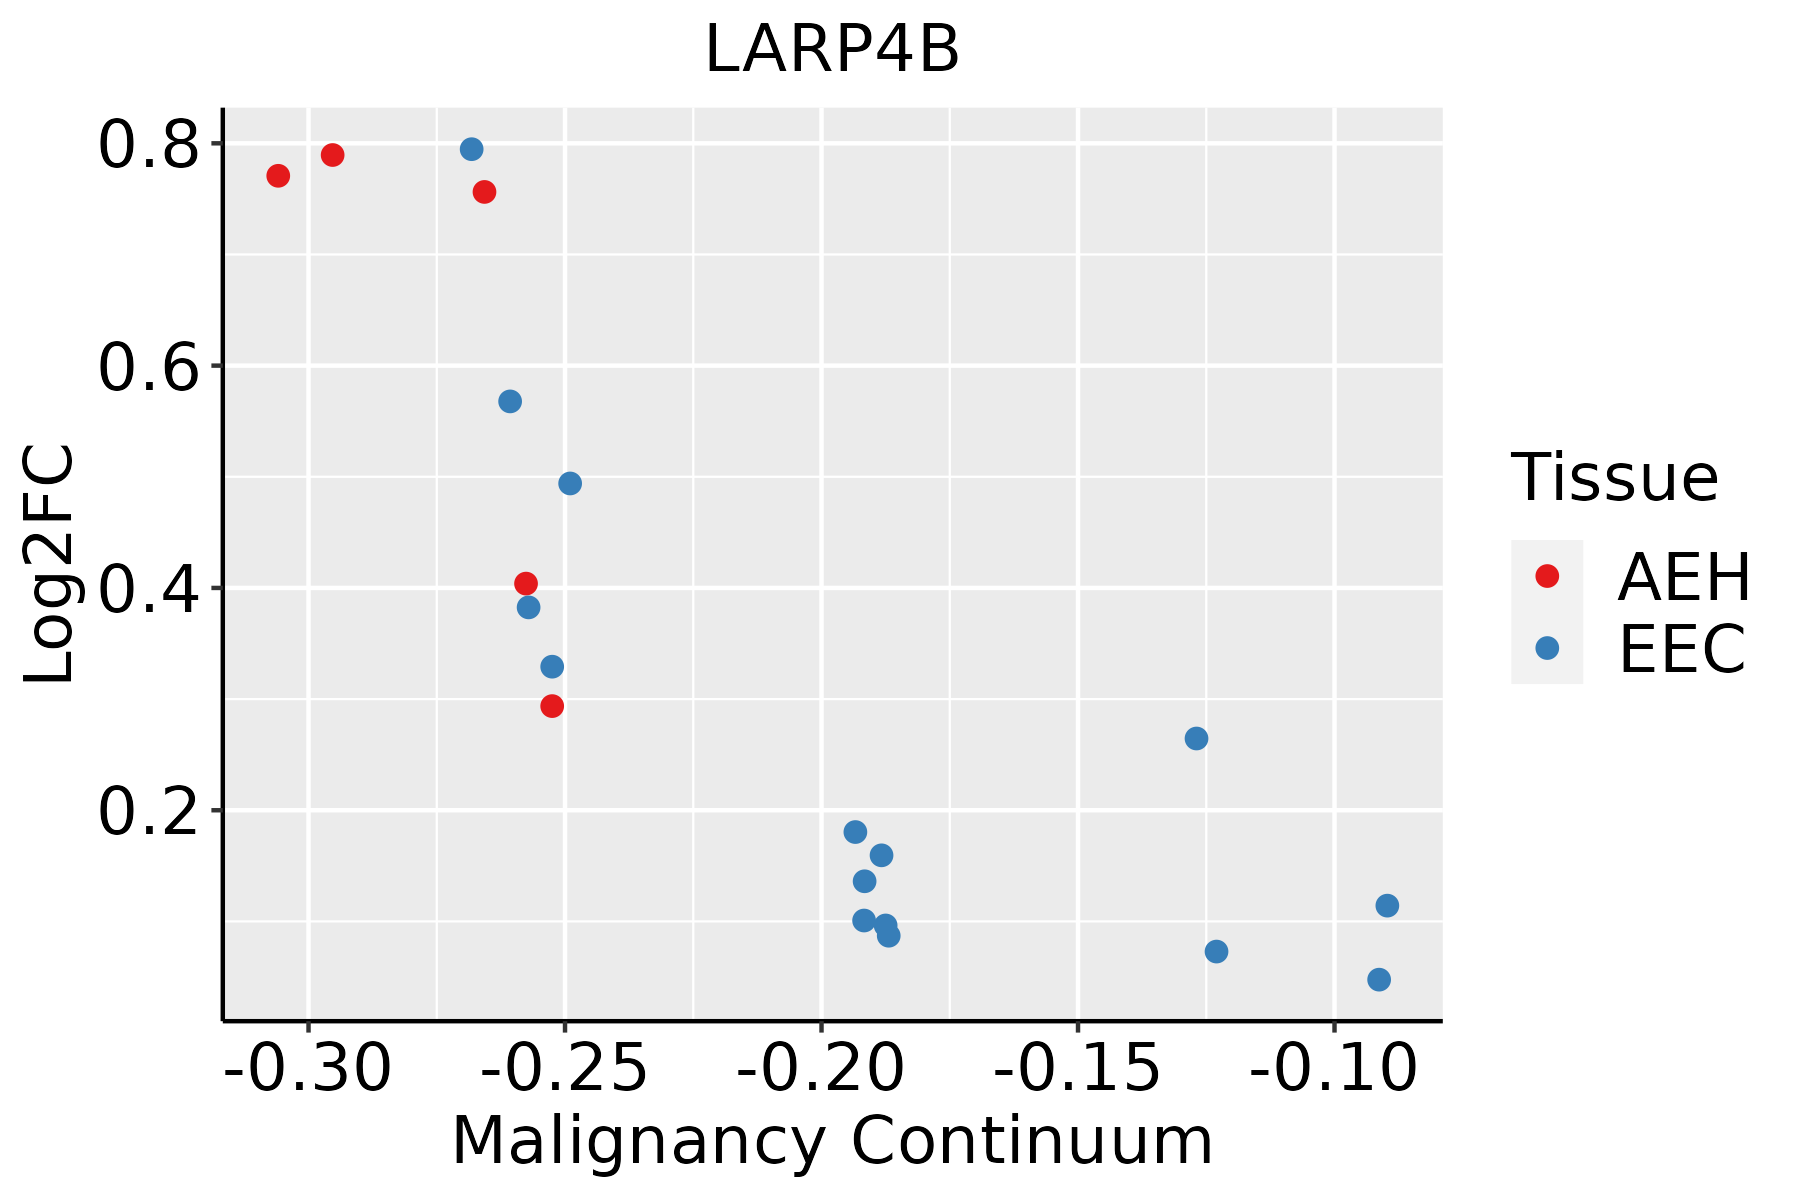 | AEH: Atypical endometrial hyperplasia |
| EEC: Endometrioid Cancer |
| Esophagus | 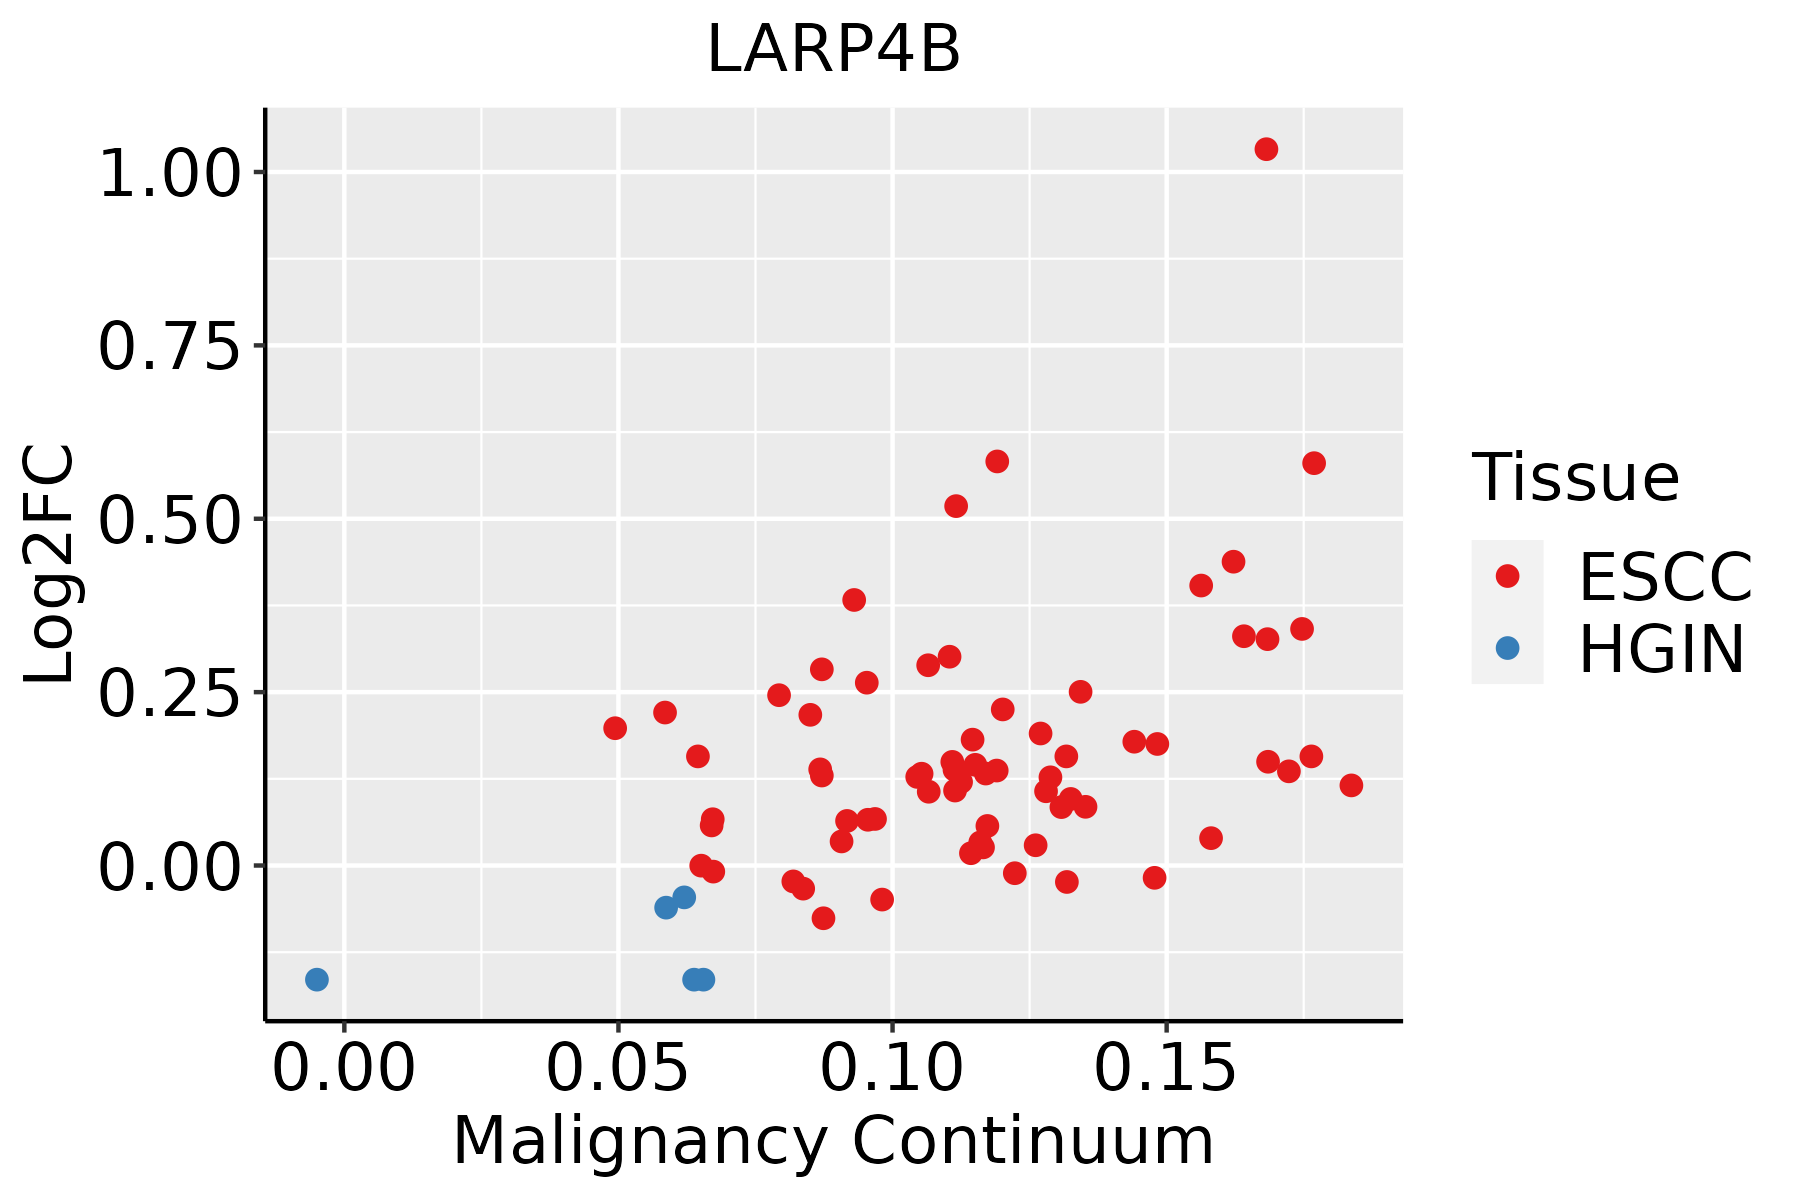 | ESCC: Esophageal squamous cell carcinoma |
| HGIN: High-grade intraepithelial neoplasias |
| LGIN: Low-grade intraepithelial neoplasias |
| Liver |  | HCC: Hepatocellular carcinoma |
| NAFLD: Non-alcoholic fatty liver disease |
| Lung | 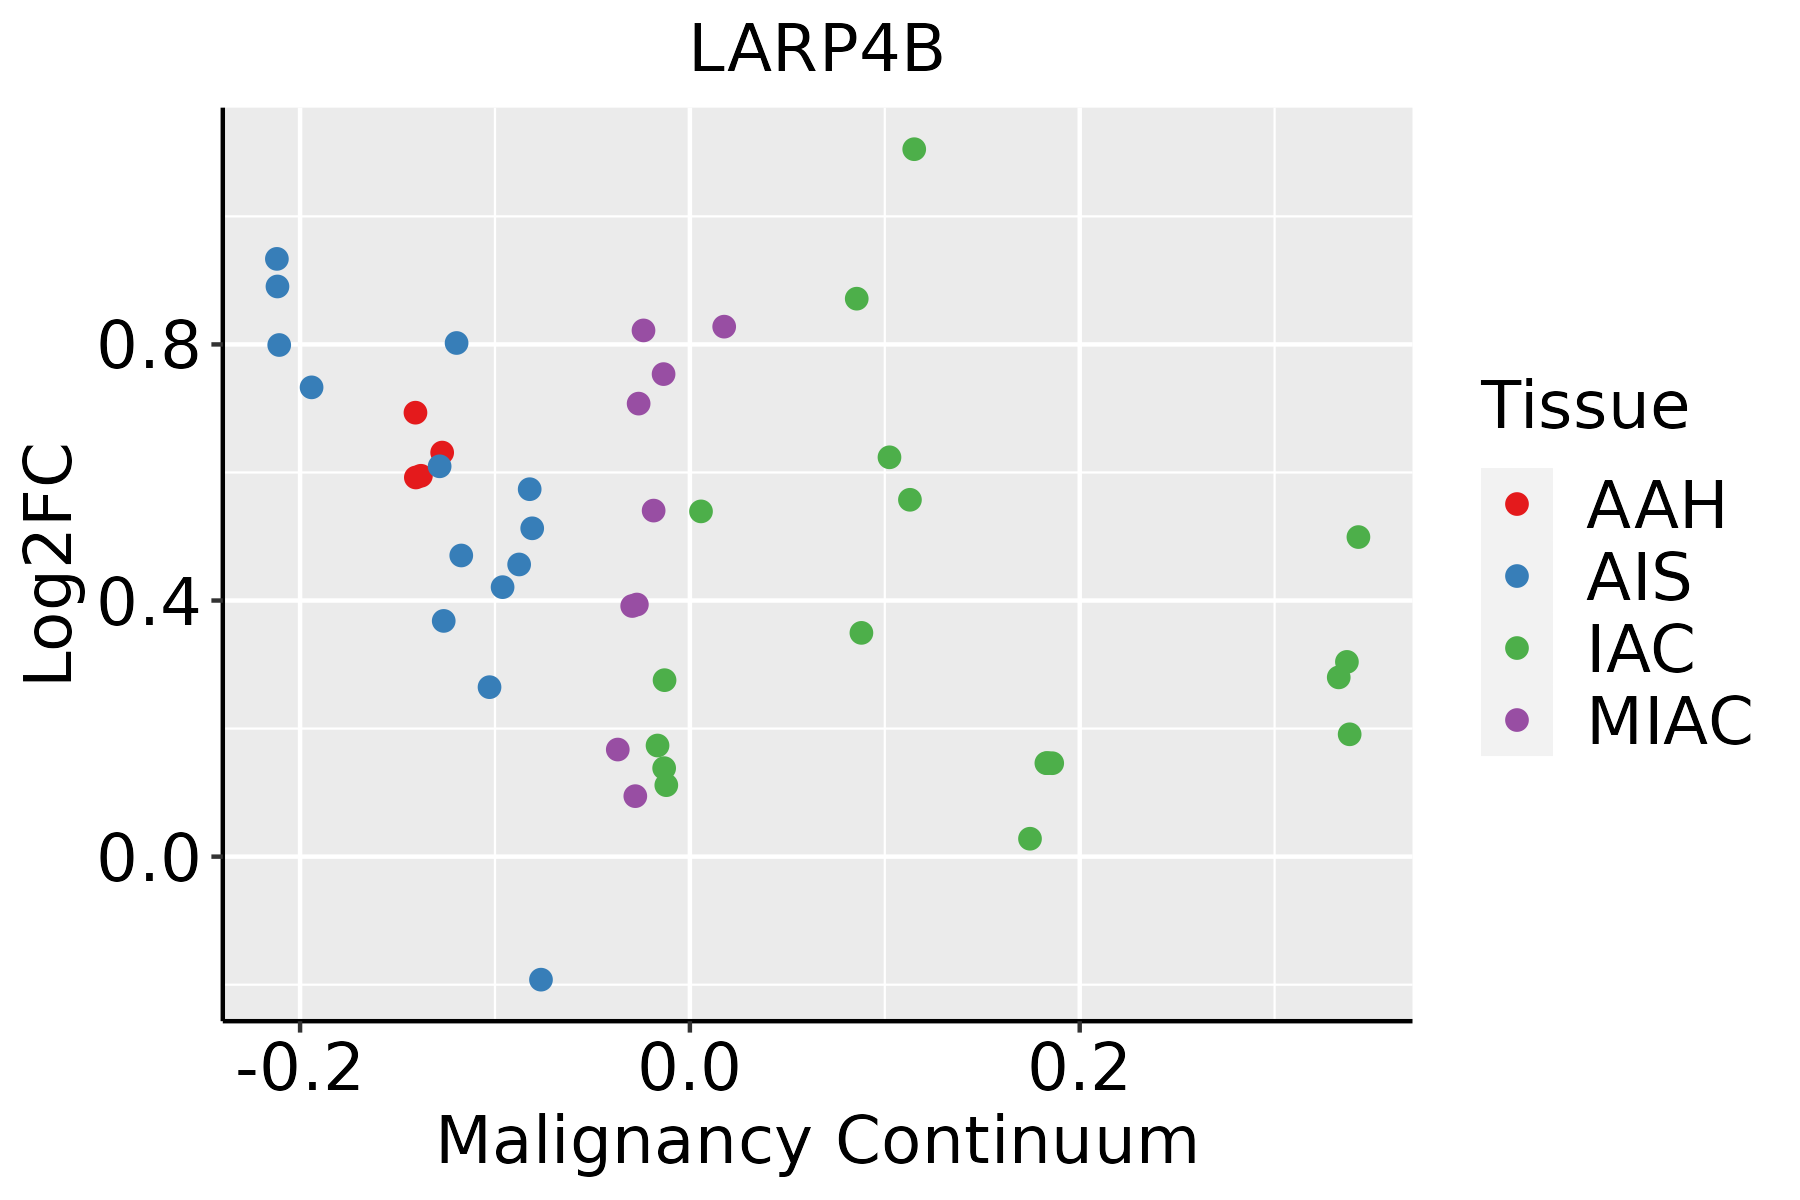 | AAH: Atypical adenomatous hyperplasia |
| AIS: Adenocarcinoma in situ |
| IAC: Invasive lung adenocarcinoma |
| MIA: Minimally invasive adenocarcinoma |
| Oral Cavity | 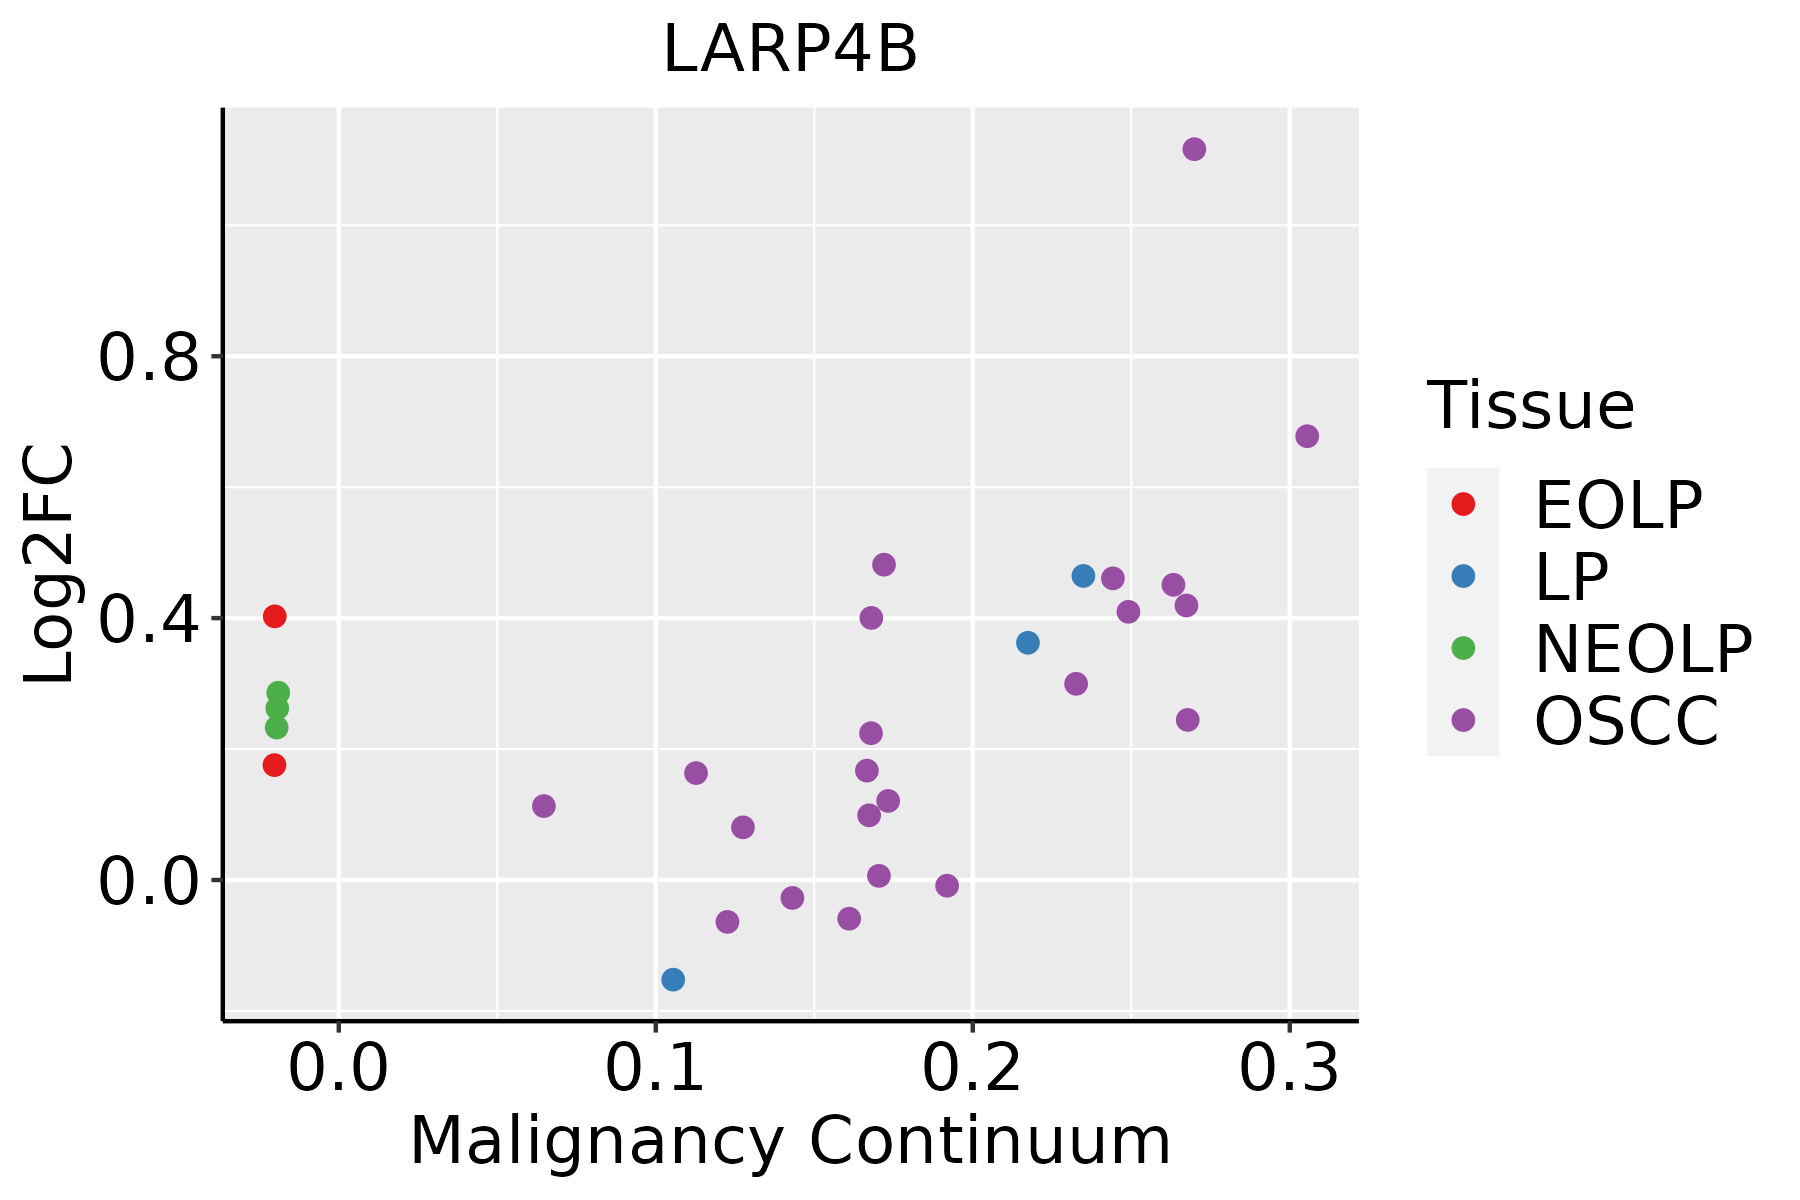 | EOLP: Erosive Oral lichen planus |
| LP: leukoplakia |
| NEOLP: Non-erosive oral lichen planus |
| OSCC: Oral squamous cell carcinoma |
| Prostate | 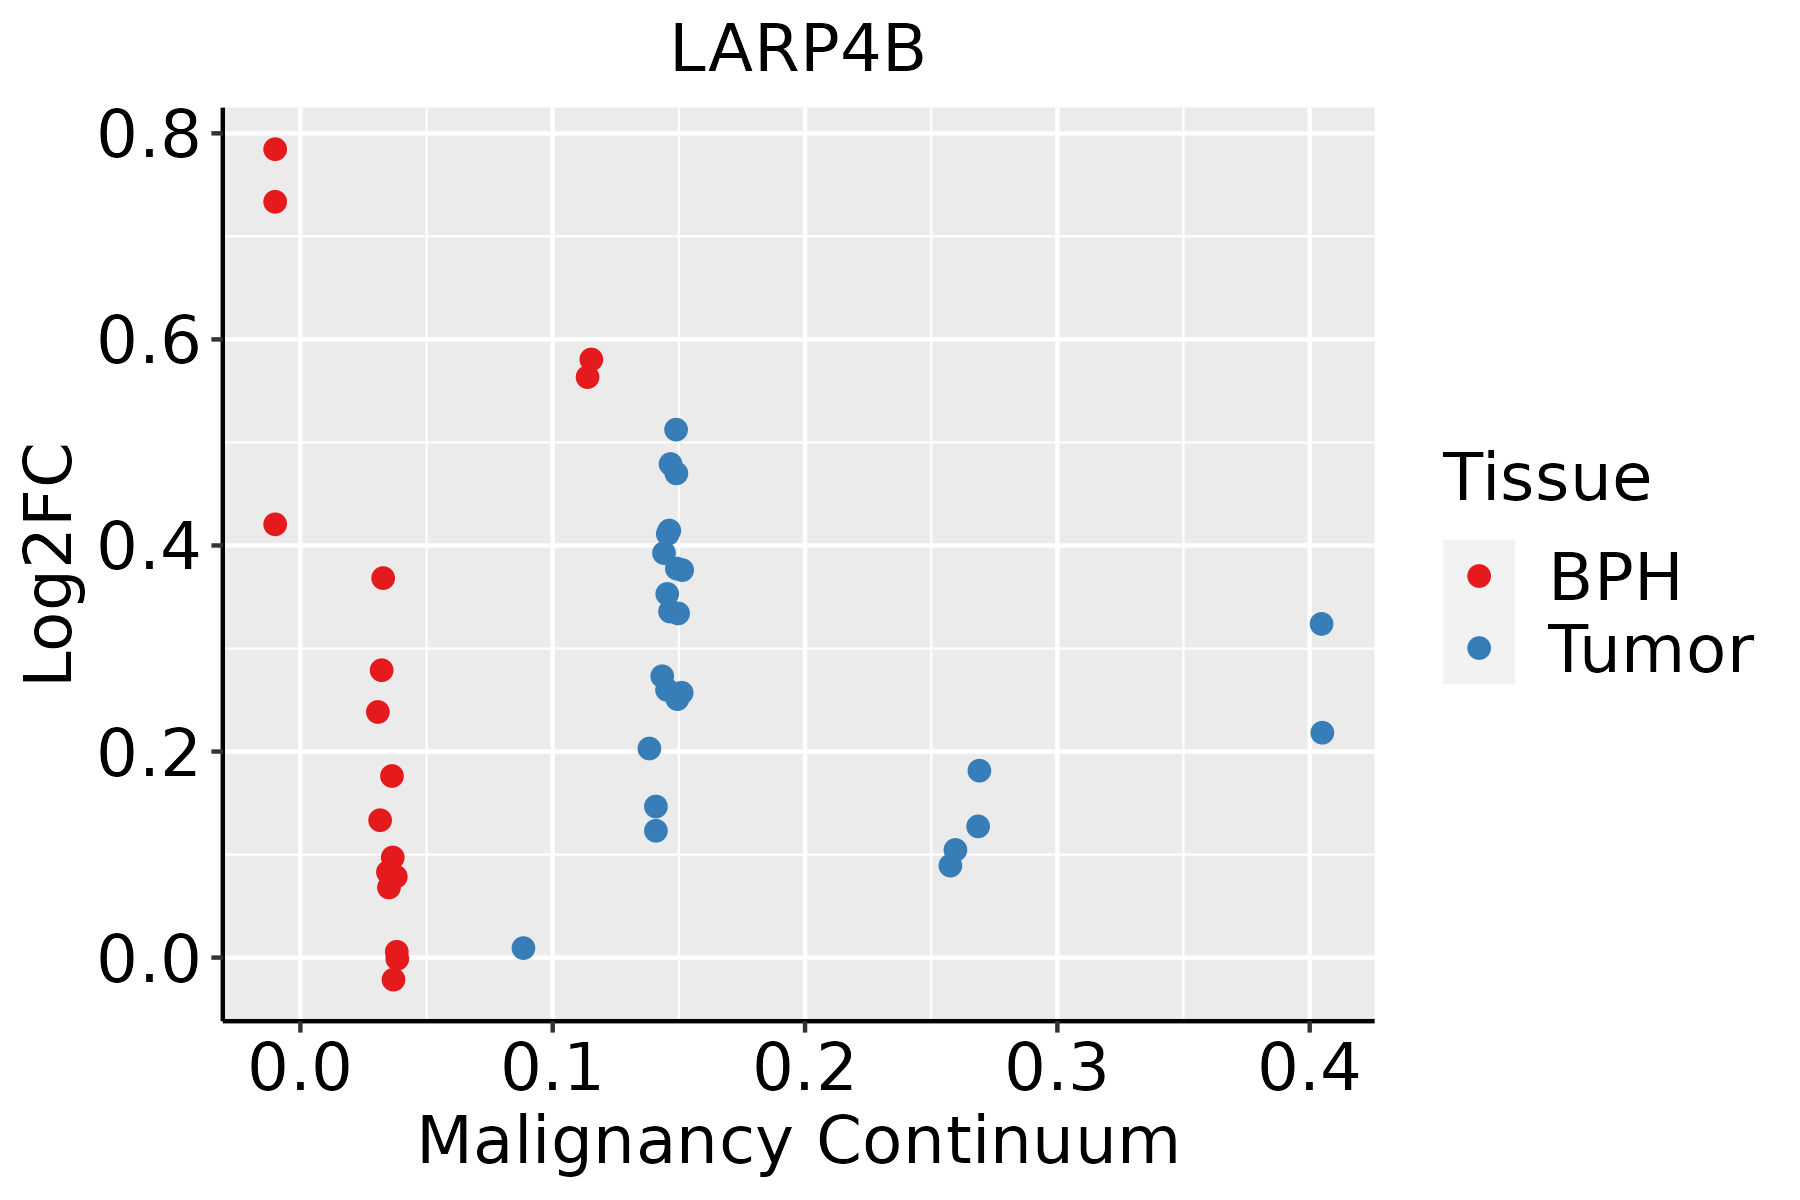 | BPH: Benign Prostatic Hyperplasia |
| Skin | 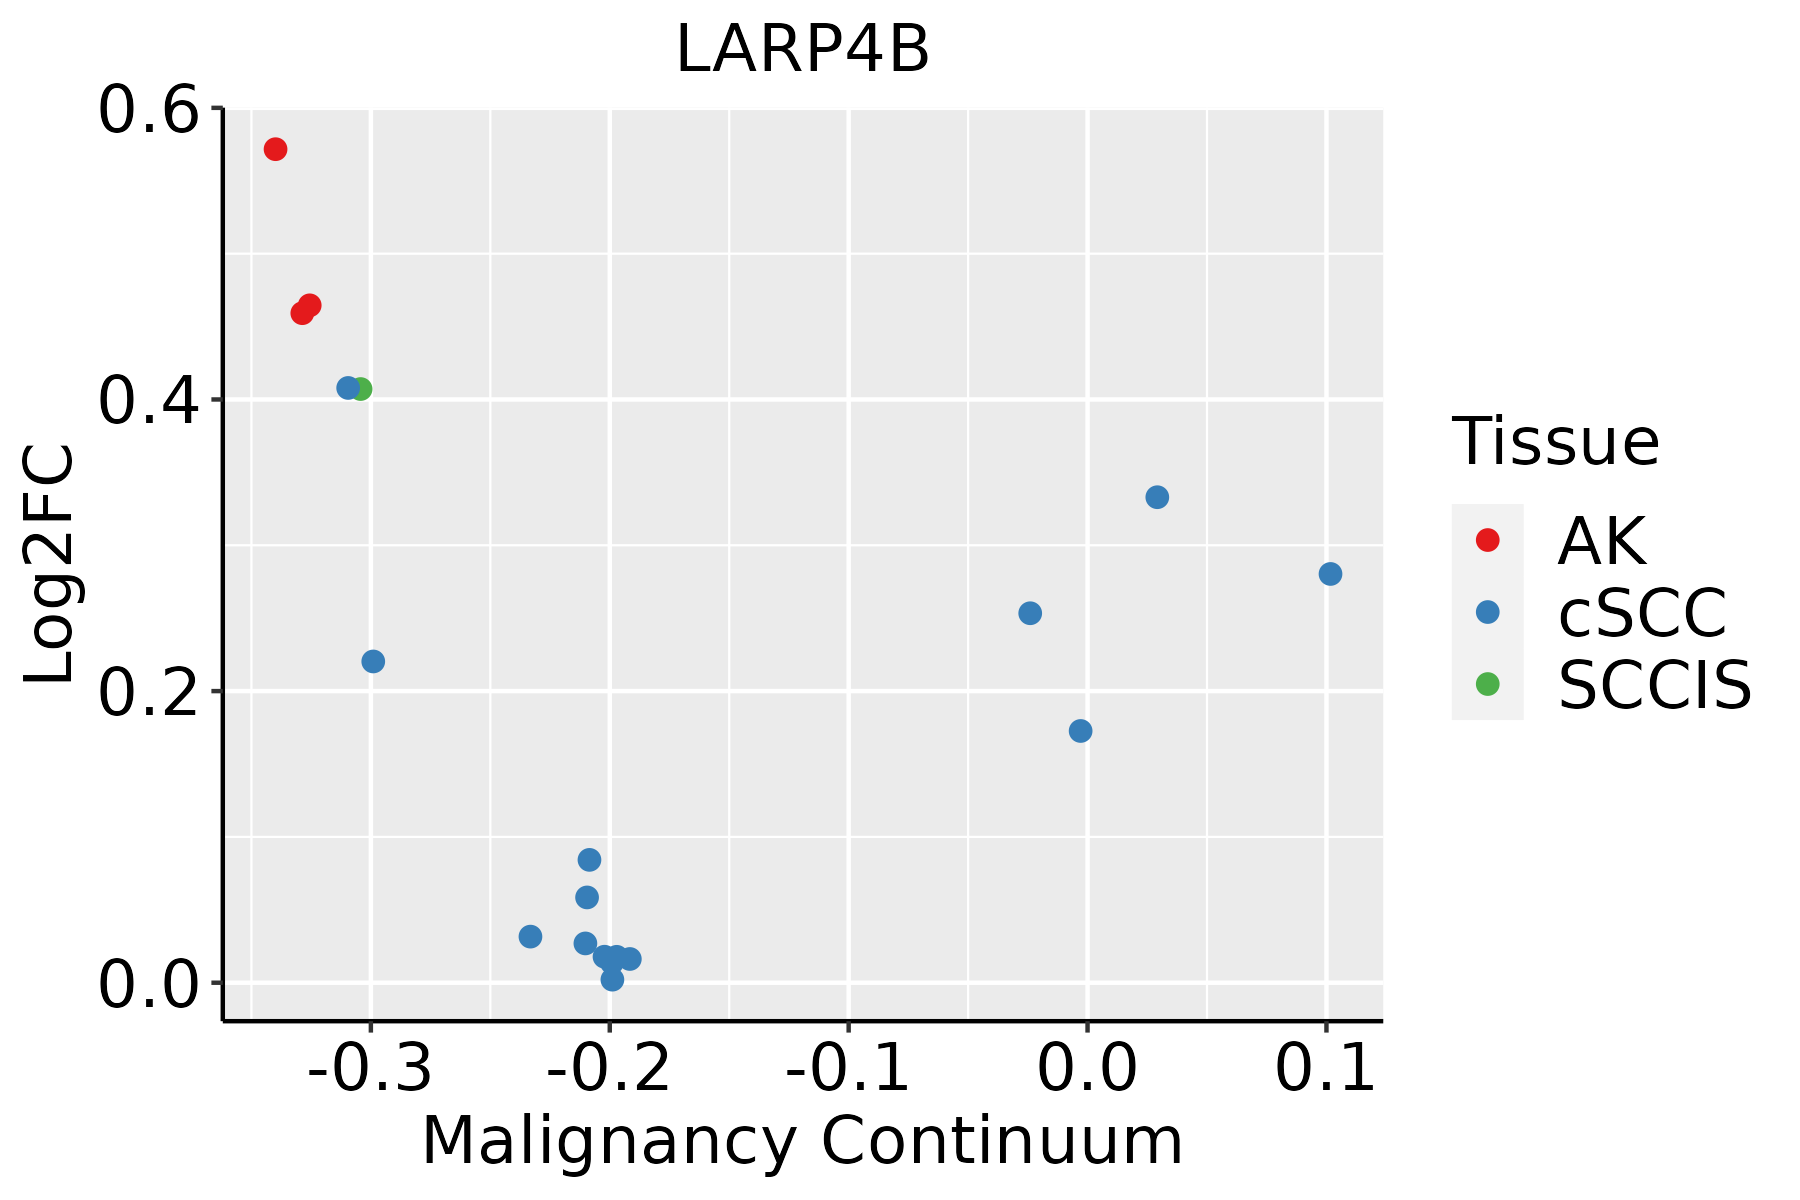 | AK: Actinic keratosis |
| cSCC: Cutaneous squamous cell carcinoma |
| SCCIS:squamous cell carcinoma in situ |
| Thyroid | 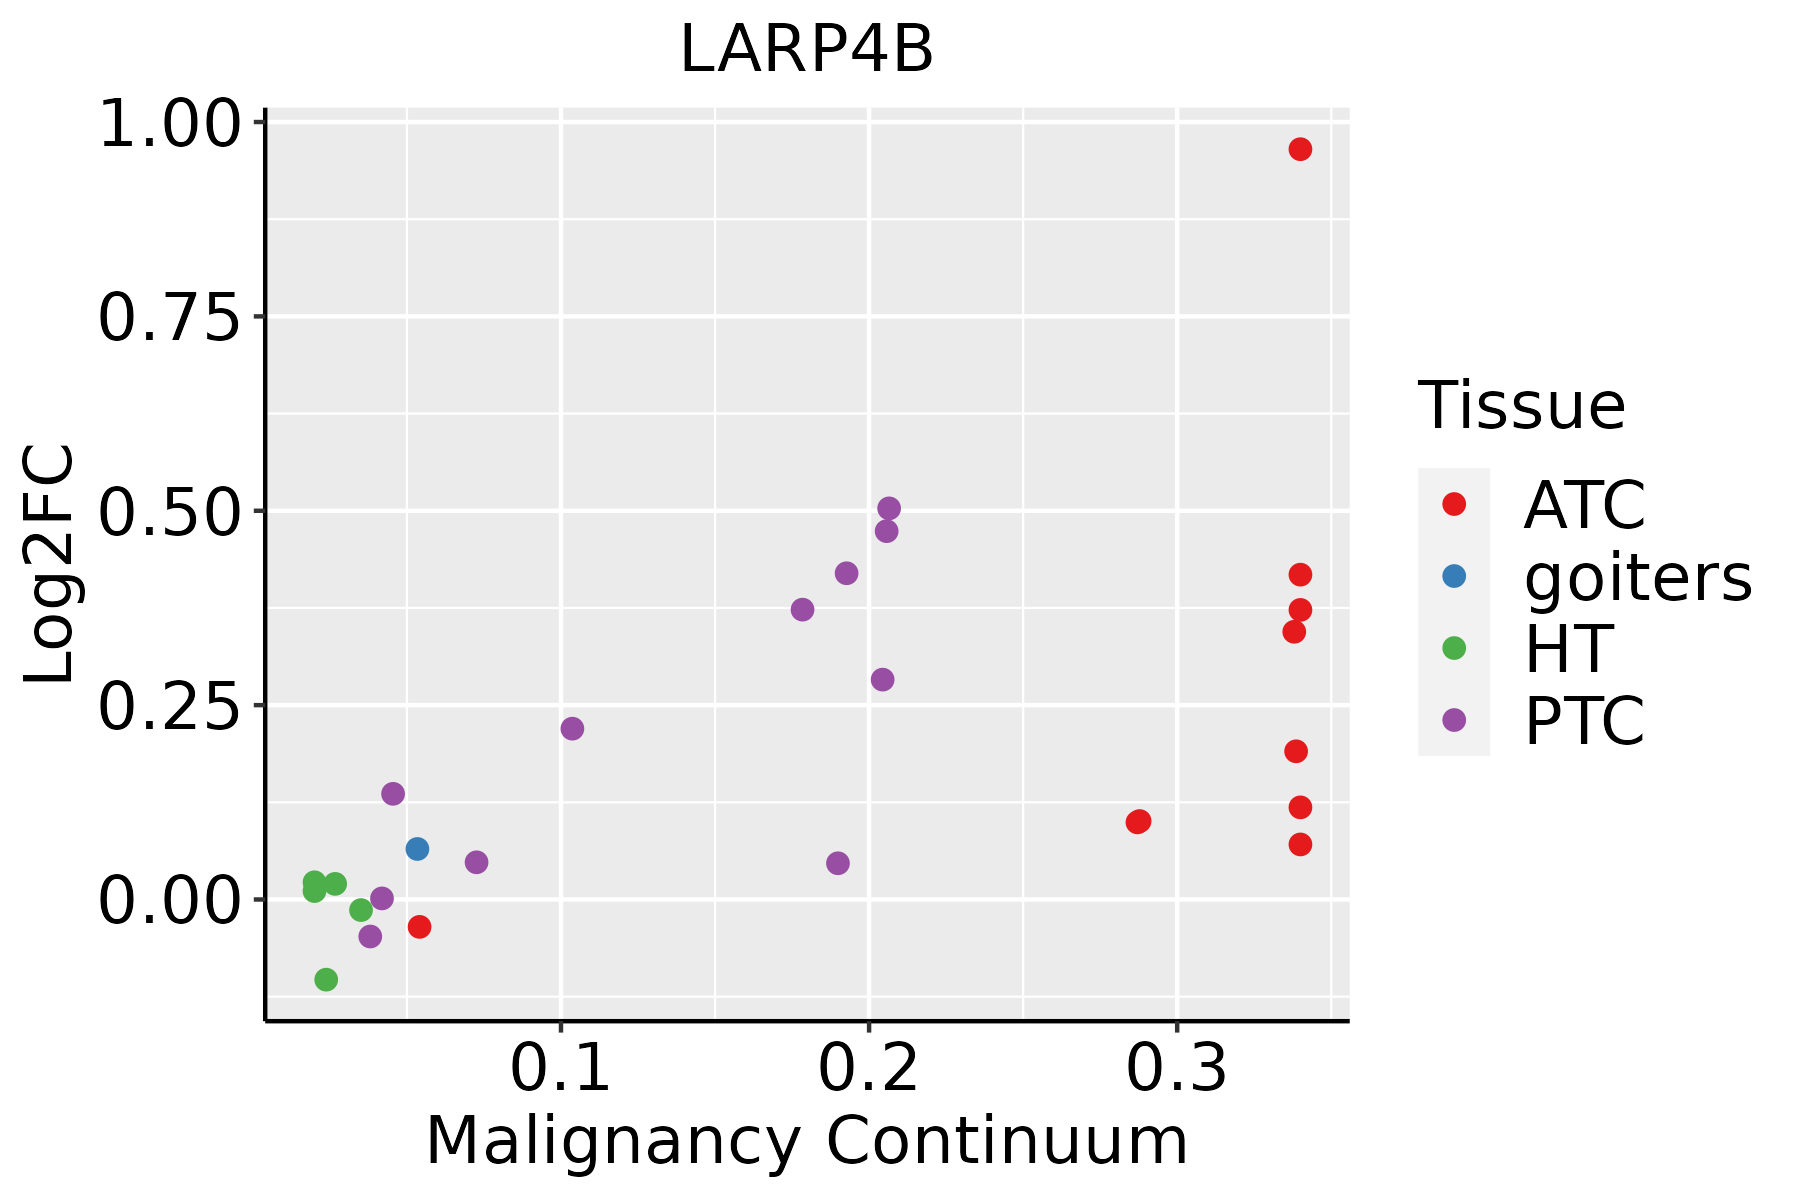 | ATC: Anaplastic thyroid cancer |
| HT: Hashimoto's thyroiditis |
| PTC: Papillary thyroid cancer |
| GO ID | Tissue | Disease Stage | Description | Gene Ratio | Bg Ratio | pvalue | p.adjust | Count |
| GO:003133010 | Cervix | CC | negative regulation of cellular catabolic process | 63/2311 | 262/18723 | 1.10e-07 | 5.68e-06 | 63 |
| GO:00064029 | Cervix | CC | mRNA catabolic process | 56/2311 | 232/18723 | 4.81e-07 | 1.83e-05 | 56 |
| GO:19033119 | Cervix | CC | regulation of mRNA metabolic process | 64/2311 | 288/18723 | 1.71e-06 | 5.64e-05 | 64 |
| GO:000989510 | Cervix | CC | negative regulation of catabolic process | 69/2311 | 320/18723 | 2.15e-06 | 6.55e-05 | 69 |
| GO:00064019 | Cervix | CC | RNA catabolic process | 62/2311 | 278/18723 | 2.18e-06 | 6.56e-05 | 62 |
| GO:003425010 | Cervix | CC | positive regulation of cellular amide metabolic process | 40/2311 | 162/18723 | 1.11e-05 | 2.41e-04 | 40 |
| GO:000641710 | Cervix | CC | regulation of translation | 89/2311 | 468/18723 | 1.86e-05 | 3.46e-04 | 89 |
| GO:004572710 | Cervix | CC | positive regulation of translation | 33/2311 | 136/18723 | 9.09e-05 | 1.20e-03 | 33 |
| GO:00610139 | Cervix | CC | regulation of mRNA catabolic process | 38/2311 | 166/18723 | 1.07e-04 | 1.36e-03 | 38 |
| GO:190331210 | Cervix | CC | negative regulation of mRNA metabolic process | 24/2311 | 92/18723 | 2.49e-04 | 2.77e-03 | 24 |
| GO:00467008 | Cervix | CC | heterocycle catabolic process | 80/2311 | 445/18723 | 3.23e-04 | 3.42e-03 | 80 |
| GO:00346559 | Cervix | CC | nucleobase-containing compound catabolic process | 74/2311 | 407/18723 | 3.77e-04 | 3.88e-03 | 74 |
| GO:00434889 | Cervix | CC | regulation of mRNA stability | 35/2311 | 158/18723 | 3.80e-04 | 3.89e-03 | 35 |
| GO:00434879 | Cervix | CC | regulation of RNA stability | 36/2311 | 170/18723 | 7.72e-04 | 6.86e-03 | 36 |
| GO:00442709 | Cervix | CC | cellular nitrogen compound catabolic process | 79/2311 | 451/18723 | 7.80e-04 | 6.91e-03 | 79 |
| GO:19023698 | Cervix | CC | negative regulation of RNA catabolic process | 19/2311 | 75/18723 | 1.54e-03 | 1.19e-02 | 19 |
| GO:00194398 | Cervix | CC | aromatic compound catabolic process | 79/2311 | 467/18723 | 2.14e-03 | 1.54e-02 | 79 |
| GO:19013618 | Cervix | CC | organic cyclic compound catabolic process | 80/2311 | 495/18723 | 6.77e-03 | 3.72e-02 | 80 |
| GO:19023738 | Cervix | CC | negative regulation of mRNA catabolic process | 15/2311 | 63/18723 | 8.52e-03 | 4.40e-02 | 15 |
| GO:1903311 | Colorectum | AD | regulation of mRNA metabolic process | 117/3918 | 288/18723 | 1.69e-14 | 4.23e-12 | 117 |
| Hugo Symbol | Variant Class | Variant Classification | dbSNP RS | HGVSc | HGVSp | HGVSp Short | SWISSPROT | BIOTYPE | SIFT | PolyPhen | Tumor Sample Barcode | Tissue | Histology | Sex | Age | Stage | Therapy Types | Drugs | Outcome |
| LARP4B | SNV | Missense_Mutation | | c.1148G>T | p.Gly383Val | p.G383V | Q92615 | protein_coding | deleterious(0.01) | benign(0.231) | TCGA-A2-A0CS-01 | Breast | breast invasive carcinoma | Female | >=65 | III/IV | Hormone Therapy | anastrozole | SD |
| LARP4B | SNV | Missense_Mutation | novel | c.792N>G | p.Phe264Leu | p.F264L | Q92615 | protein_coding | deleterious(0.05) | probably_damaging(0.997) | TCGA-A8-A06O-01 | Breast | breast invasive carcinoma | Female | <65 | I/II | Hormone Therapy | letrozole | SD |
| LARP4B | SNV | Missense_Mutation | | c.895T>C | p.Phe299Leu | p.F299L | Q92615 | protein_coding | deleterious(0) | probably_damaging(0.997) | TCGA-E2-A154-01 | Breast | breast invasive carcinoma | Female | >=65 | I/II | Hormone Therapy | arimidex | SD |
| LARP4B | SNV | Missense_Mutation | | c.1285C>G | p.Pro429Ala | p.P429A | Q92615 | protein_coding | tolerated(0.44) | benign(0.001) | TCGA-EW-A1OY-01 | Breast | breast invasive carcinoma | Female | <65 | I/II | Chemotherapy | doxorubicin | SD |
| LARP4B | deletion | Frame_Shift_Del | novel | c.793delN | p.Ile265Ter | p.I265* | Q92615 | protein_coding | | | TCGA-A8-A06O-01 | Breast | breast invasive carcinoma | Female | <65 | I/II | Hormone Therapy | letrozole | SD |
| LARP4B | insertion | Frame_Shift_Ins | novel | c.614_615insATCAC | p.Asp206SerfsTer6 | p.D206Sfs*6 | Q92615 | protein_coding | | | TCGA-AR-A251-01 | Breast | breast invasive carcinoma | Female | <65 | III/IV | Chemotherapy | doxorubicin | SD |
| LARP4B | SNV | Missense_Mutation | novel | c.100N>G | p.Gln34Glu | p.Q34E | Q92615 | protein_coding | tolerated_low_confidence(0.32) | benign(0) | TCGA-DS-A1OB-01 | Cervix | cervical & endocervical cancer | Female | <65 | I/II | Chemotherapy | carboplatin | PD |
| LARP4B | SNV | Missense_Mutation | | c.817N>A | p.Asp273Asn | p.D273N | Q92615 | protein_coding | tolerated(0.31) | probably_damaging(1) | TCGA-IR-A3LI-01 | Cervix | cervical & endocervical cancer | Female | <65 | I/II | Chemotherapy | cisplatin | CR |
| LARP4B | SNV | Missense_Mutation | | c.532T>C | p.Tyr178His | p.Y178H | Q92615 | protein_coding | deleterious(0) | probably_damaging(0.996) | TCGA-AA-3672-01 | Colorectum | colon adenocarcinoma | Female | >=65 | III/IV | Unknown | Unknown | SD |
| LARP4B | SNV | Missense_Mutation | rs199947494 | c.2174N>A | p.Arg725His | p.R725H | Q92615 | protein_coding | deleterious(0.03) | benign(0.01) | TCGA-AA-3821-01 | Colorectum | colon adenocarcinoma | Female | >=65 | I/II | Unknown | Unknown | SD |


