
|
|||||
|
 | |
| |
| |
| |
| |
| |
|
Gene: LARP1 |
Gene summary for LARP1 |
| Gene information | Species | Human | Gene symbol | LARP1 | Gene ID | 23367 |
| Gene name | La ribonucleoprotein 1, translational regulator | |
| Gene Alias | LARP | |
| Cytomap | 5q33.2 | |
| Gene Type | protein-coding | GO ID | GO:0006139 | UniProtAcc | Q6PKG0 |
Top |
Malignant transformation analysis |
| Identification of the aberrant gene expression in precancerous and cancerous lesions by comparing the gene expression of stem-like cells in diseased tissues with normal stem cells |
| Entrez ID | Symbol | Replicates | Species | Organ | Tissue | Adj P-value | Log2FC | Malignancy |
| 23367 | LARP1 | HTA11_1938_2000001011 | Human | Colorectum | AD | 2.37e-03 | 4.87e-01 | -0.0811 |
| 23367 | LARP1 | HTA11_78_2000001011 | Human | Colorectum | AD | 1.05e-03 | 4.92e-01 | -0.1088 |
| 23367 | LARP1 | HTA11_347_2000001011 | Human | Colorectum | AD | 4.11e-12 | 6.29e-01 | -0.1954 |
| 23367 | LARP1 | HTA11_696_2000001011 | Human | Colorectum | AD | 5.15e-03 | 5.06e-01 | -0.1464 |
| 23367 | LARP1 | HTA11_1391_2000001011 | Human | Colorectum | AD | 1.95e-11 | 8.97e-01 | -0.059 |
| 23367 | LARP1 | HTA11_866_3004761011 | Human | Colorectum | AD | 2.23e-05 | 5.24e-01 | 0.096 |
| 23367 | LARP1 | HTA11_7696_3000711011 | Human | Colorectum | AD | 7.17e-10 | 6.67e-01 | 0.0674 |
| 23367 | LARP1 | HTA11_6818_2000001021 | Human | Colorectum | AD | 2.68e-04 | 5.65e-01 | 0.0588 |
| 23367 | LARP1 | HTA11_99999970781_79442 | Human | Colorectum | MSS | 2.18e-03 | 5.42e-01 | 0.294 |
| 23367 | LARP1 | HTA11_99999965062_69753 | Human | Colorectum | MSI-H | 7.39e-04 | 9.34e-01 | 0.3487 |
| 23367 | LARP1 | HTA11_99999965104_69814 | Human | Colorectum | MSS | 2.86e-15 | 9.57e-01 | 0.281 |
| 23367 | LARP1 | HTA11_99999971662_82457 | Human | Colorectum | MSS | 8.25e-22 | 1.24e+00 | 0.3859 |
| 23367 | LARP1 | HTA11_99999973899_84307 | Human | Colorectum | MSS | 6.64e-08 | 8.32e-01 | 0.2585 |
| 23367 | LARP1 | HTA11_99999974143_84620 | Human | Colorectum | MSS | 1.71e-09 | 6.54e-01 | 0.3005 |
| 23367 | LARP1 | A002-C-010 | Human | Colorectum | FAP | 5.27e-04 | -2.20e-01 | 0.242 |
| 23367 | LARP1 | A001-C-207 | Human | Colorectum | FAP | 1.14e-02 | -2.28e-01 | 0.1278 |
| 23367 | LARP1 | A015-C-203 | Human | Colorectum | FAP | 1.03e-26 | -2.32e-01 | -0.1294 |
| 23367 | LARP1 | A015-C-204 | Human | Colorectum | FAP | 1.51e-04 | -4.75e-02 | -0.0228 |
| 23367 | LARP1 | A014-C-040 | Human | Colorectum | FAP | 1.13e-04 | -3.53e-01 | -0.1184 |
| 23367 | LARP1 | A002-C-201 | Human | Colorectum | FAP | 2.96e-11 | -9.23e-02 | 0.0324 |
| Page: 1 2 3 4 5 6 7 8 9 10 |
| Tissue | Expression Dynamics | Abbreviation |
| Colorectum (GSE201348) |  | FAP: Familial adenomatous polyposis |
| CRC: Colorectal cancer | ||
| Colorectum (HTA11) |  | AD: Adenomas |
| SER: Sessile serrated lesions | ||
| MSI-H: Microsatellite-high colorectal cancer | ||
| MSS: Microsatellite stable colorectal cancer | ||
| Endometrium | 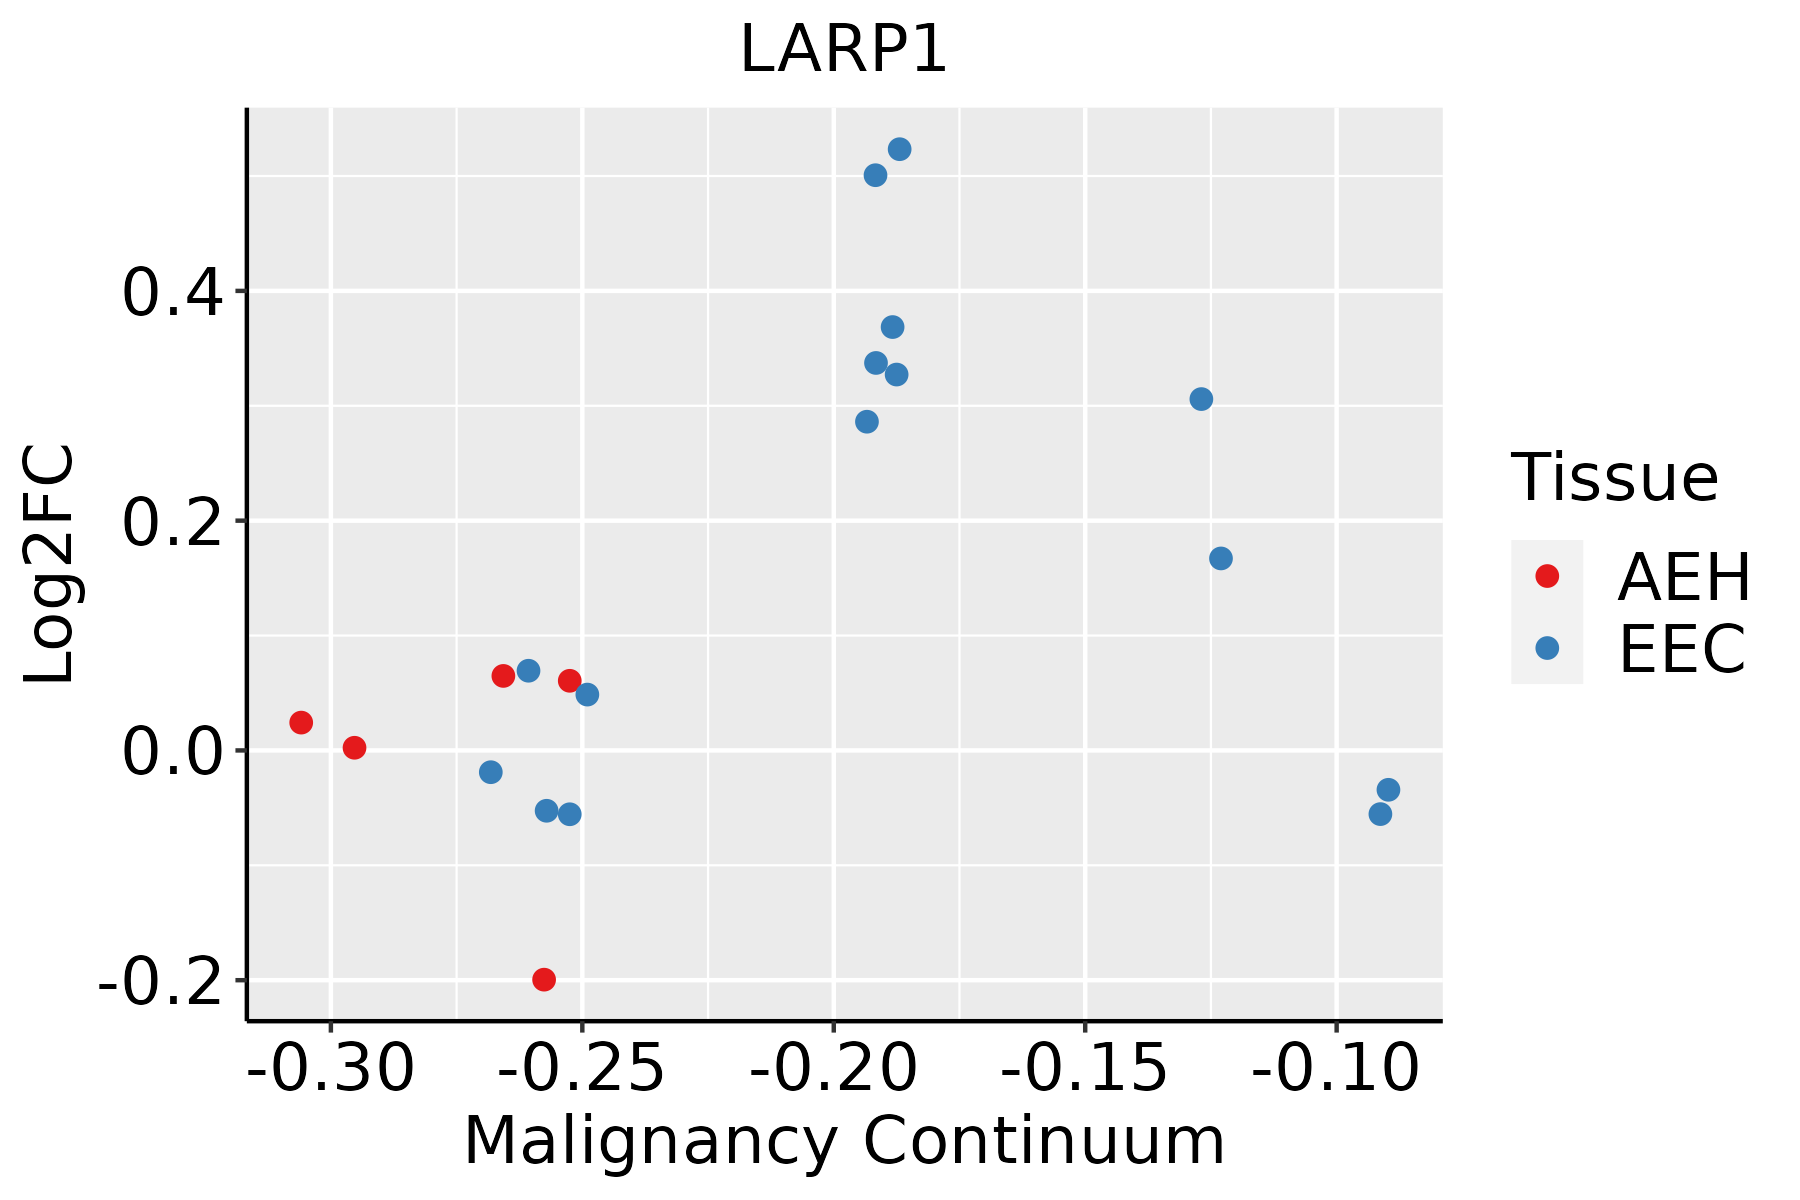 | AEH: Atypical endometrial hyperplasia |
| EEC: Endometrioid Cancer | ||
| Esophagus |  | ESCC: Esophageal squamous cell carcinoma |
| HGIN: High-grade intraepithelial neoplasias | ||
| LGIN: Low-grade intraepithelial neoplasias | ||
| Liver | 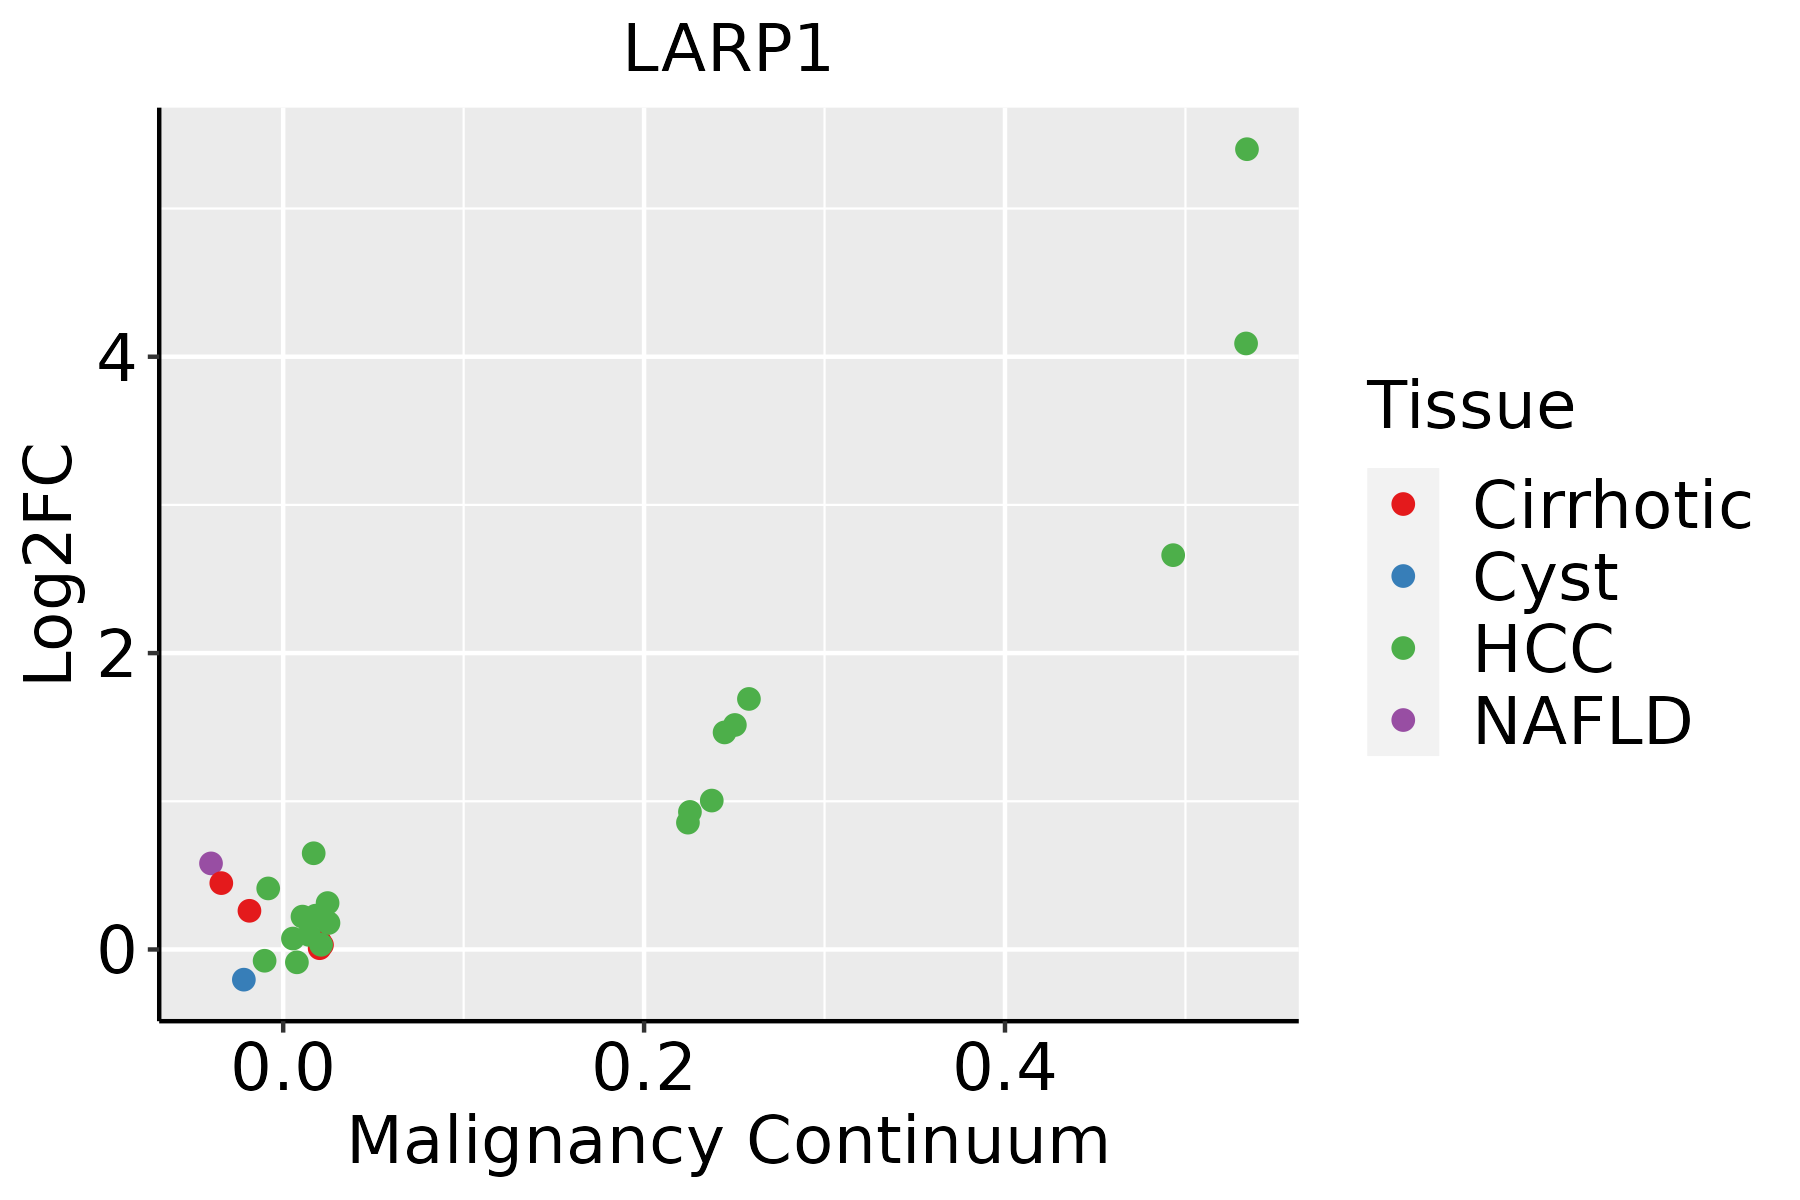 | HCC: Hepatocellular carcinoma |
| NAFLD: Non-alcoholic fatty liver disease | ||
| Oral Cavity | 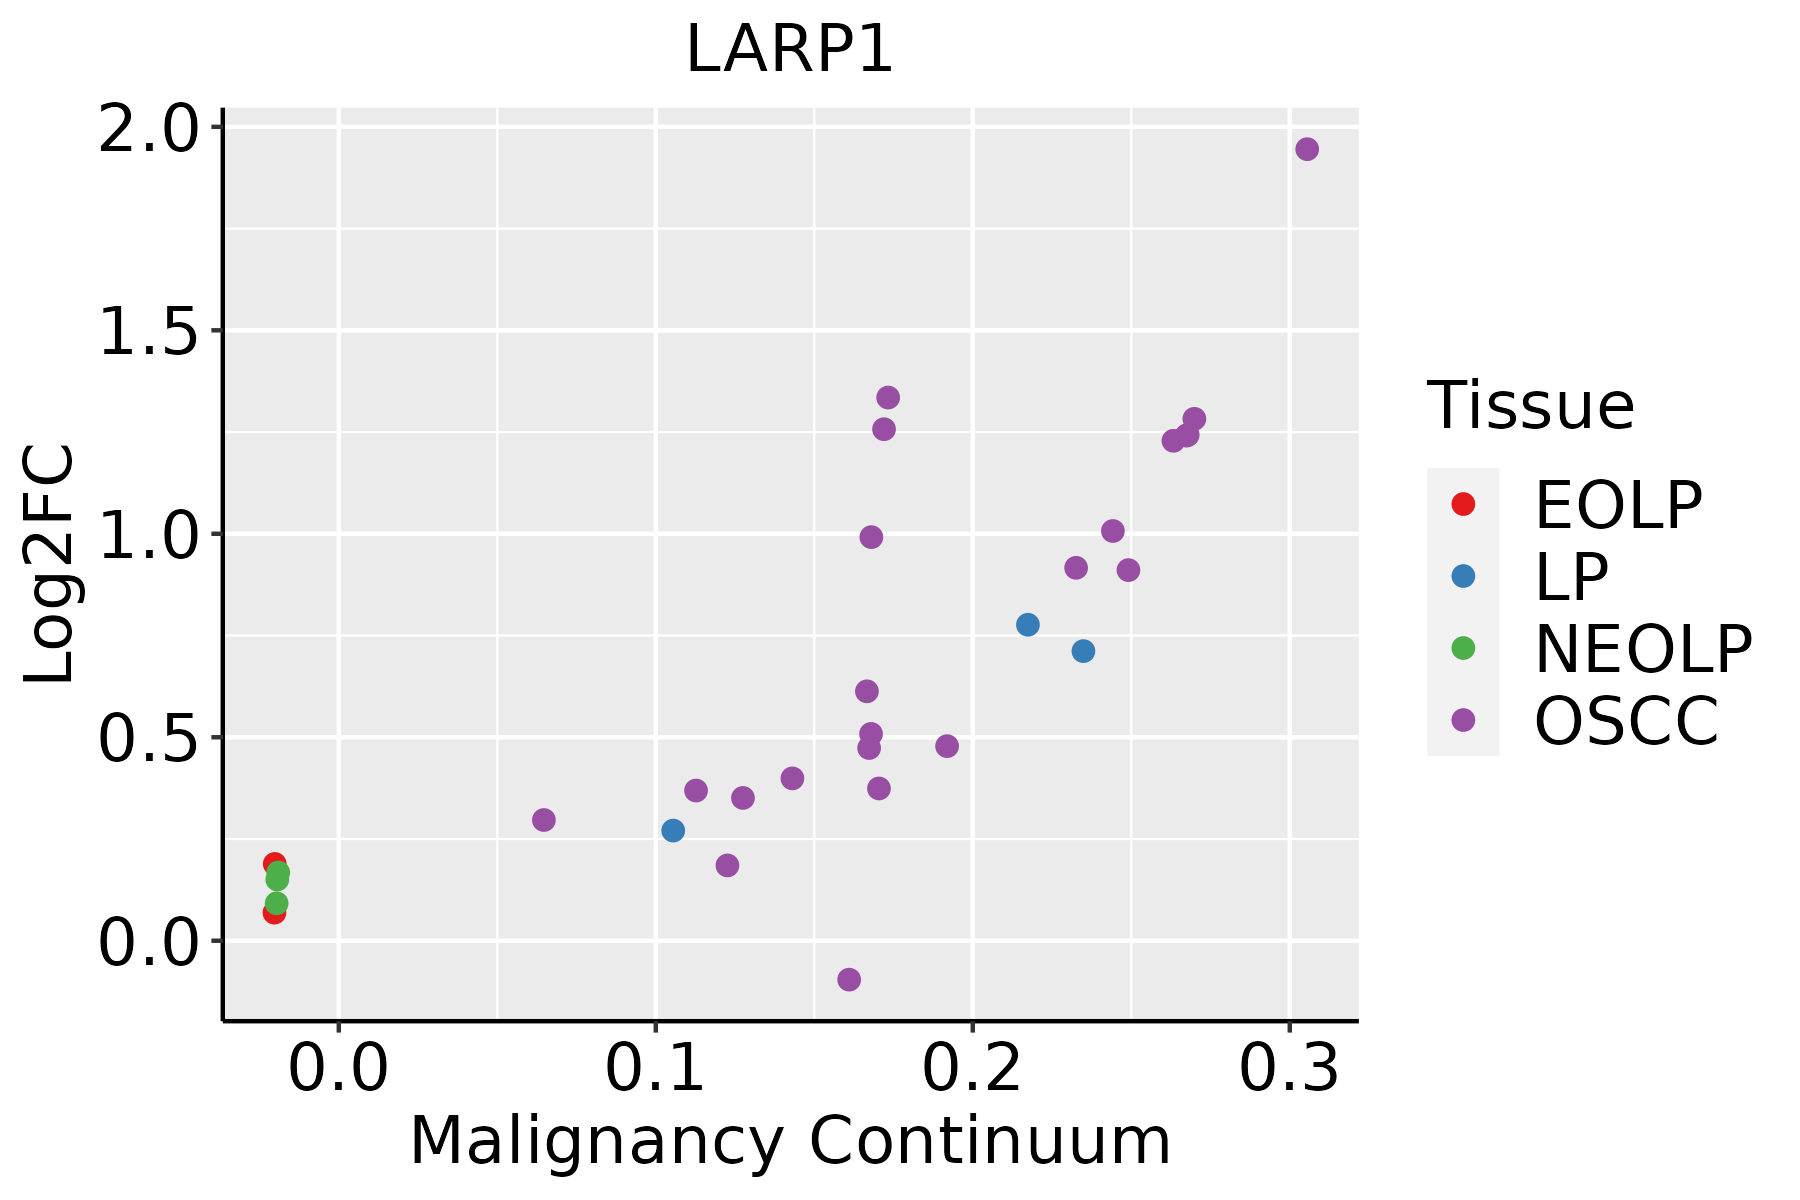 | EOLP: Erosive Oral lichen planus |
| LP: leukoplakia | ||
| NEOLP: Non-erosive oral lichen planus | ||
| OSCC: Oral squamous cell carcinoma | ||
| Prostate | 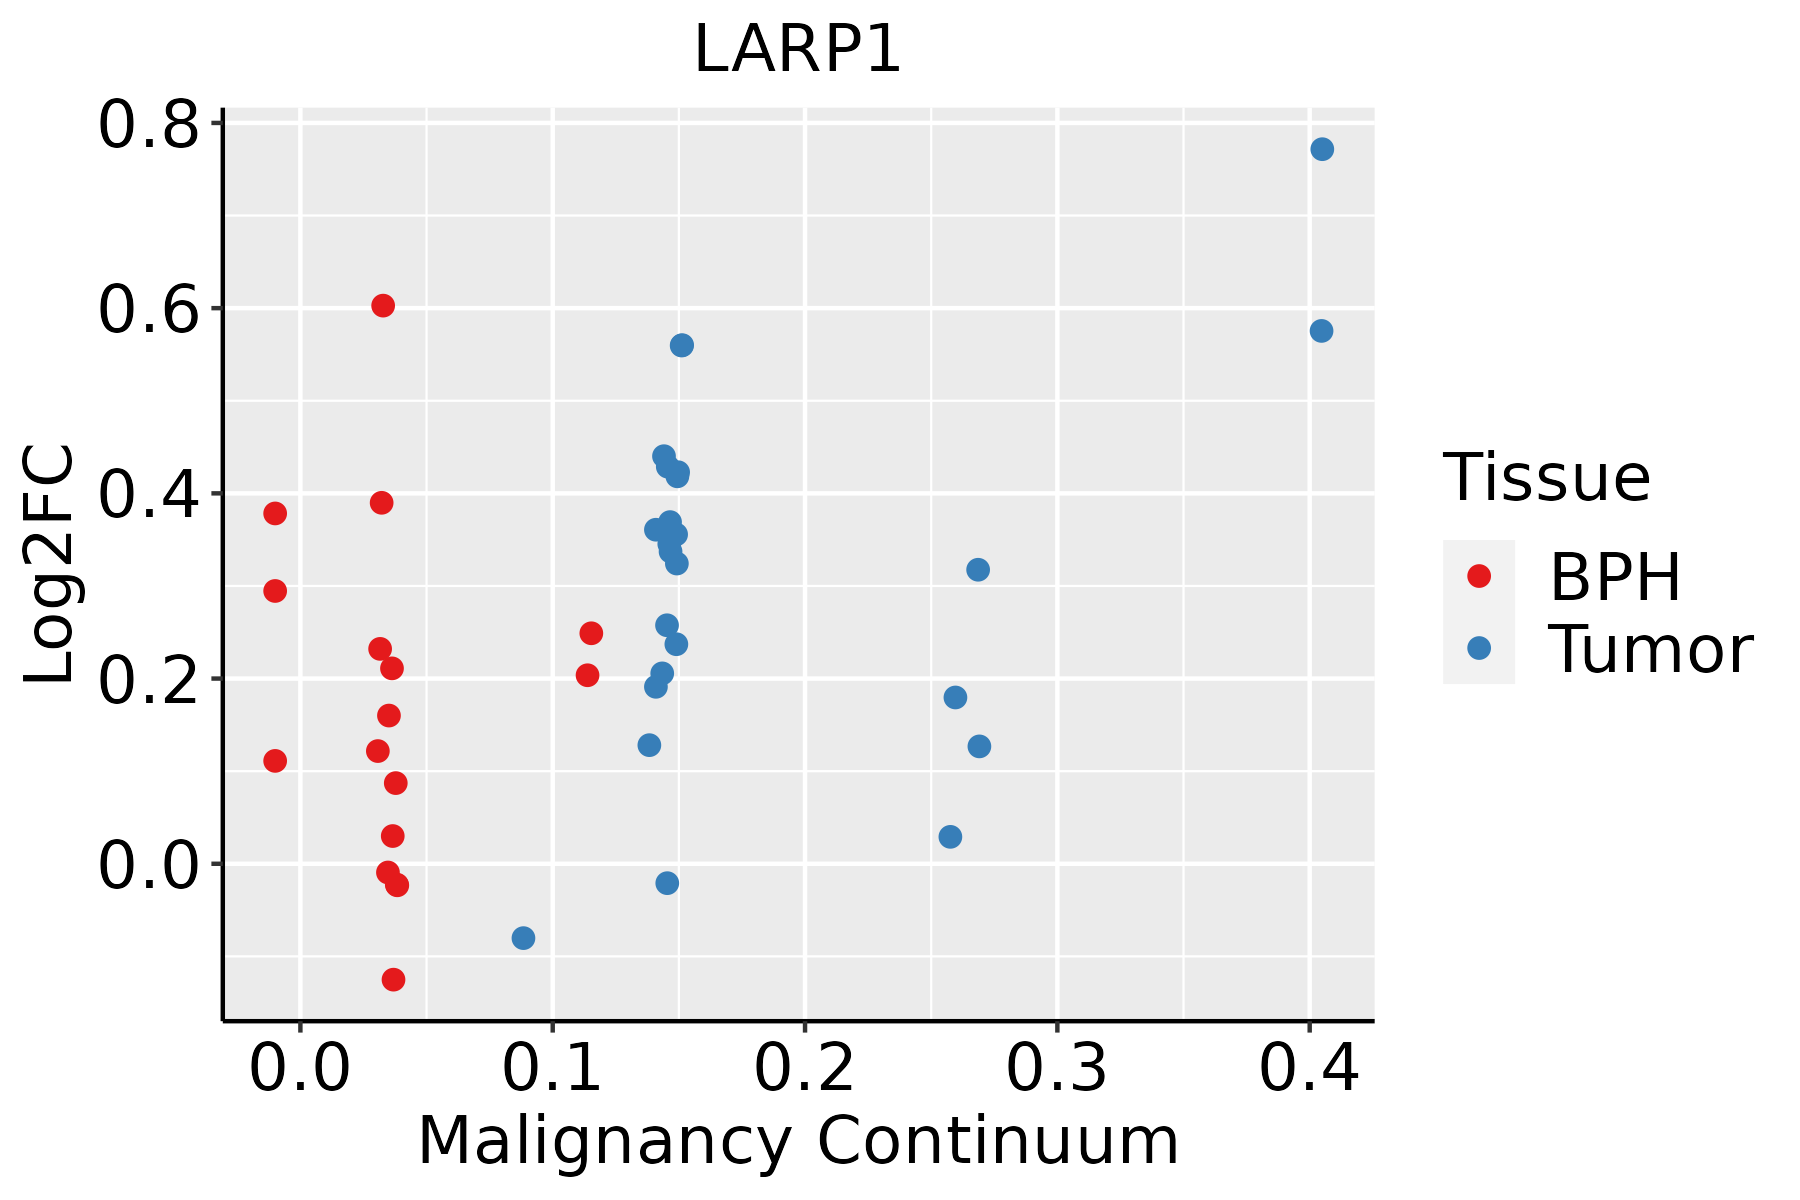 | BPH: Benign Prostatic Hyperplasia |
| Skin |  | AK: Actinic keratosis |
| cSCC: Cutaneous squamous cell carcinoma | ||
| SCCIS:squamous cell carcinoma in situ | ||
| Thyroid |  | ATC: Anaplastic thyroid cancer |
| HT: Hashimoto's thyroiditis | ||
| PTC: Papillary thyroid cancer |
| ∗log2FC in expression of this searched gene in stem-like cells from each diseased tissue sample relative to stem-like cells in normal samples in each tissue plotted against the malignancy continuum. Samples are colored based on if they are from different disease stage. |
Top |
Malignant transformation related pathway analysis |
| Find out the enriched GO biological processes and KEGG pathways involved in transition from healthy to precancer to cancer |
| Tissue | Disease Stage | Enriched GO biological Processes |
| Colorectum | AD |  |
| Colorectum | SER |  |
| Colorectum | MSS |  |
| Colorectum | MSI-H |  |
| Colorectum | FAP |  |
| ∗Top 15 enriched GO BP terms are showed in the bar plot of each disease state in each tissue. Each row represents a significant GO biological process which is colored according to the -log10(p.adjust). |
| Page: 1 2 3 4 5 6 7 8 9 |
| GO ID | Tissue | Disease Stage | Description | Gene Ratio | Bg Ratio | pvalue | p.adjust | Count |
| GO:0016032 | Colorectum | AD | viral process | 168/3918 | 415/18723 | 4.67e-20 | 3.66e-17 | 168 |
| GO:0009896 | Colorectum | AD | positive regulation of catabolic process | 180/3918 | 492/18723 | 4.33e-16 | 1.94e-13 | 180 |
| GO:1903311 | Colorectum | AD | regulation of mRNA metabolic process | 117/3918 | 288/18723 | 1.69e-14 | 4.23e-12 | 117 |
| GO:0031331 | Colorectum | AD | positive regulation of cellular catabolic process | 156/3918 | 427/18723 | 4.68e-14 | 1.05e-11 | 156 |
| GO:0009895 | Colorectum | AD | negative regulation of catabolic process | 124/3918 | 320/18723 | 1.66e-13 | 3.35e-11 | 124 |
| GO:0031330 | Colorectum | AD | negative regulation of cellular catabolic process | 104/3918 | 262/18723 | 2.66e-12 | 3.96e-10 | 104 |
| GO:0019058 | Colorectum | AD | viral life cycle | 119/3918 | 317/18723 | 6.18e-12 | 8.23e-10 | 119 |
| GO:0006401 | Colorectum | AD | RNA catabolic process | 102/3918 | 278/18723 | 8.64e-10 | 6.76e-08 | 102 |
| GO:0044270 | Colorectum | AD | cellular nitrogen compound catabolic process | 147/3918 | 451/18723 | 3.35e-09 | 2.23e-07 | 147 |
| GO:0010506 | Colorectum | AD | regulation of autophagy | 111/3918 | 317/18723 | 3.57e-09 | 2.35e-07 | 111 |
| GO:0046700 | Colorectum | AD | heterocycle catabolic process | 145/3918 | 445/18723 | 4.37e-09 | 2.84e-07 | 145 |
| GO:0006402 | Colorectum | AD | mRNA catabolic process | 87/3918 | 232/18723 | 4.40e-09 | 2.84e-07 | 87 |
| GO:0016236 | Colorectum | AD | macroautophagy | 103/3918 | 291/18723 | 6.76e-09 | 4.15e-07 | 103 |
| GO:0034655 | Colorectum | AD | nucleobase-containing compound catabolic process | 133/3918 | 407/18723 | 1.56e-08 | 9.12e-07 | 133 |
| GO:0019439 | Colorectum | AD | aromatic compound catabolic process | 146/3918 | 467/18723 | 7.48e-08 | 3.84e-06 | 146 |
| GO:1901361 | Colorectum | AD | organic cyclic compound catabolic process | 153/3918 | 495/18723 | 8.23e-08 | 4.18e-06 | 153 |
| GO:0061013 | Colorectum | AD | regulation of mRNA catabolic process | 64/3918 | 166/18723 | 1.44e-07 | 6.59e-06 | 64 |
| GO:0043487 | Colorectum | AD | regulation of RNA stability | 63/3918 | 170/18723 | 9.17e-07 | 3.12e-05 | 63 |
| GO:0006417 | Colorectum | AD | regulation of translation | 141/3918 | 468/18723 | 1.32e-06 | 4.22e-05 | 141 |
| GO:0048524 | Colorectum | AD | positive regulation of viral process | 31/3918 | 65/18723 | 1.33e-06 | 4.23e-05 | 31 |
| Page: 1 2 3 4 5 6 7 8 9 10 11 12 13 14 15 16 17 18 19 20 21 22 23 24 25 26 27 28 29 30 31 32 33 34 35 36 37 38 39 |
| Pathway ID | Tissue | Disease Stage | Description | Gene Ratio | Bg Ratio | pvalue | p.adjust | qvalue | Count |
| Page: 1 |
Top |
Cell-cell communication analysis |
| Identification of potential cell-cell interactions between two cell types and their ligand-receptor pairs for different disease states |
| Ligand | Receptor | LRpair | Pathway | Tissue | Disease Stage |
| Page: 1 |
Top |
Single-cell gene regulatory network inference analysis |
| Find out the significant the regulons (TFs) and the target genes of each regulon across cell types for different disease states |
| TF | Cell Type | Tissue | Disease Stage | Target Gene | RSS | Regulon Activity |
| LARP1 | MSC.SEC | Liver | Cirrhotic | EXOC6,GNA14,NDUFAF2, etc. | 2.78e-01 |  |
| LARP1 | MSC.SEC | Liver | Healthy | EXOC6,GNA14,NDUFAF2, etc. | 6.14e-01 |  |
| LARP1 | MSC.SEC | Liver | NAFLD | EXOC6,GNA14,NDUFAF2, etc. | 5.48e-01 |  |
| ∗The dot plots of a searched regulon are shown for all cell subpopulations in each disease state of each tissue based on the regulon specific score inferred using pySCENIC and by calculating the average expression. |
| Page: 1 |
Top |
Somatic mutation of malignant transformation related genes |
| Annotation of somatic variants for genes involved in malignant transformation |
| Hugo Symbol | Variant Class | Variant Classification | dbSNP RS | HGVSc | HGVSp | HGVSp Short | SWISSPROT | BIOTYPE | SIFT | PolyPhen | Tumor Sample Barcode | Tissue | Histology | Sex | Age | Stage | Therapy Types | Drugs | Outcome |
| LARP1 | SNV | Missense_Mutation | novel | c.1336N>T | p.Arg446Cys | p.R446C | Q6PKG0 | protein_coding | deleterious(0.01) | possibly_damaging(0.707) | TCGA-5L-AAT1-01 | Breast | breast invasive carcinoma | Female | <65 | III/IV | Hormone Therapy | letrozol | SD |
| LARP1 | SNV | Missense_Mutation | c.2636N>T | p.Arg879Leu | p.R879L | Q6PKG0 | protein_coding | deleterious(0.01) | probably_damaging(0.991) | TCGA-A2-A25A-01 | Breast | breast invasive carcinoma | Female | <65 | I/II | Unspecific | Cytoxan | SD | |
| LARP1 | SNV | Missense_Mutation | c.2360N>T | p.Cys787Phe | p.C787F | Q6PKG0 | protein_coding | deleterious(0) | probably_damaging(0.947) | TCGA-A8-A094-01 | Breast | breast invasive carcinoma | Female | >=65 | I/II | Unknown | Unknown | SD | |
| LARP1 | SNV | Missense_Mutation | c.498N>C | p.Gln166His | p.Q166H | Q6PKG0 | protein_coding | tolerated(0.06) | benign(0.048) | TCGA-AC-A23H-01 | Breast | breast invasive carcinoma | Female | >=65 | I/II | Unknown | Unknown | PD | |
| LARP1 | SNV | Missense_Mutation | c.1789N>A | p.Glu597Lys | p.E597K | Q6PKG0 | protein_coding | deleterious(0) | probably_damaging(0.968) | TCGA-AN-A046-01 | Breast | breast invasive carcinoma | Female | >=65 | I/II | Unknown | Unknown | SD | |
| LARP1 | SNV | Missense_Mutation | rs775862354 | c.253C>T | p.Arg85Cys | p.R85C | Q6PKG0 | protein_coding | deleterious(0) | possibly_damaging(0.809) | TCGA-AN-A0AK-01 | Breast | breast invasive carcinoma | Female | >=65 | I/II | Unknown | Unknown | SD |
| LARP1 | SNV | Missense_Mutation | c.1676N>T | p.Asp559Val | p.D559V | Q6PKG0 | protein_coding | deleterious(0) | probably_damaging(0.974) | TCGA-C8-A12M-01 | Breast | breast invasive carcinoma | Female | >=65 | I/II | Unknown | Unknown | SD | |
| LARP1 | SNV | Missense_Mutation | novel | c.238N>A | p.Ala80Thr | p.A80T | Q6PKG0 | protein_coding | tolerated(0.08) | possibly_damaging(0.677) | TCGA-E2-A574-01 | Breast | breast invasive carcinoma | Female | <65 | I/II | Chemotherapy | adriamycin | SD |
| LARP1 | insertion | Nonsense_Mutation | novel | c.768_769insTGAAGTC | p.Arg257Ter | p.R257* | Q6PKG0 | protein_coding | TCGA-A8-A09G-01 | Breast | breast invasive carcinoma | Female | >=65 | III/IV | Unknown | Unknown | SD | ||
| LARP1 | insertion | Frame_Shift_Ins | novel | c.815_816insCCCAGAGAGAAACTGGCTTC | p.Arg273ProfsTer38 | p.R273Pfs*38 | Q6PKG0 | protein_coding | TCGA-A8-A0A4-01 | Breast | breast invasive carcinoma | Female | >=65 | I/II | Hormone Therapy | tamoxiphen | CR |
| Page: 1 2 3 4 5 6 7 8 9 10 11 12 13 14 |
Top |
Related drugs of malignant transformation related genes |
| Identification of chemicals and drugs interact with genes involved in malignant transfromation |
| (DGIdb 4.0) |
| Entrez ID | Symbol | Category | Interaction Types | Drug Claim Name | Drug Name | PMIDs |
| Page: 1 |

Copyright 2023-Present -The University of Texas Health Science Center at Houston |