
|
|||||
|
 | |
| |
| |
| |
| |
| |
|
Gene: LARGE2 |
Gene summary for LARGE2 |
| Gene information | Species | Human | Gene symbol | LARGE2 | Gene ID | 120071 |
| Gene name | LARGE xylosyl- and glucuronyltransferase 2 | |
| Gene Alias | GYLTL1B | |
| Cytomap | 11p11.2 | |
| Gene Type | protein-coding | GO ID | GO:0006464 | UniProtAcc | Q8N3Y3 |
Top |
Malignant transformation analysis |
| Identification of the aberrant gene expression in precancerous and cancerous lesions by comparing the gene expression of stem-like cells in diseased tissues with normal stem cells |
| Entrez ID | Symbol | Replicates | Species | Organ | Tissue | Adj P-value | Log2FC | Malignancy |
| 120071 | LARGE2 | HTA11_866_3004761011 | Human | Colorectum | AD | 4.01e-07 | 2.06e-01 | 0.096 |
| 120071 | LARGE2 | HTA11_7696_3000711011 | Human | Colorectum | AD | 1.11e-09 | 2.73e-01 | 0.0674 |
| 120071 | LARGE2 | HTA11_99999970781_79442 | Human | Colorectum | MSS | 1.53e-19 | 4.00e-01 | 0.294 |
| 120071 | LARGE2 | HTA11_99999971662_82457 | Human | Colorectum | MSS | 5.00e-24 | 6.02e-01 | 0.3859 |
| 120071 | LARGE2 | HTA11_99999973899_84307 | Human | Colorectum | MSS | 4.19e-14 | 5.41e-01 | 0.2585 |
| 120071 | LARGE2 | HTA11_99999974143_84620 | Human | Colorectum | MSS | 2.98e-27 | 5.90e-01 | 0.3005 |
| 120071 | LARGE2 | S014 | Human | Liver | HCC | 1.24e-36 | 1.08e+00 | 0.2254 |
| 120071 | LARGE2 | S015 | Human | Liver | HCC | 1.81e-34 | 1.29e+00 | 0.2375 |
| 120071 | LARGE2 | S016 | Human | Liver | HCC | 1.32e-57 | 1.70e+00 | 0.2243 |
| Page: 1 |
| Tissue | Expression Dynamics | Abbreviation |
| Colorectum (GSE201348) |  | FAP: Familial adenomatous polyposis |
| CRC: Colorectal cancer | ||
| Colorectum (HTA11) |  | AD: Adenomas |
| SER: Sessile serrated lesions | ||
| MSI-H: Microsatellite-high colorectal cancer | ||
| MSS: Microsatellite stable colorectal cancer | ||
| Liver | 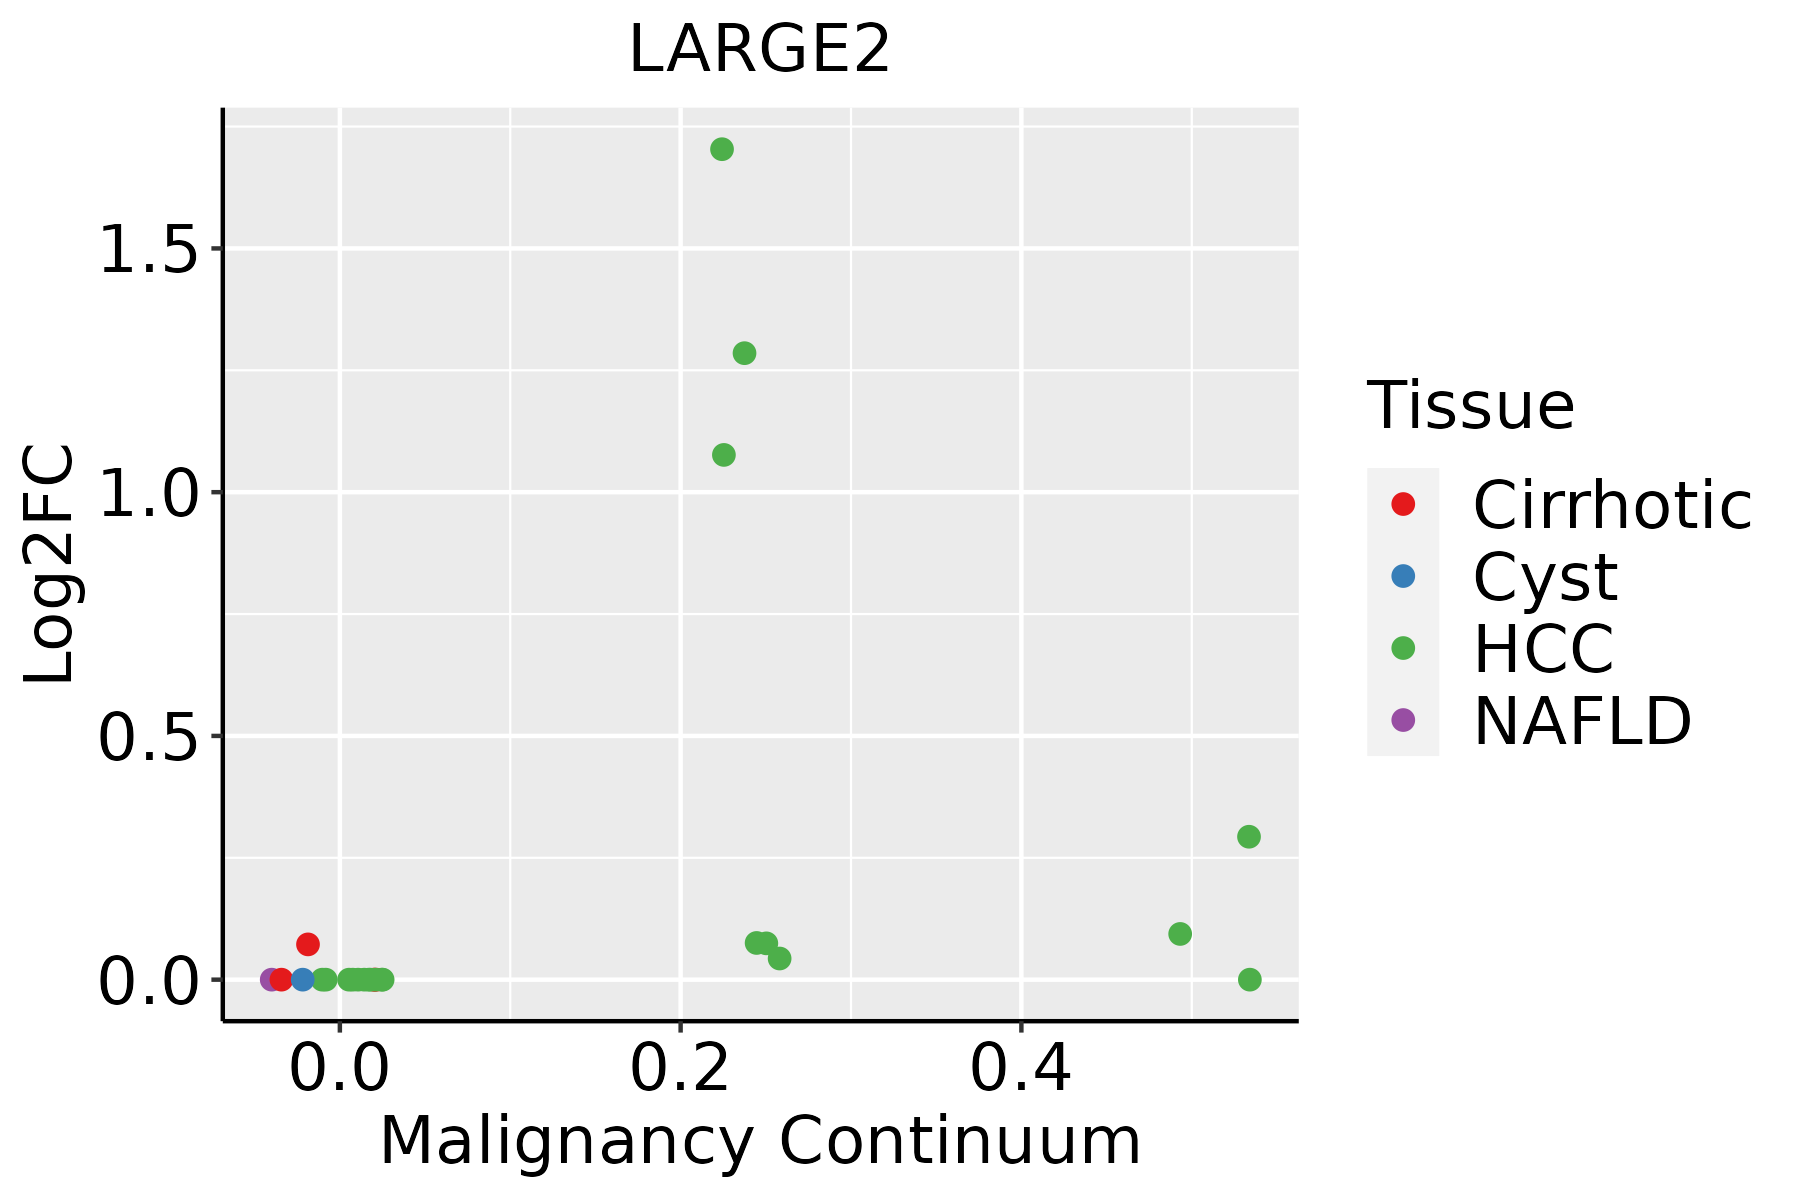 | HCC: Hepatocellular carcinoma |
| NAFLD: Non-alcoholic fatty liver disease |
| ∗log2FC in expression of this searched gene in stem-like cells from each diseased tissue sample relative to stem-like cells in normal samples in each tissue plotted against the malignancy continuum. Samples are colored based on if they are from different disease stage. |
Top |
Malignant transformation related pathway analysis |
| Find out the enriched GO biological processes and KEGG pathways involved in transition from healthy to precancer to cancer |
| Tissue | Disease Stage | Enriched GO biological Processes |
| Colorectum | AD |  |
| Colorectum | SER |  |
| Colorectum | MSS |  |
| Colorectum | MSI-H |  |
| Colorectum | FAP |  |
| ∗Top 15 enriched GO BP terms are showed in the bar plot of each disease state in each tissue. Each row represents a significant GO biological process which is colored according to the -log10(p.adjust). |
| Page: 1 2 3 4 5 6 7 8 9 |
| GO ID | Tissue | Disease Stage | Description | Gene Ratio | Bg Ratio | pvalue | p.adjust | Count |
| GO:0060249 | Colorectum | AD | anatomical structure homeostasis | 94/3918 | 314/18723 | 9.37e-05 | 1.42e-03 | 94 |
| GO:0006486 | Colorectum | AD | protein glycosylation | 64/3918 | 226/18723 | 4.86e-03 | 3.27e-02 | 64 |
| GO:0043413 | Colorectum | AD | macromolecule glycosylation | 64/3918 | 226/18723 | 4.86e-03 | 3.27e-02 | 64 |
| GO:0070085 | Colorectum | AD | glycosylation | 67/3918 | 240/18723 | 5.78e-03 | 3.67e-02 | 67 |
| GO:00602492 | Colorectum | MSS | anatomical structure homeostasis | 84/3467 | 314/18723 | 1.87e-04 | 2.64e-03 | 84 |
| GO:0046716 | Colorectum | MSS | muscle cell cellular homeostasis | 9/3467 | 19/18723 | 3.88e-03 | 2.83e-02 | 9 |
| GO:00064862 | Liver | HCC | protein glycosylation | 122/7958 | 226/18723 | 3.11e-04 | 2.21e-03 | 122 |
| GO:00434132 | Liver | HCC | macromolecule glycosylation | 122/7958 | 226/18723 | 3.11e-04 | 2.21e-03 | 122 |
| GO:00700852 | Liver | HCC | glycosylation | 128/7958 | 240/18723 | 4.35e-04 | 2.92e-03 | 128 |
| GO:0009100 | Liver | HCC | glycoprotein metabolic process | 193/7958 | 387/18723 | 1.89e-03 | 9.62e-03 | 193 |
| Page: 1 |
| Pathway ID | Tissue | Disease Stage | Description | Gene Ratio | Bg Ratio | pvalue | p.adjust | qvalue | Count |
| Page: 1 |
Top |
Cell-cell communication analysis |
| Identification of potential cell-cell interactions between two cell types and their ligand-receptor pairs for different disease states |
| Ligand | Receptor | LRpair | Pathway | Tissue | Disease Stage |
| Page: 1 |
Top |
Single-cell gene regulatory network inference analysis |
| Find out the significant the regulons (TFs) and the target genes of each regulon across cell types for different disease states |
| TF | Cell Type | Tissue | Disease Stage | Target Gene | RSS | Regulon Activity |
| ∗The dot plots of a searched regulon are shown for all cell subpopulations in each disease state of each tissue based on the regulon specific score inferred using pySCENIC and by calculating the average expression. |
| Page: 1 |
Top |
Somatic mutation of malignant transformation related genes |
| Annotation of somatic variants for genes involved in malignant transformation |
| Hugo Symbol | Variant Class | Variant Classification | dbSNP RS | HGVSc | HGVSp | HGVSp Short | SWISSPROT | BIOTYPE | SIFT | PolyPhen | Tumor Sample Barcode | Tissue | Histology | Sex | Age | Stage | Therapy Types | Drugs | Outcome |
| LARGE2 | SNV | Missense_Mutation | c.1065N>G | p.Phe355Leu | p.F355L | Q8N3Y3 | protein_coding | tolerated(0.18) | benign(0.003) | TCGA-A2-A0CL-01 | Breast | breast invasive carcinoma | Female | <65 | III/IV | Chemotherapy | cytoxan | SD | |
| LARGE2 | SNV | Missense_Mutation | novel | c.1849N>A | p.Glu617Lys | p.E617K | Q8N3Y3 | protein_coding | deleterious(0) | probably_damaging(0.998) | TCGA-A8-A08H-01 | Breast | breast invasive carcinoma | Female | >=65 | I/II | Unknown | Unknown | SD |
| LARGE2 | SNV | Missense_Mutation | c.318N>G | p.His106Gln | p.H106Q | Q8N3Y3 | protein_coding | tolerated(0.05) | benign(0.014) | TCGA-B6-A0RT-01 | Breast | breast invasive carcinoma | Female | <65 | III/IV | Unknown | Unknown | SD | |
| LARGE2 | SNV | Missense_Mutation | rs776969558 | c.773N>G | p.Val258Gly | p.V258G | Q8N3Y3 | protein_coding | deleterious(0.01) | probably_damaging(0.999) | TCGA-E9-A22A-01 | Breast | breast invasive carcinoma | Female | >=65 | I/II | Hormone Therapy | tamoxiphen | SD |
| LARGE2 | SNV | Missense_Mutation | rs568405351 | c.1241N>A | p.Arg414His | p.R414H | Q8N3Y3 | protein_coding | deleterious(0) | probably_damaging(0.995) | TCGA-LL-A7T0-01 | Breast | breast invasive carcinoma | Female | >=65 | I/II | Unknown | Unknown | SD |
| LARGE2 | SNV | Missense_Mutation | novel | c.444N>C | p.Trp148Cys | p.W148C | Q8N3Y3 | protein_coding | deleterious(0) | probably_damaging(1) | TCGA-S3-AA17-01 | Breast | breast invasive carcinoma | Female | <65 | I/II | Hormone Therapy | anastrozole | SD |
| LARGE2 | deletion | Frame_Shift_Del | c.357delN | p.Met119IlefsTer14 | p.M119Ifs*14 | Q8N3Y3 | protein_coding | TCGA-A2-A0D1-01 | Breast | breast invasive carcinoma | Female | >=65 | I/II | Chemotherapy | taxotere | SD | |||
| LARGE2 | deletion | Frame_Shift_Del | novel | c.2053delN | p.Cys685AlafsTer64 | p.C685Afs*64 | Q8N3Y3 | protein_coding | TCGA-D8-A27V-01 | Breast | breast invasive carcinoma | Female | <65 | I/II | Hormone Therapy | tamoxiphen | SD | ||
| LARGE2 | SNV | Missense_Mutation | rs766946014 | c.841N>T | p.Arg281Trp | p.R281W | Q8N3Y3 | protein_coding | deleterious(0.01) | possibly_damaging(0.901) | TCGA-2W-A8YY-01 | Cervix | cervical & endocervical cancer | Female | <65 | I/II | Chemotherapy | cisplatin | CR |
| LARGE2 | SNV | Missense_Mutation | novel | c.1364N>A | p.Gly455Asp | p.G455D | Q8N3Y3 | protein_coding | deleterious(0) | possibly_damaging(0.833) | TCGA-2W-A8YY-01 | Cervix | cervical & endocervical cancer | Female | <65 | I/II | Chemotherapy | cisplatin | CR |
| Page: 1 2 3 4 5 6 7 |
Top |
Related drugs of malignant transformation related genes |
| Identification of chemicals and drugs interact with genes involved in malignant transfromation |
| (DGIdb 4.0) |
| Entrez ID | Symbol | Category | Interaction Types | Drug Claim Name | Drug Name | PMIDs |
| Page: 1 |

Copyright 2023-Present -The University of Texas Health Science Center at Houston |