| Tissue | Expression Dynamics | Abbreviation |
| Cervix | 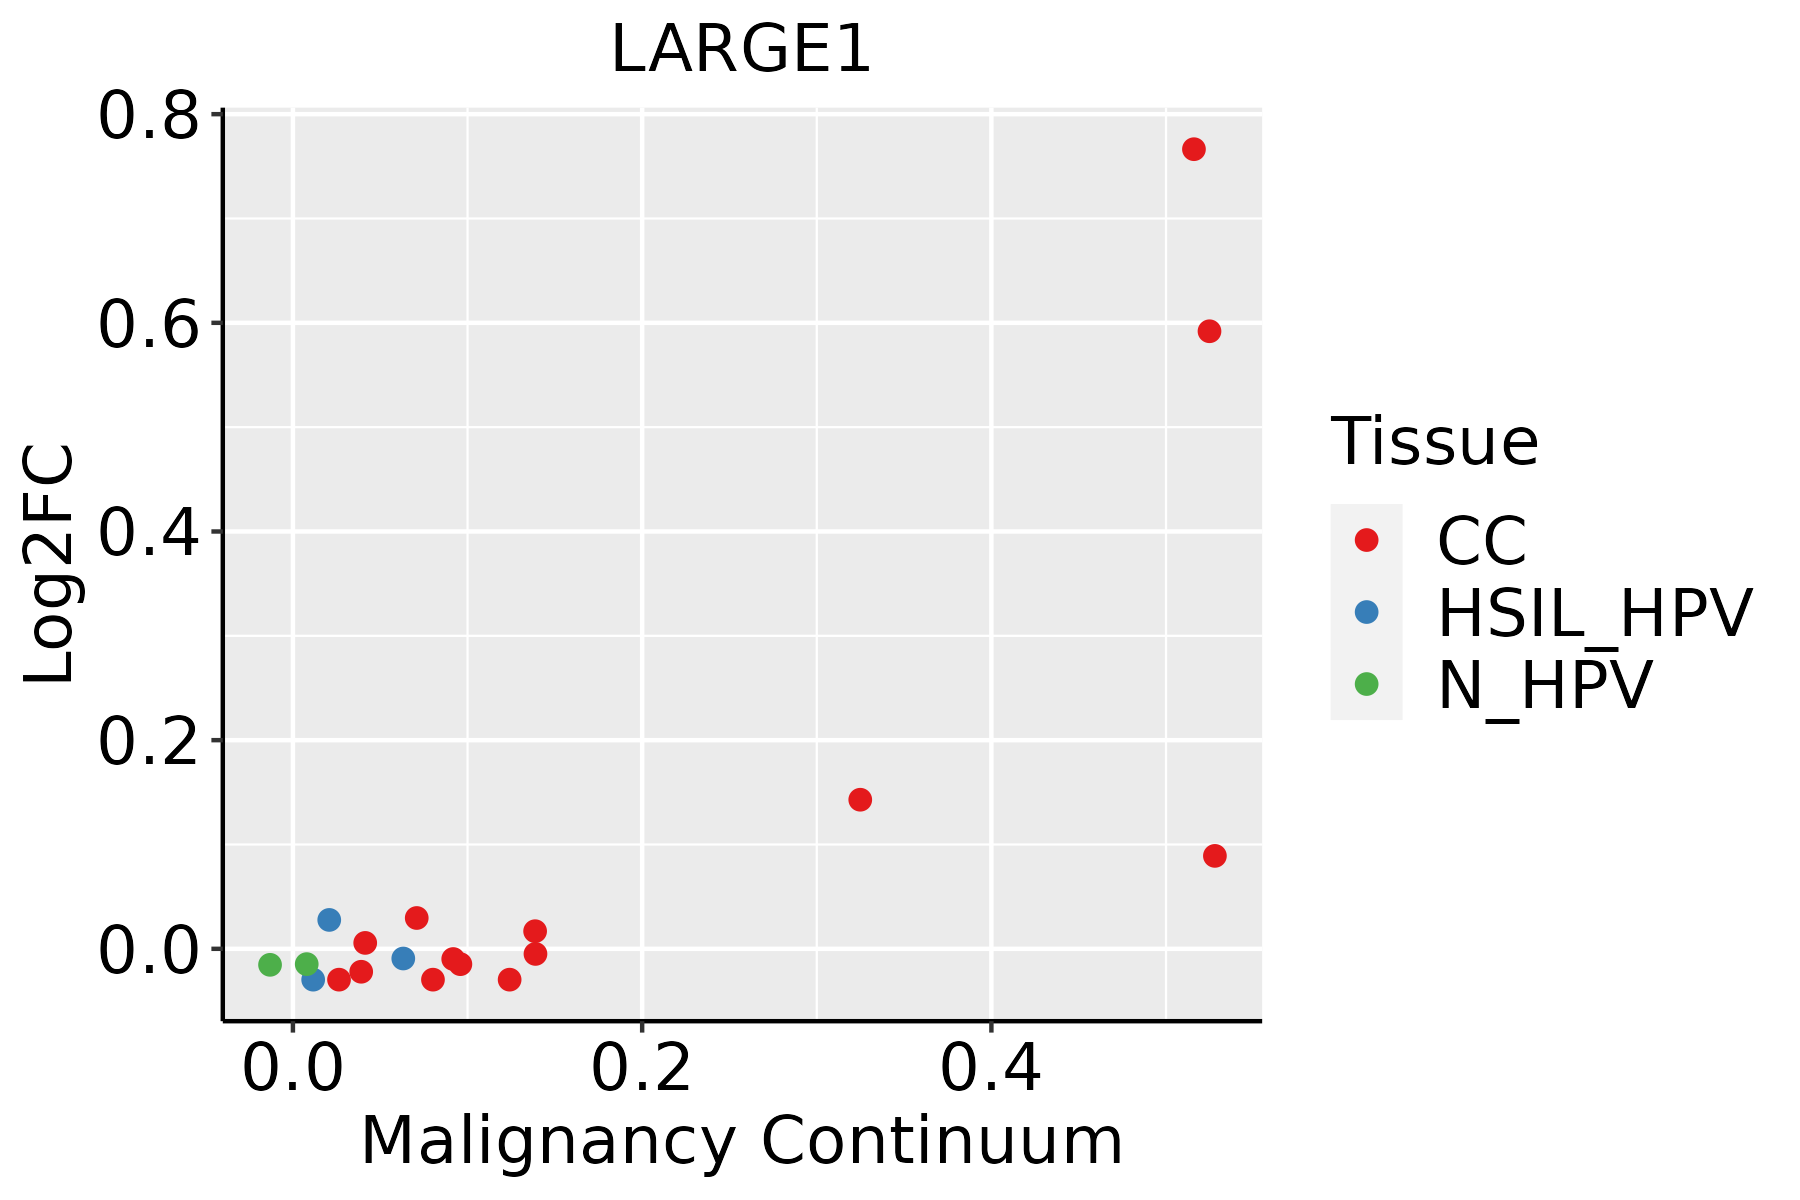 | CC: Cervix cancer |
| HSIL_HPV: HPV-infected high-grade squamous intraepithelial lesions |
| N_HPV: HPV-infected normal cervix |
| Colorectum (GSE201348) |  | FAP: Familial adenomatous polyposis |
| CRC: Colorectal cancer |
| Colorectum (HTA11) |  | AD: Adenomas |
| SER: Sessile serrated lesions |
| MSI-H: Microsatellite-high colorectal cancer |
| MSS: Microsatellite stable colorectal cancer |
| Endometrium | 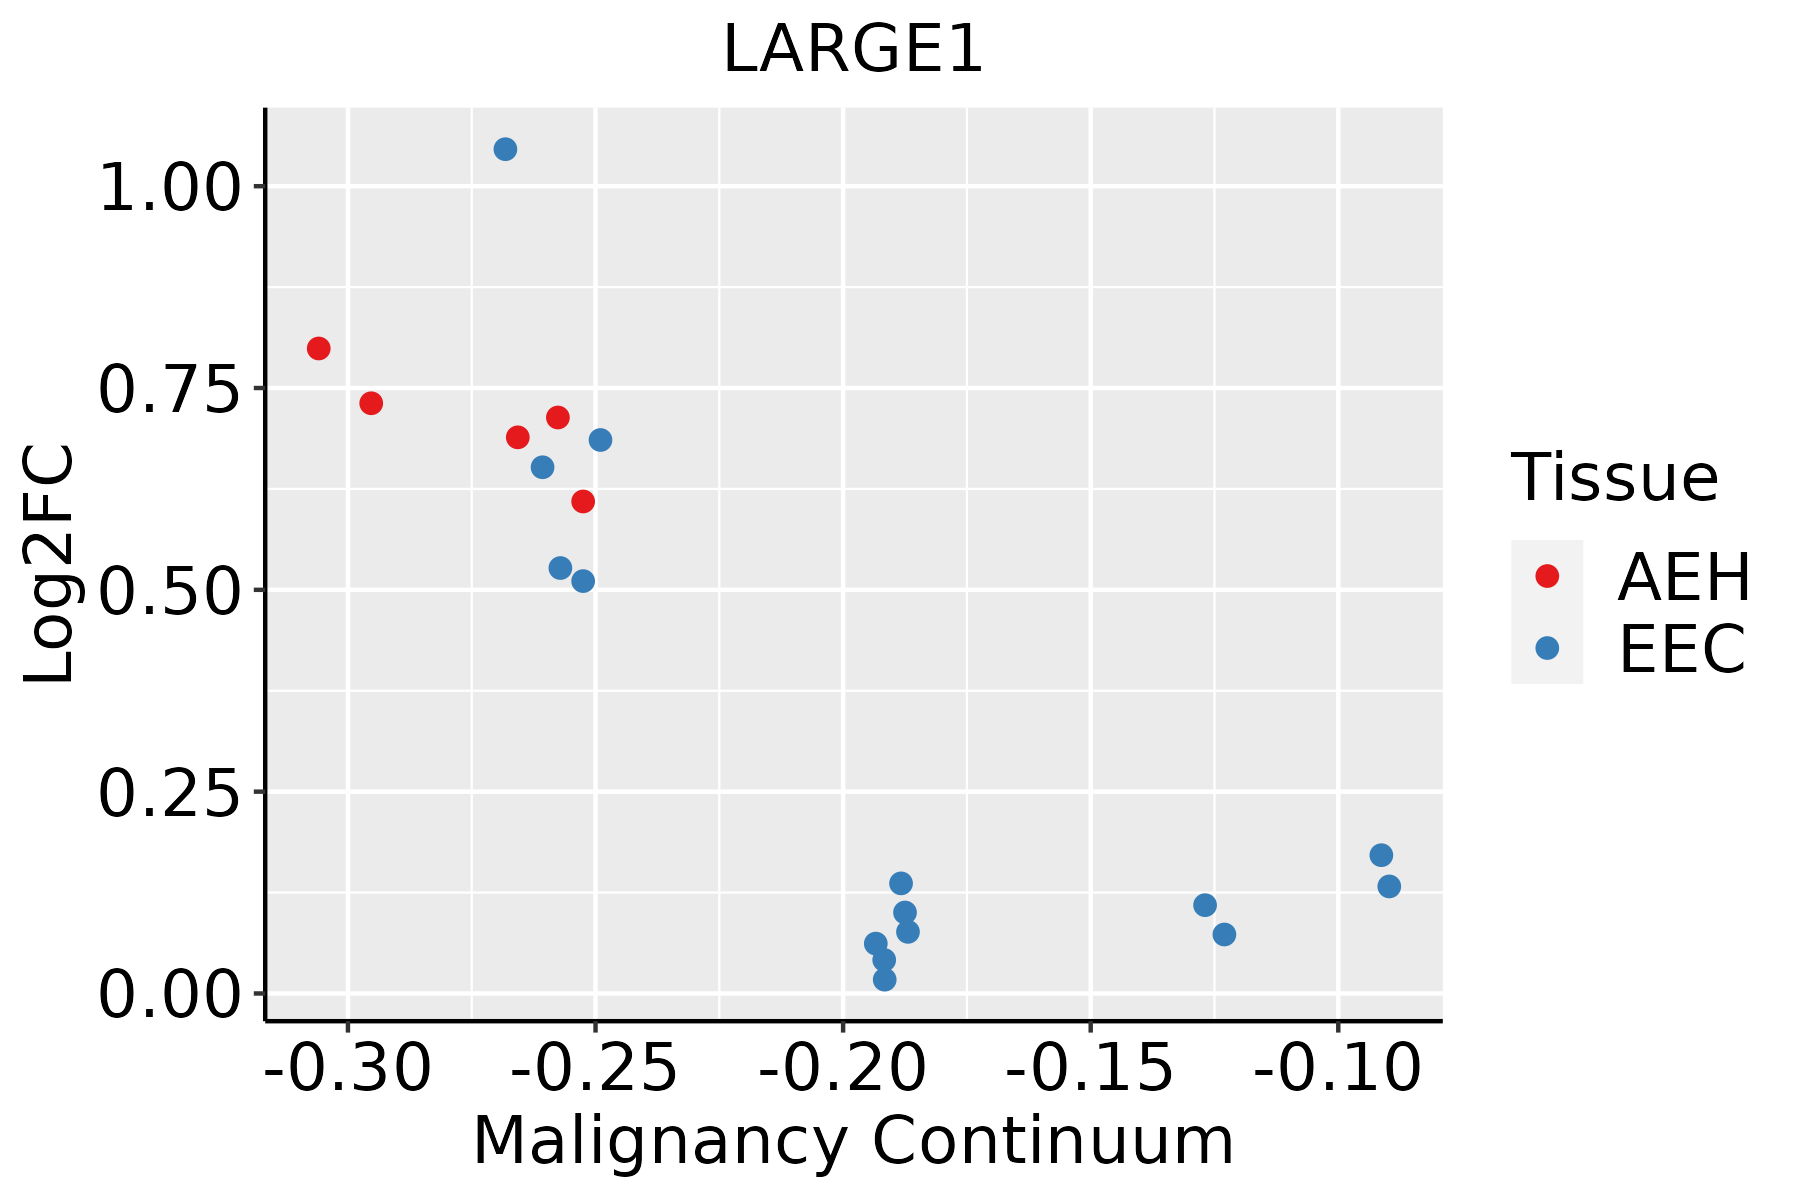 | AEH: Atypical endometrial hyperplasia |
| EEC: Endometrioid Cancer |
| GC | 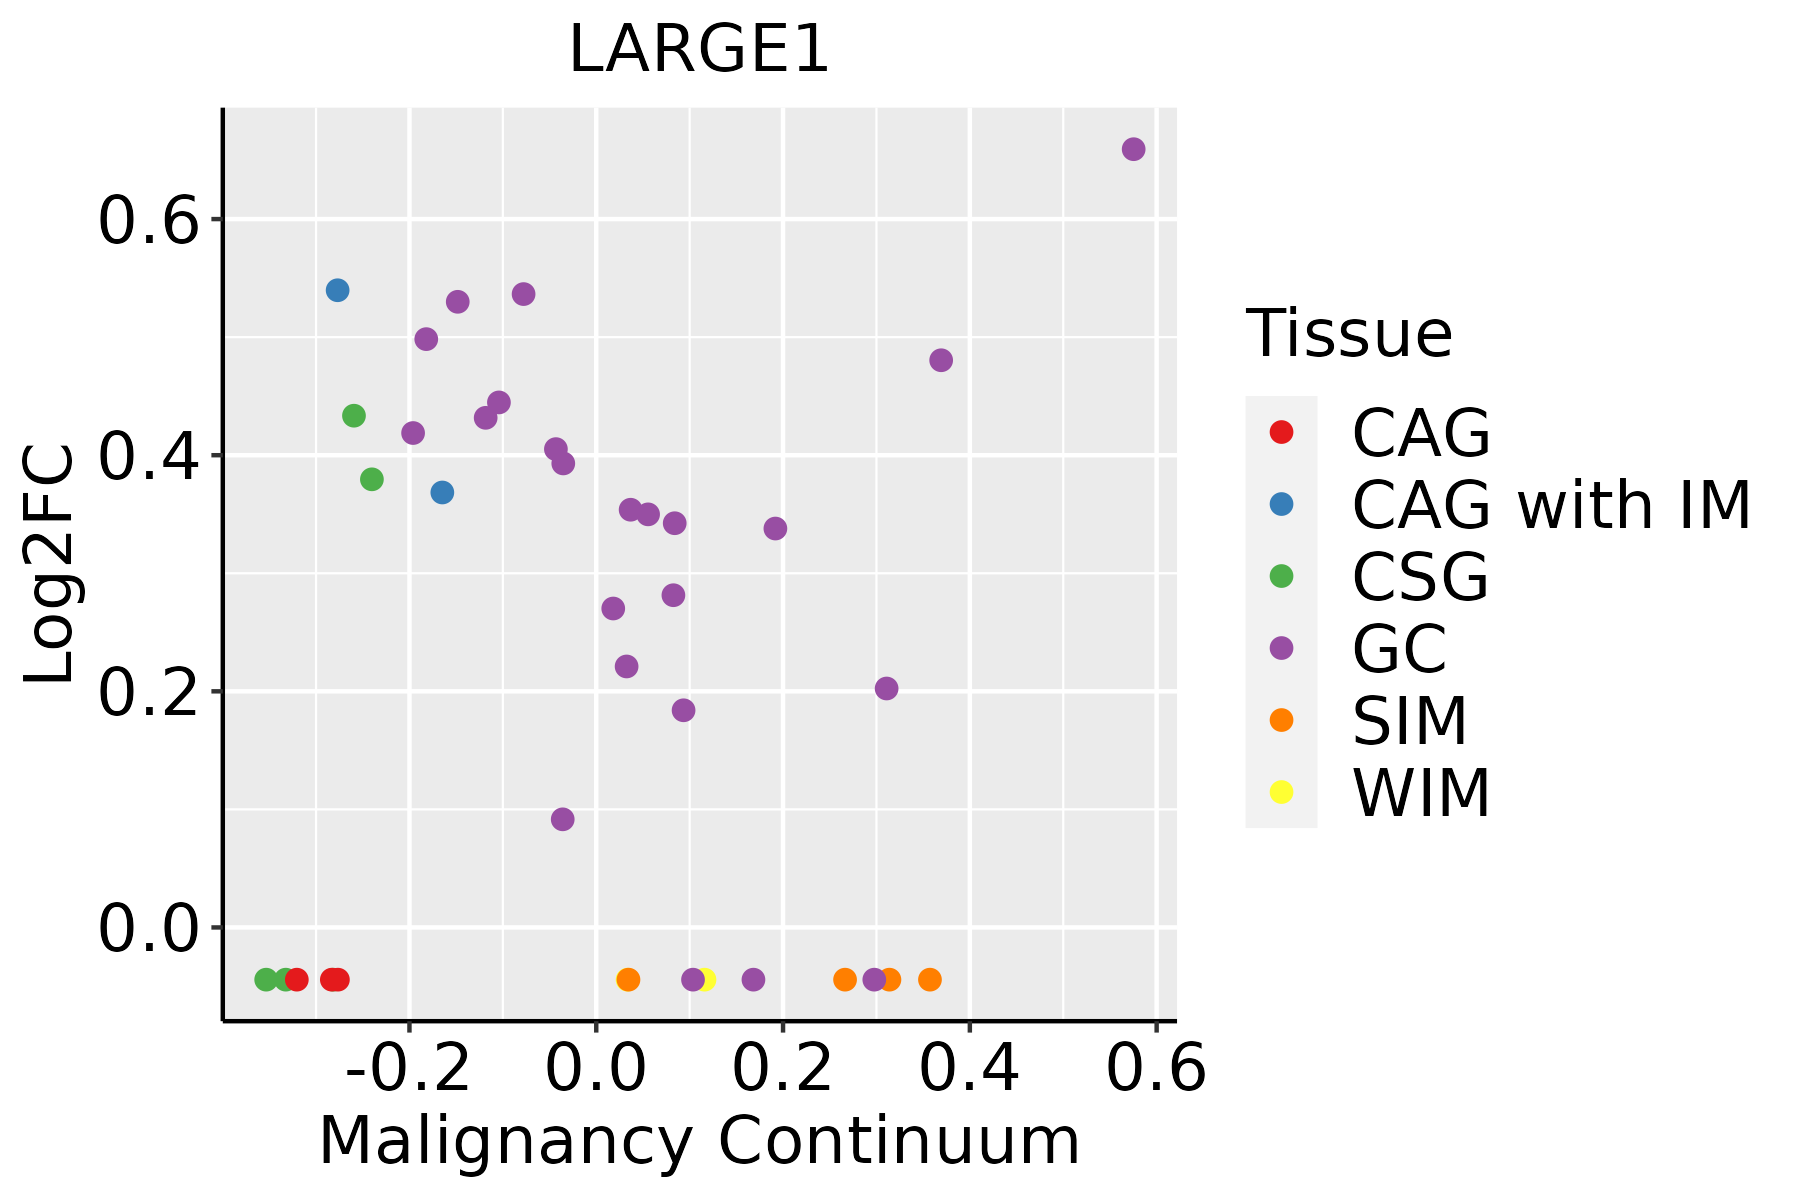 | CAG: Chronic atrophic gastritis |
| CAG with IM: Chronic atrophic gastritis with intestinal metaplasia |
| CSG: Chronic superficial gastritis |
| GC: Gastric cancer |
| SIM: Severe intestinal metaplasia |
| WIM: Wild intestinal metaplasia |
| Liver |  | HCC: Hepatocellular carcinoma |
| NAFLD: Non-alcoholic fatty liver disease |
| Lung | 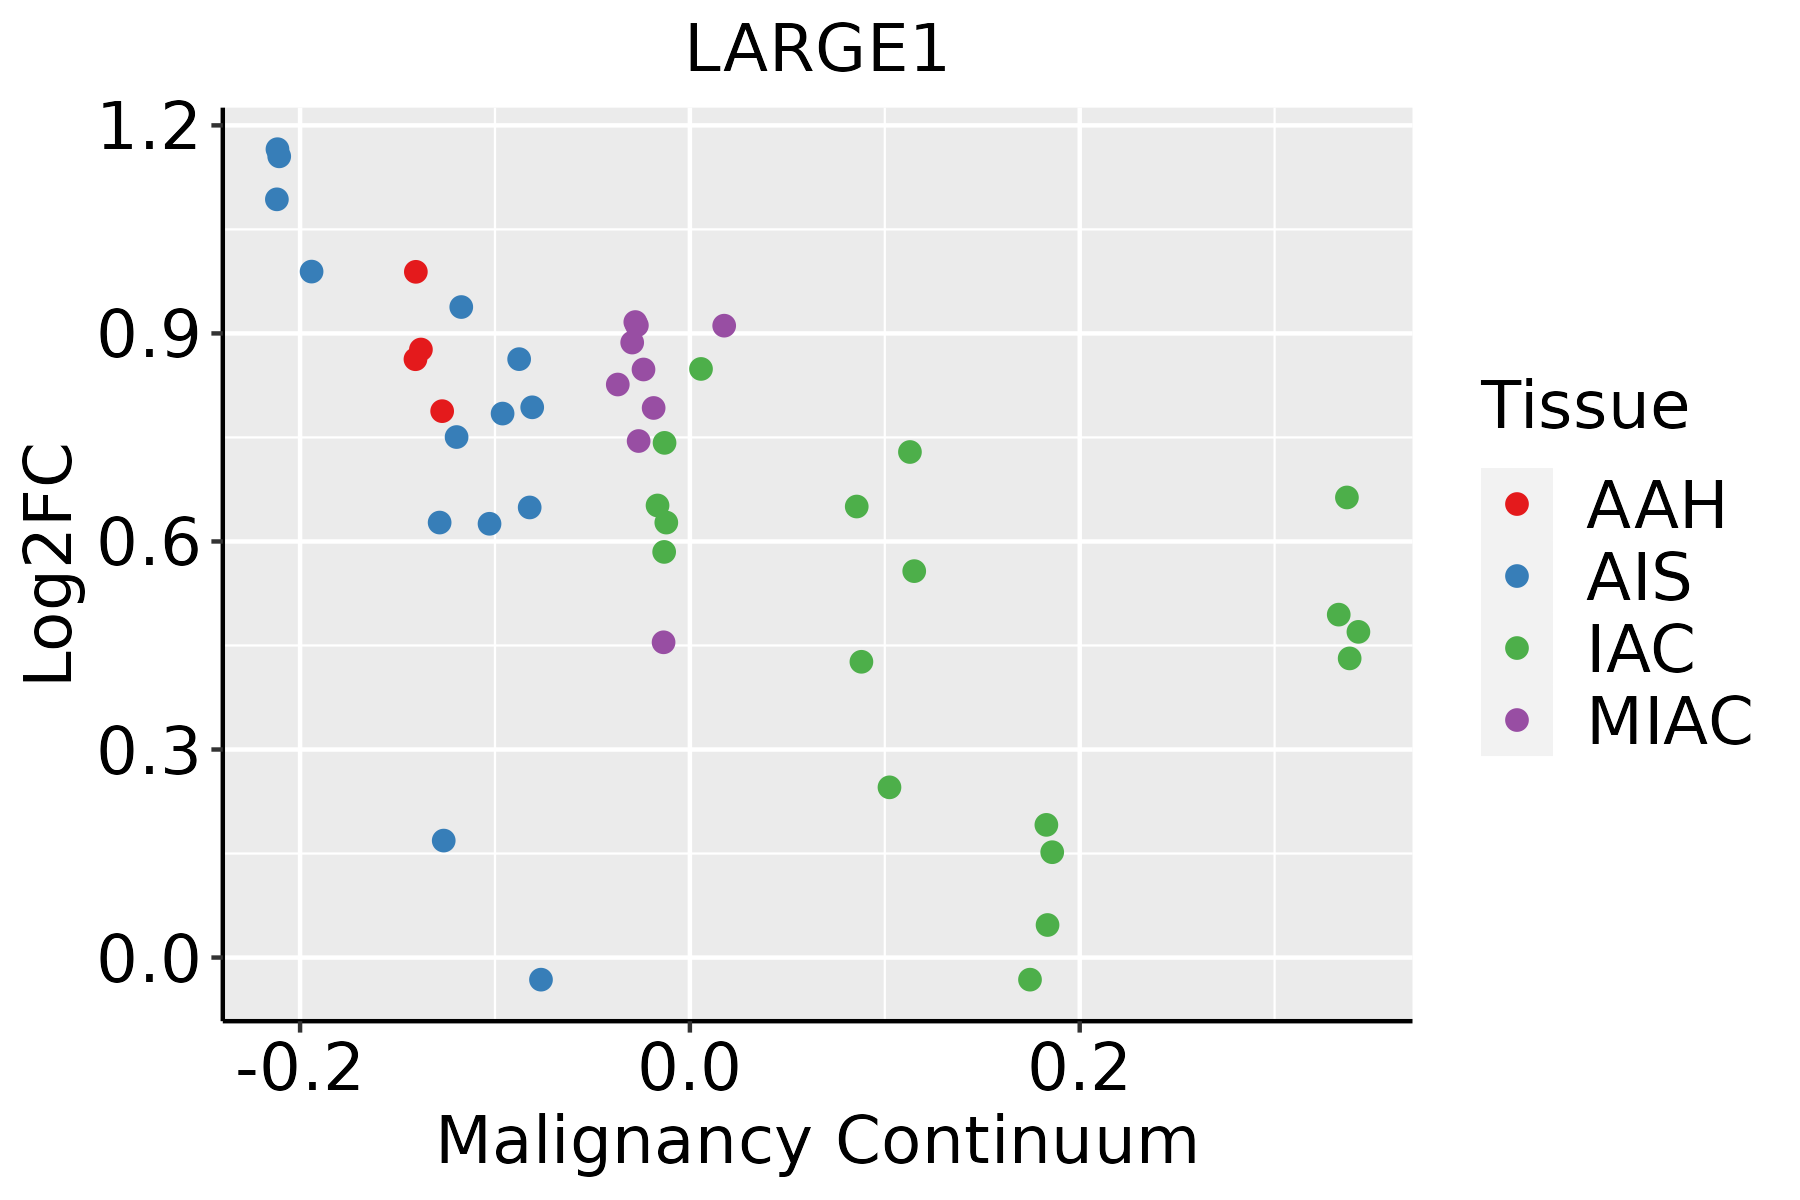 | AAH: Atypical adenomatous hyperplasia |
| AIS: Adenocarcinoma in situ |
| IAC: Invasive lung adenocarcinoma |
| MIA: Minimally invasive adenocarcinoma |
| Oral Cavity | 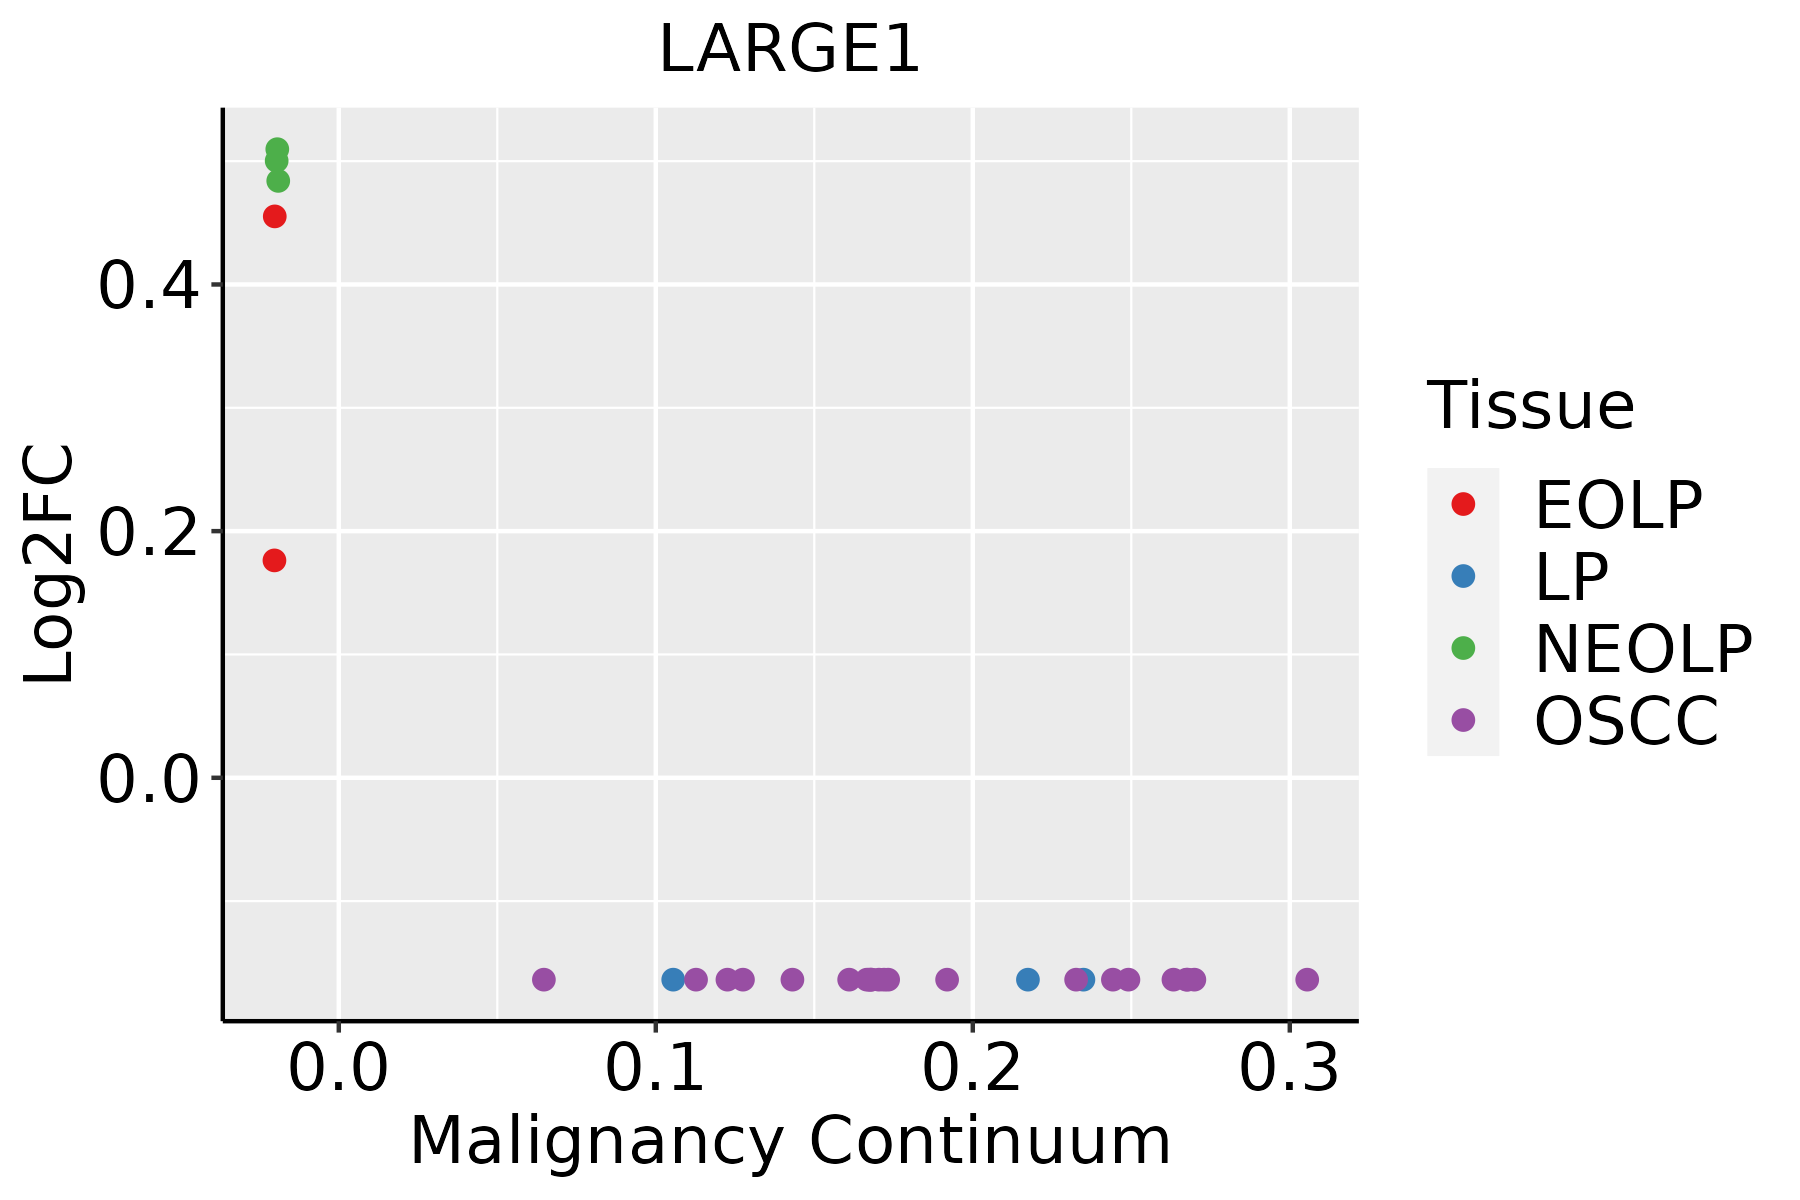 | EOLP: Erosive Oral lichen planus |
| LP: leukoplakia |
| NEOLP: Non-erosive oral lichen planus |
| OSCC: Oral squamous cell carcinoma |
| Prostate | 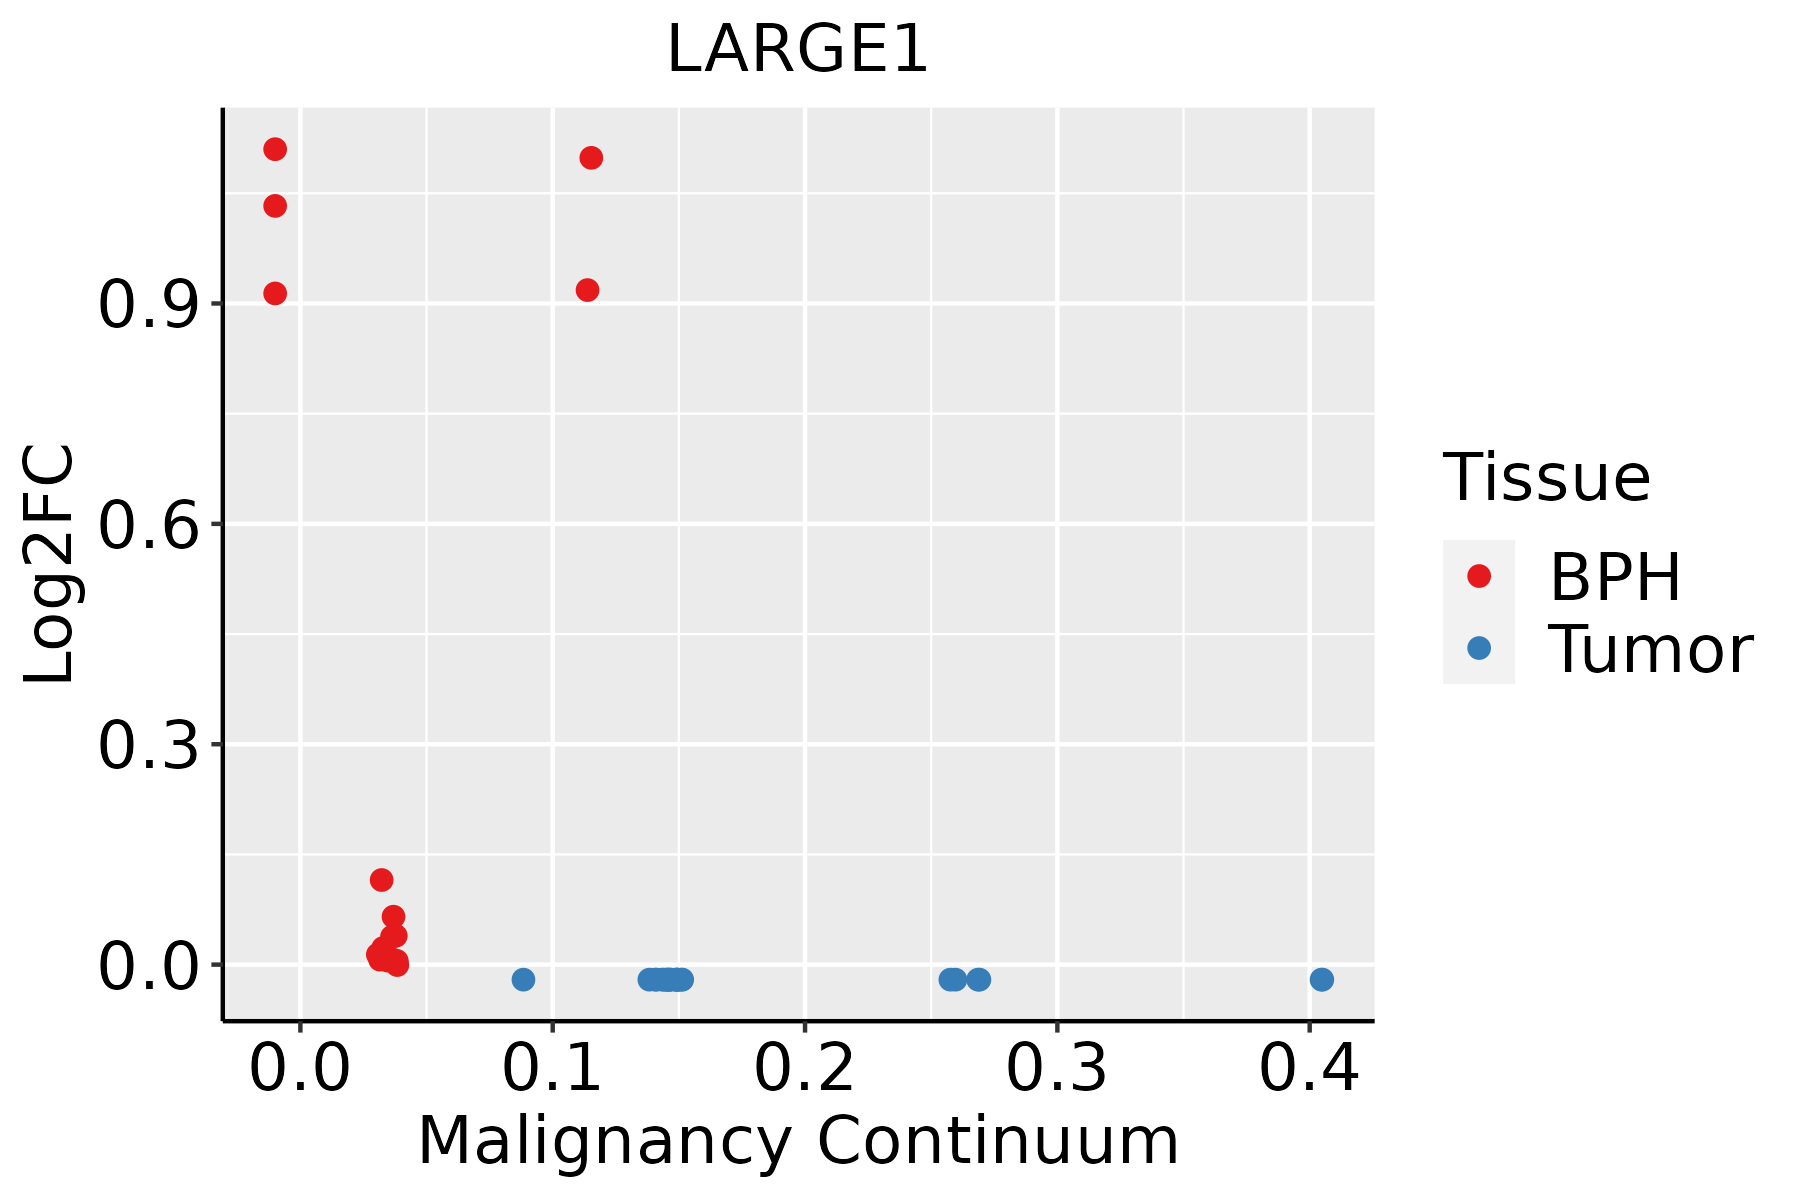 | BPH: Benign Prostatic Hyperplasia |
| Skin | 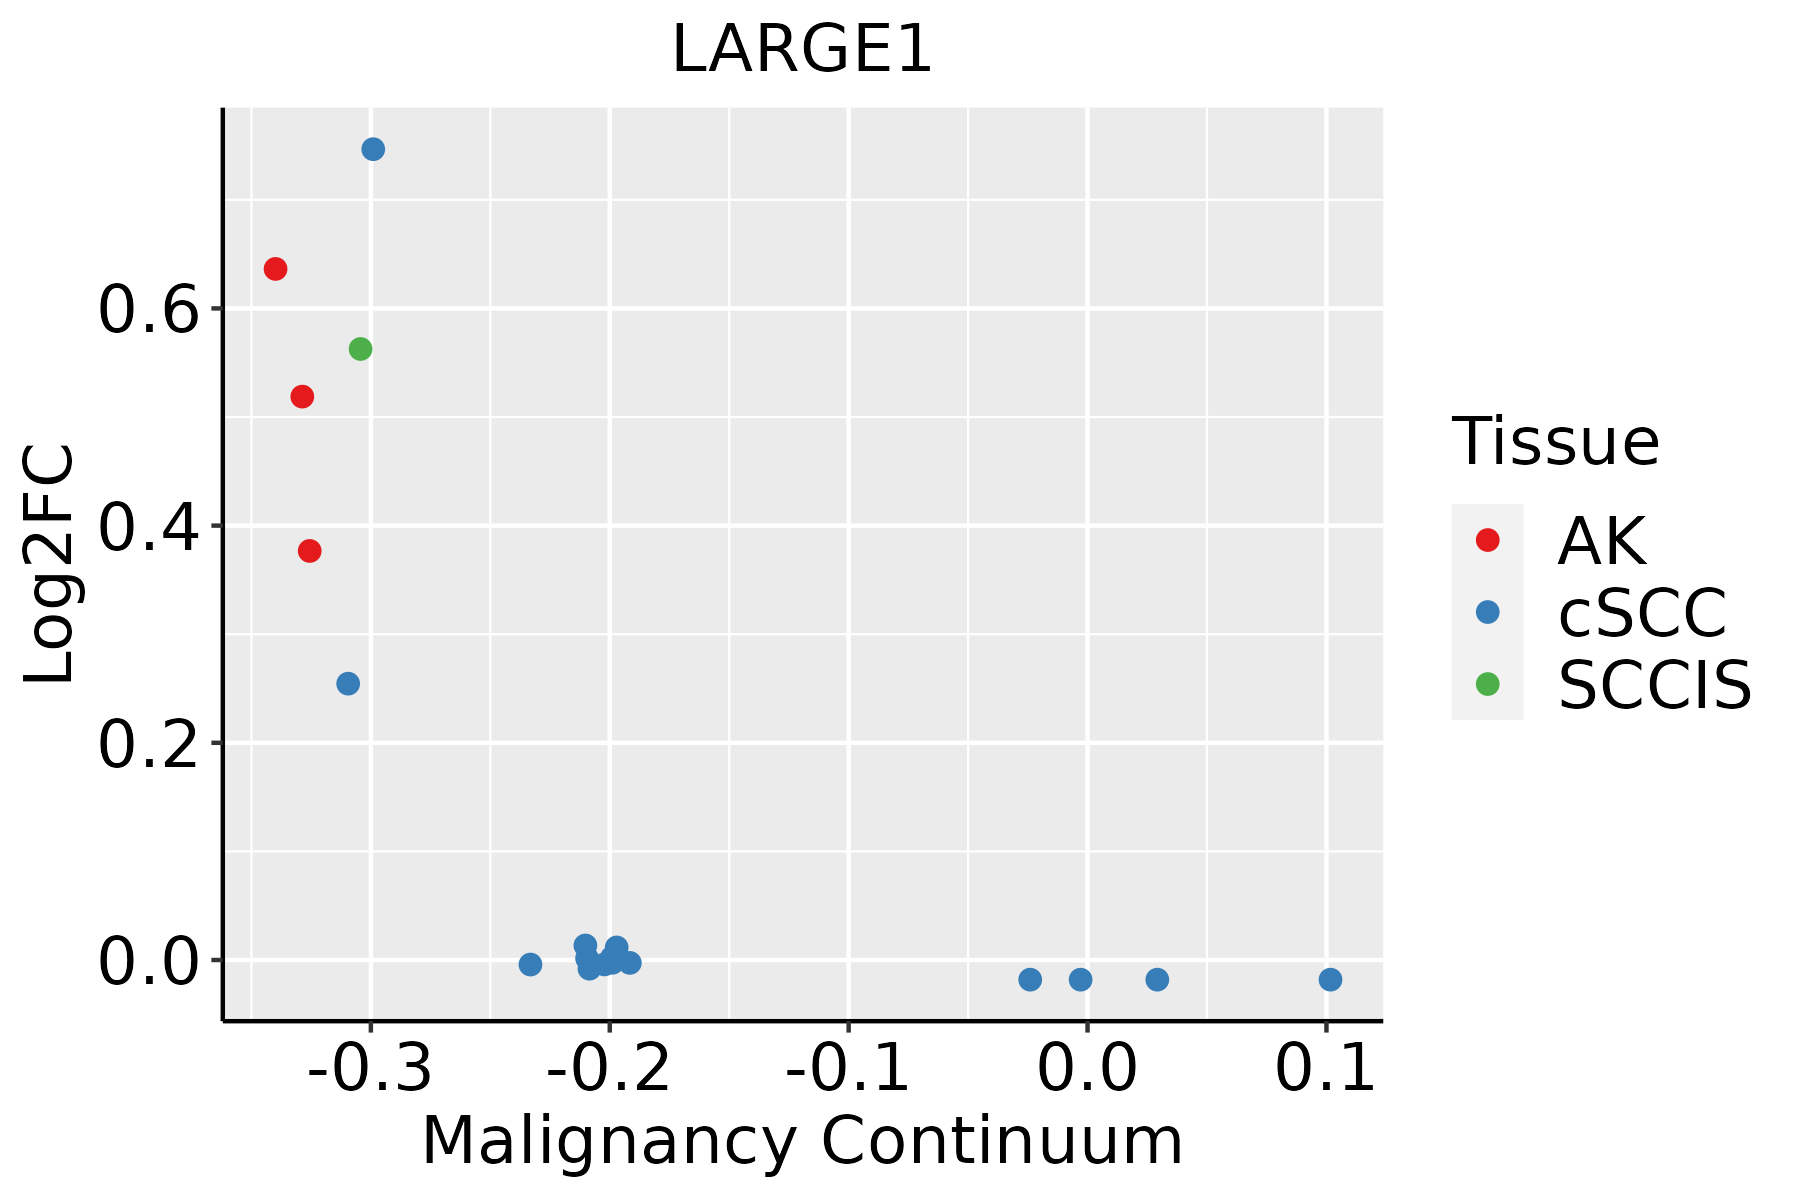 | AK: Actinic keratosis |
| cSCC: Cutaneous squamous cell carcinoma |
| SCCIS:squamous cell carcinoma in situ |
| GO ID | Tissue | Disease Stage | Description | Gene Ratio | Bg Ratio | pvalue | p.adjust | Count |
| GO:00310996 | Cervix | CC | regeneration | 46/2311 | 198/18723 | 1.43e-05 | 2.84e-04 | 46 |
| GO:00602498 | Cervix | CC | anatomical structure homeostasis | 63/2311 | 314/18723 | 6.03e-05 | 8.68e-04 | 63 |
| GO:0042246 | Cervix | CC | tissue regeneration | 19/2311 | 72/18723 | 9.11e-04 | 7.81e-03 | 19 |
| GO:00434032 | Cervix | CC | skeletal muscle tissue regeneration | 12/2311 | 37/18723 | 1.15e-03 | 9.39e-03 | 12 |
| GO:00075173 | Cervix | CC | muscle organ development | 58/2311 | 327/18723 | 2.73e-03 | 1.85e-02 | 58 |
| GO:0060249 | Colorectum | AD | anatomical structure homeostasis | 94/3918 | 314/18723 | 9.37e-05 | 1.42e-03 | 94 |
| GO:0006486 | Colorectum | AD | protein glycosylation | 64/3918 | 226/18723 | 4.86e-03 | 3.27e-02 | 64 |
| GO:0043413 | Colorectum | AD | macromolecule glycosylation | 64/3918 | 226/18723 | 4.86e-03 | 3.27e-02 | 64 |
| GO:0070085 | Colorectum | AD | glycosylation | 67/3918 | 240/18723 | 5.78e-03 | 3.67e-02 | 67 |
| GO:00602491 | Colorectum | SER | anatomical structure homeostasis | 74/2897 | 314/18723 | 1.01e-04 | 2.13e-03 | 74 |
| GO:00602492 | Colorectum | MSS | anatomical structure homeostasis | 84/3467 | 314/18723 | 1.87e-04 | 2.64e-03 | 84 |
| GO:0046716 | Colorectum | MSS | muscle cell cellular homeostasis | 9/3467 | 19/18723 | 3.88e-03 | 2.83e-02 | 9 |
| GO:0031099 | Colorectum | MSS | regeneration | 51/3467 | 198/18723 | 6.99e-03 | 4.49e-02 | 51 |
| GO:00602493 | Colorectum | MSI-H | anatomical structure homeostasis | 38/1319 | 314/18723 | 7.73e-04 | 1.44e-02 | 38 |
| GO:00310991 | Colorectum | MSI-H | regeneration | 25/1319 | 198/18723 | 3.27e-03 | 3.99e-02 | 25 |
| GO:00602494 | Colorectum | FAP | anatomical structure homeostasis | 69/2622 | 314/18723 | 7.51e-05 | 1.37e-03 | 69 |
| GO:00064861 | Colorectum | FAP | protein glycosylation | 48/2622 | 226/18723 | 1.85e-03 | 1.57e-02 | 48 |
| GO:00434131 | Colorectum | FAP | macromolecule glycosylation | 48/2622 | 226/18723 | 1.85e-03 | 1.57e-02 | 48 |
| GO:00700851 | Colorectum | FAP | glycosylation | 50/2622 | 240/18723 | 2.30e-03 | 1.85e-02 | 50 |
| GO:0009101 | Colorectum | FAP | glycoprotein biosynthetic process | 63/2622 | 317/18723 | 2.31e-03 | 1.86e-02 | 63 |
| Hugo Symbol | Variant Class | Variant Classification | dbSNP RS | HGVSc | HGVSp | HGVSp Short | SWISSPROT | BIOTYPE | SIFT | PolyPhen | Tumor Sample Barcode | Tissue | Histology | Sex | Age | Stage | Therapy Types | Drugs | Outcome |
| LARGE1 | SNV | Missense_Mutation | | c.102C>A | p.Phe34Leu | p.F34L | O95461 | protein_coding | tolerated_low_confidence(1) | benign(0) | TCGA-A1-A0SK-01 | Breast | breast invasive carcinoma | Female | <65 | I/II | Unknown | Unknown | PD |
| LARGE1 | SNV | Missense_Mutation | | c.824N>G | p.Asp275Gly | p.D275G | O95461 | protein_coding | deleterious(0.01) | possibly_damaging(0.824) | TCGA-A8-A09Z-01 | Breast | breast invasive carcinoma | Female | >=65 | I/II | Unknown | Unknown | SD |
| LARGE1 | SNV | Missense_Mutation | | c.2122C>T | p.His708Tyr | p.H708Y | O95461 | protein_coding | deleterious(0) | probably_damaging(0.999) | TCGA-BH-A0B0-01 | Breast | breast invasive carcinoma | Female | <65 | I/II | Chemotherapy | adriamycin | CR |
| LARGE1 | SNV | Missense_Mutation | novel | c.1760A>G | p.Asn587Ser | p.N587S | O95461 | protein_coding | tolerated(1) | benign(0.003) | TCGA-BH-A0H7-01 | Breast | breast invasive carcinoma | Female | >=65 | III/IV | Chemotherapy | doxorubicin | SD |
| LARGE1 | SNV | Missense_Mutation | | c.757N>C | p.Glu253Gln | p.E253Q | O95461 | protein_coding | tolerated(0.15) | possibly_damaging(0.474) | TCGA-BH-A0HP-01 | Breast | breast invasive carcinoma | Female | >=65 | III/IV | Chemotherapy | doxorubicin | SD |
| LARGE1 | SNV | Missense_Mutation | | c.2236N>A | p.Ala746Thr | p.A746T | O95461 | protein_coding | tolerated(0.05) | possibly_damaging(0.677) | TCGA-BH-A18G-01 | Breast | breast invasive carcinoma | Female | >=65 | I/II | Unknown | Unknown | SD |
| LARGE1 | SNV | Missense_Mutation | novel | c.2011G>A | p.Asp671Asn | p.D671N | O95461 | protein_coding | deleterious(0) | probably_damaging(0.999) | TCGA-D8-A1J8-01 | Breast | breast invasive carcinoma | Female | >=65 | I/II | Hormone Therapy | nolvadex | SD |
| LARGE1 | SNV | Missense_Mutation | | c.1116N>A | p.Asp372Glu | p.D372E | O95461 | protein_coding | tolerated(1) | benign(0.015) | TCGA-GM-A2DB-01 | Breast | breast invasive carcinoma | Female | <65 | I/II | Chemotherapy | taxol | CR |
| LARGE1 | insertion | In_Frame_Ins | novel | c.1153_1154insCTAGGGAGAGAAGGTGCATCGAGGAAGACTTCCTGGAGG | p.Lys385delinsThrArgGluArgArgCysIleGluGluAspPheLeuGluGlu | p.K385delinsTRERRCIEEDFLEE | O95461 | protein_coding | | | TCGA-A2-A0CP-01 | Breast | breast invasive carcinoma | Female | <65 | I/II | Chemotherapy | cytoxan | SD |
| LARGE1 | insertion | Nonsense_Mutation | novel | c.1795_1796insAGGGTAGGAAGGTTTAGCTTATTTCTGTTTGT | p.Thr599LysfsTer6 | p.T599Kfs*6 | O95461 | protein_coding | | | TCGA-A2-A0CX-01 | Breast | breast invasive carcinoma | Female | <65 | I/II | Chemotherapy | adriamycin | SD |


