| Tissue | Expression Dynamics | Abbreviation |
| Breast | 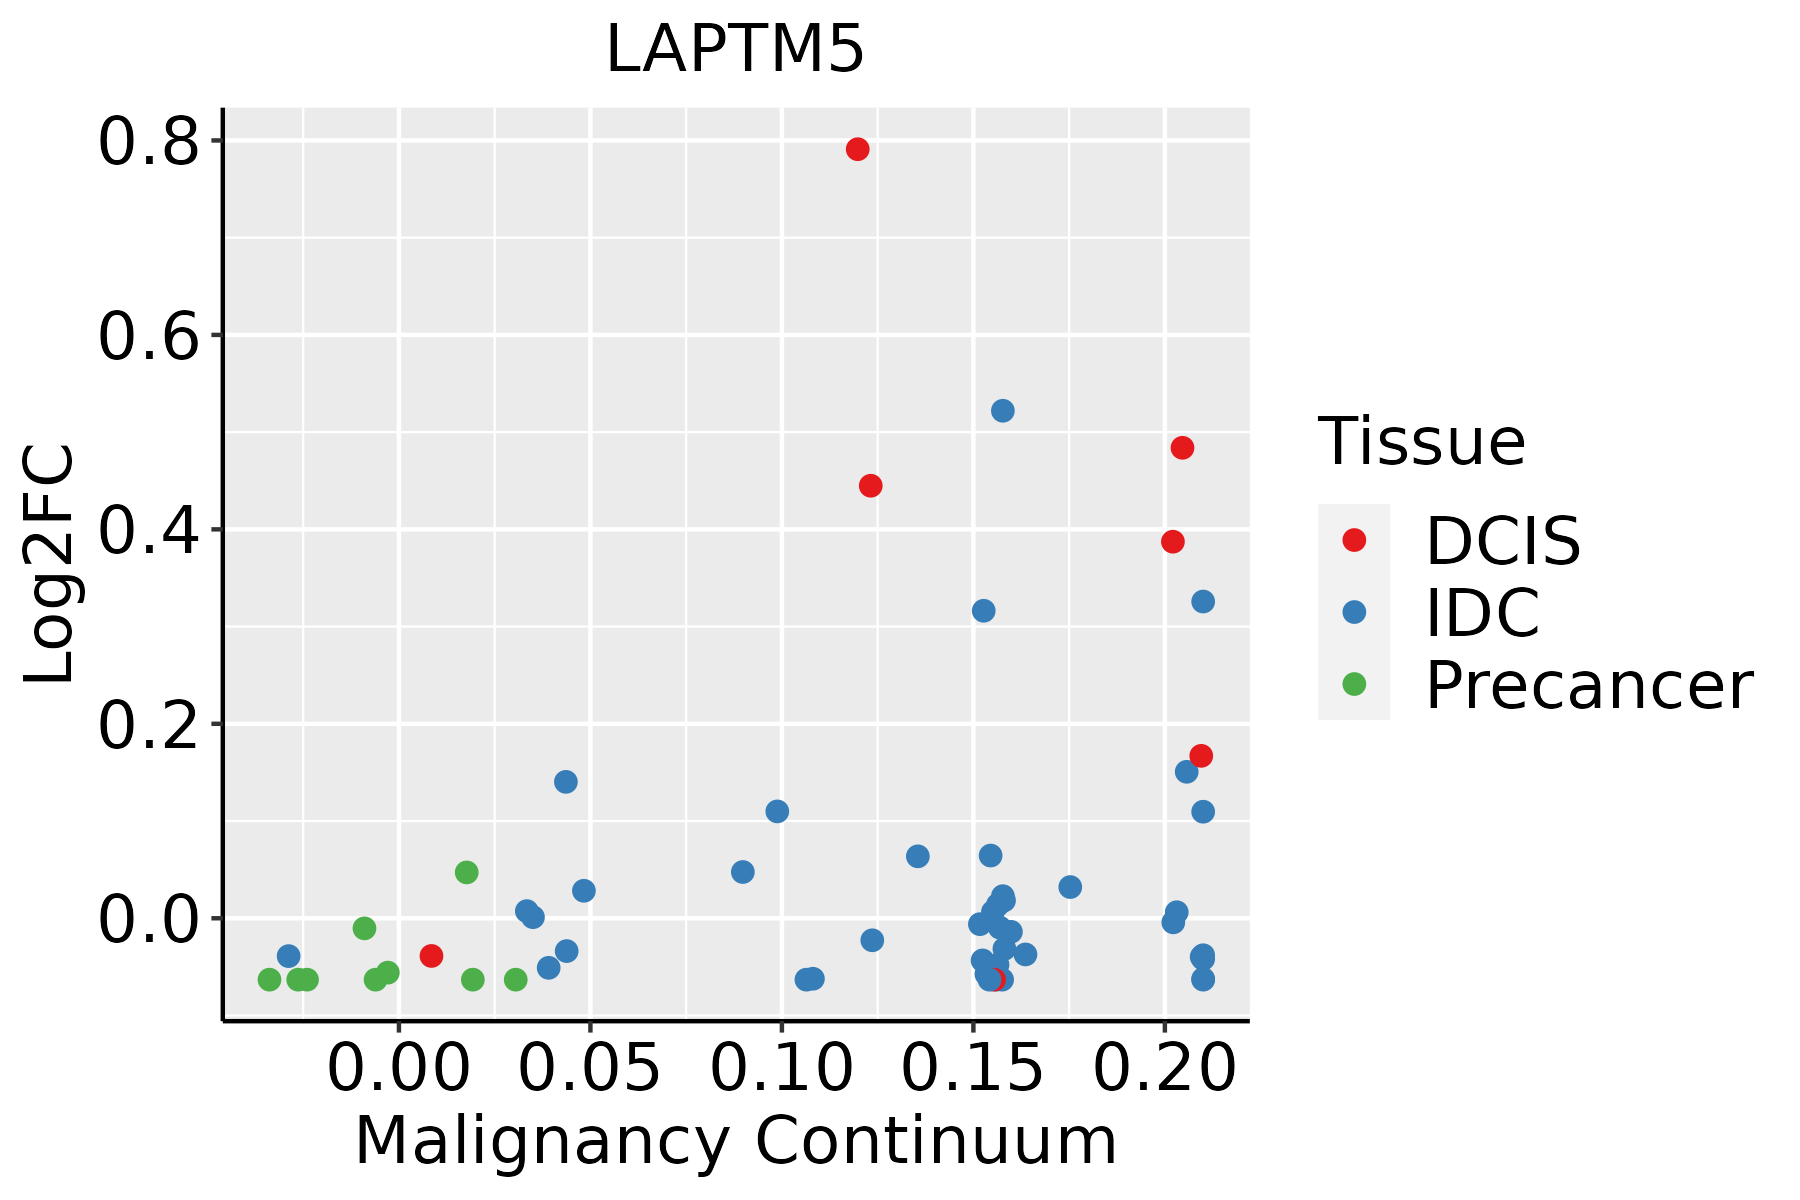 | IDC: Invasive ductal carcinoma |
| DCIS: Ductal carcinoma in situ |
| Precancer(BRCA1-mut): Precancerous lesion from BRCA1 mutation carriers |
| Cervix | 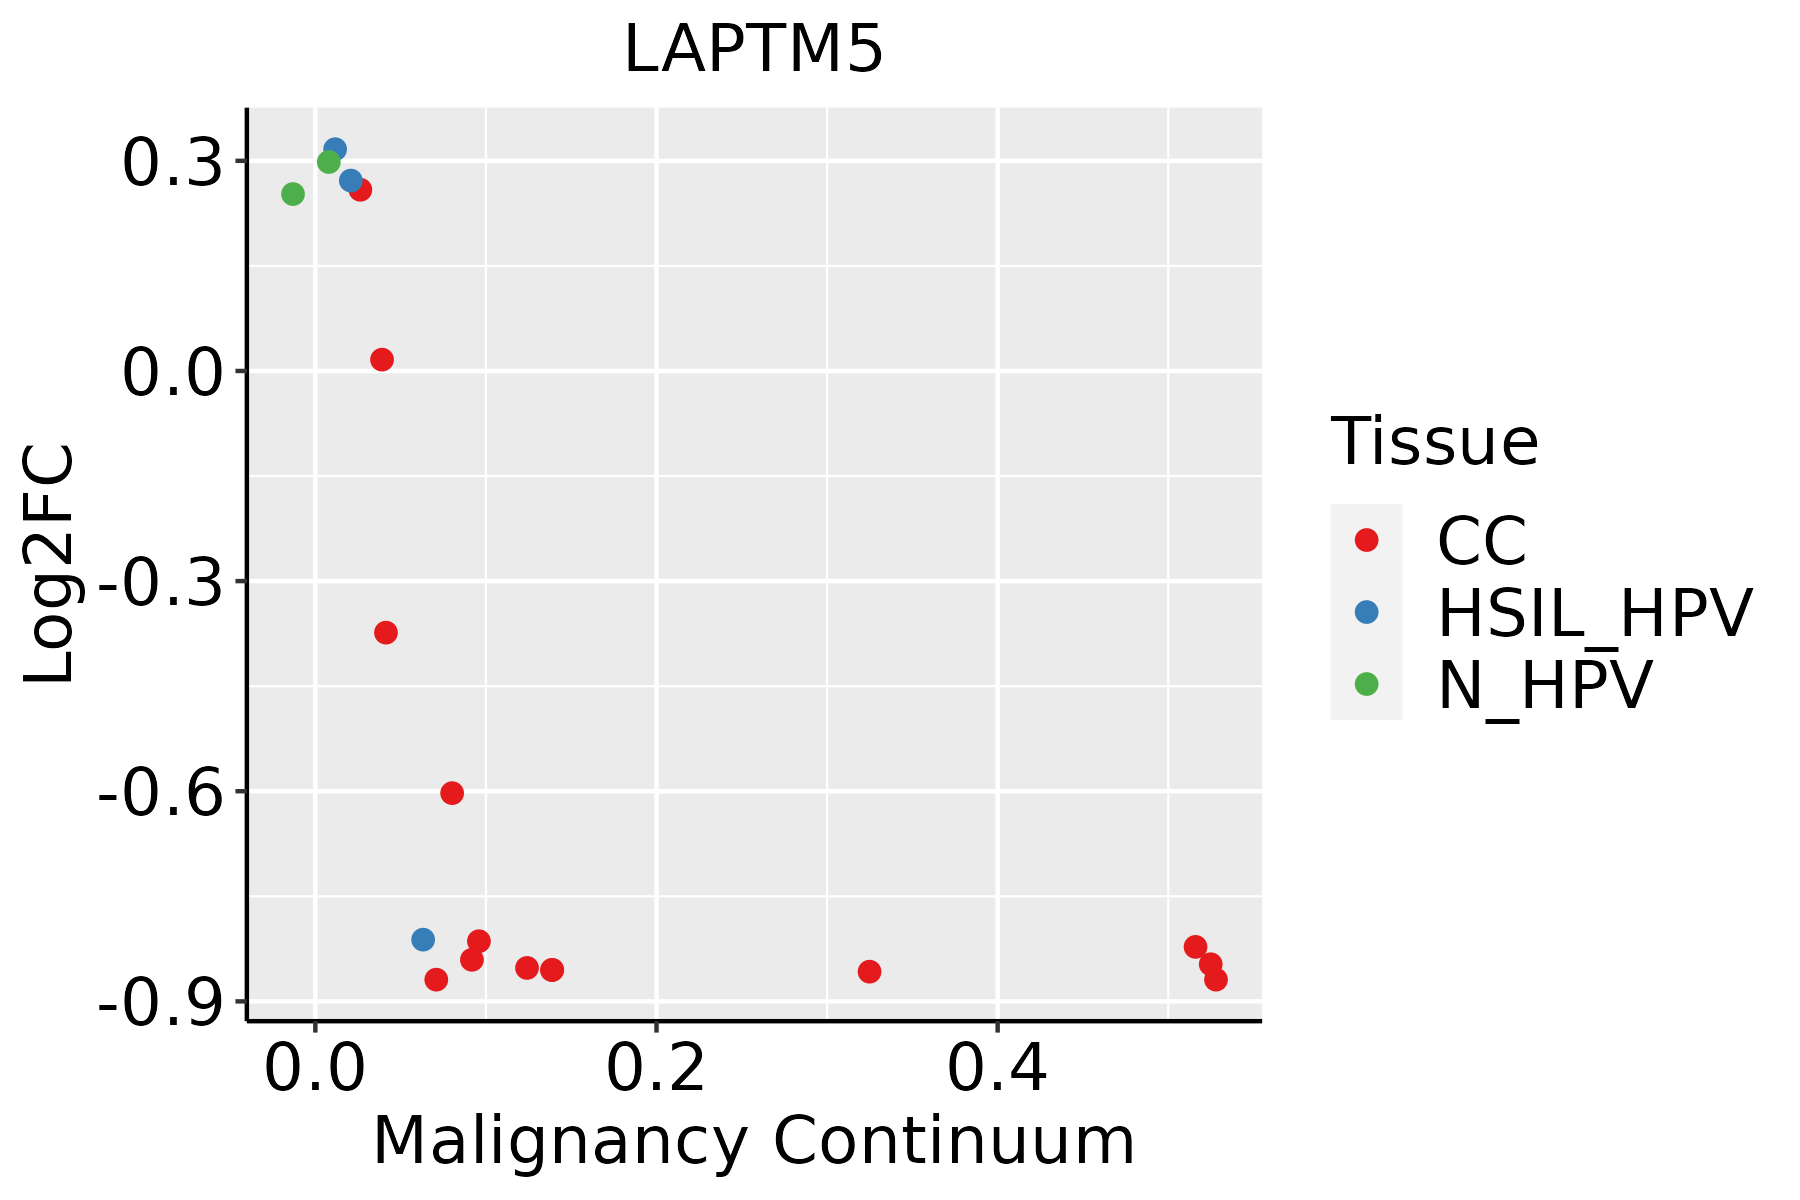 | CC: Cervix cancer |
| HSIL_HPV: HPV-infected high-grade squamous intraepithelial lesions |
| N_HPV: HPV-infected normal cervix |
| Esophagus | 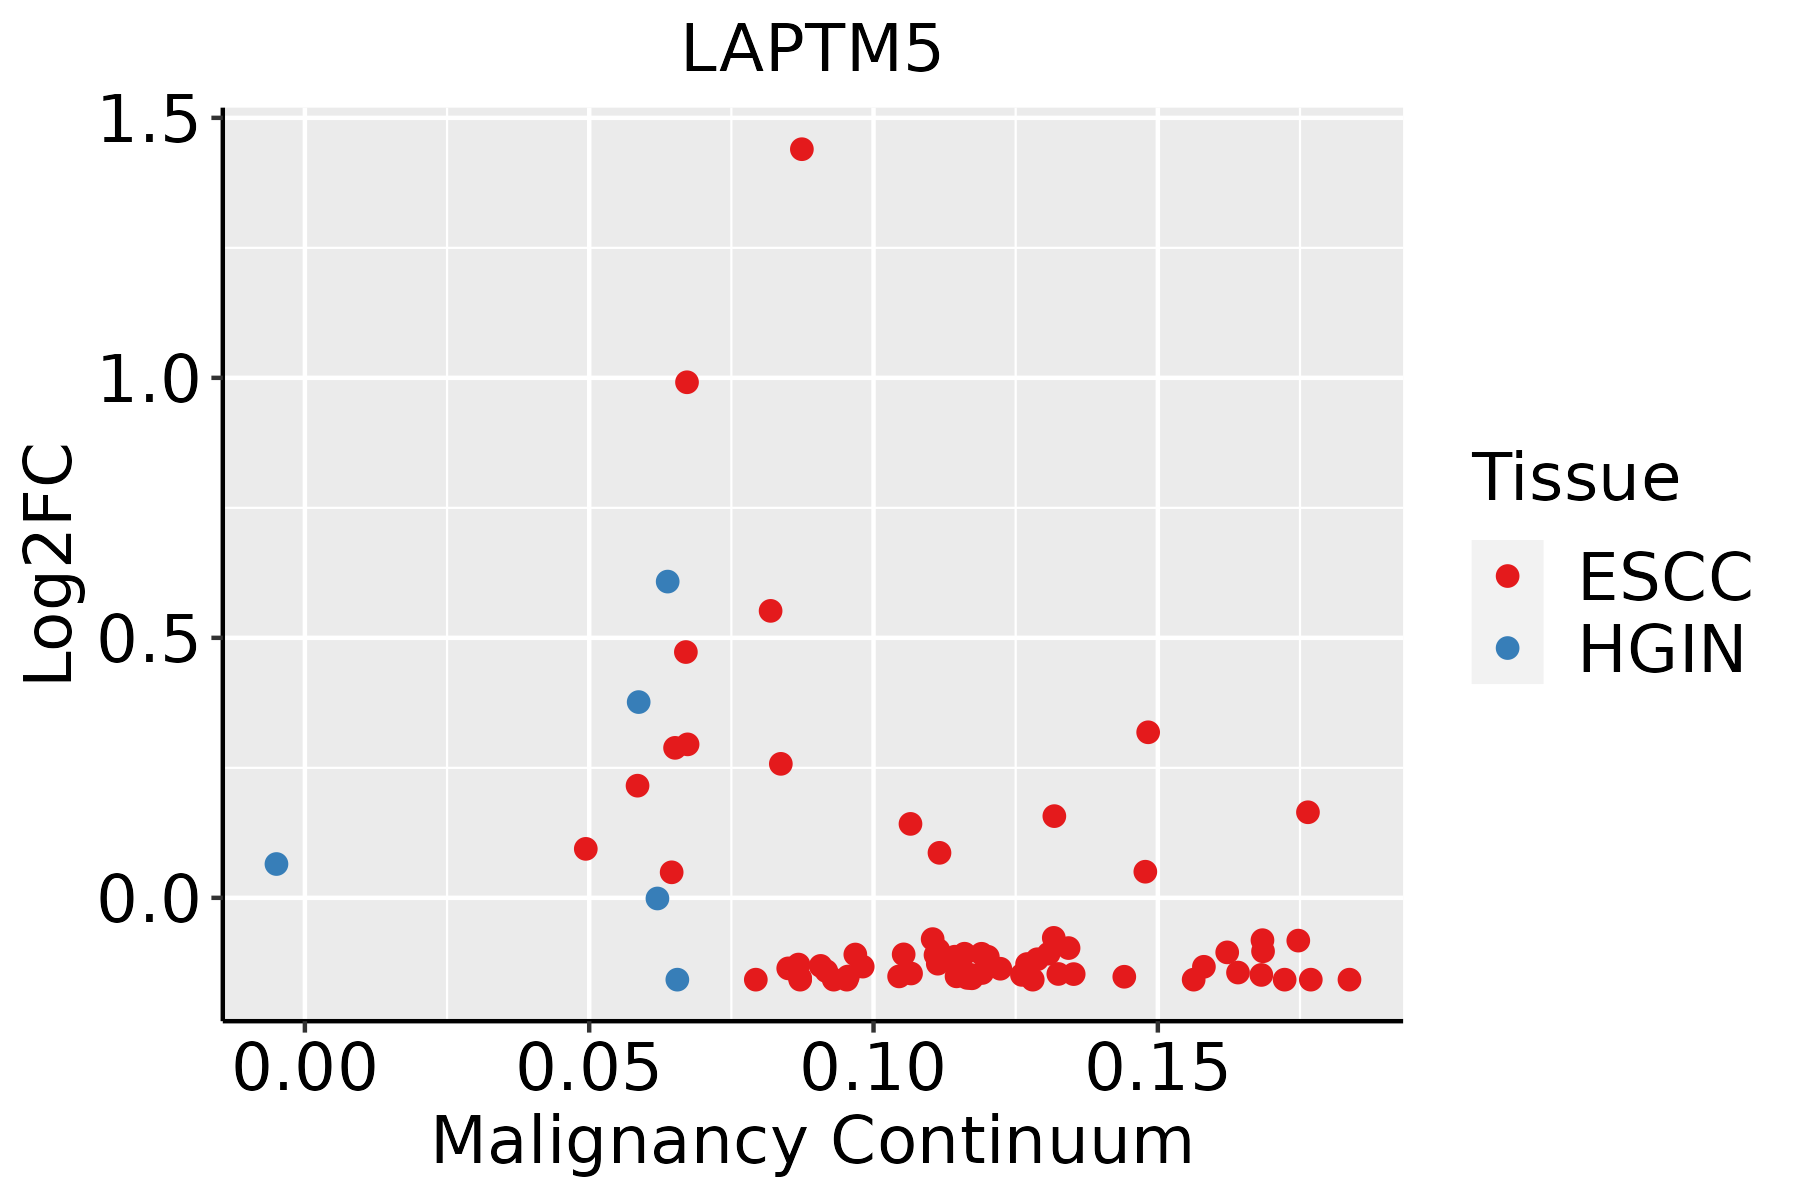 | ESCC: Esophageal squamous cell carcinoma |
| HGIN: High-grade intraepithelial neoplasias |
| LGIN: Low-grade intraepithelial neoplasias |
| Liver | 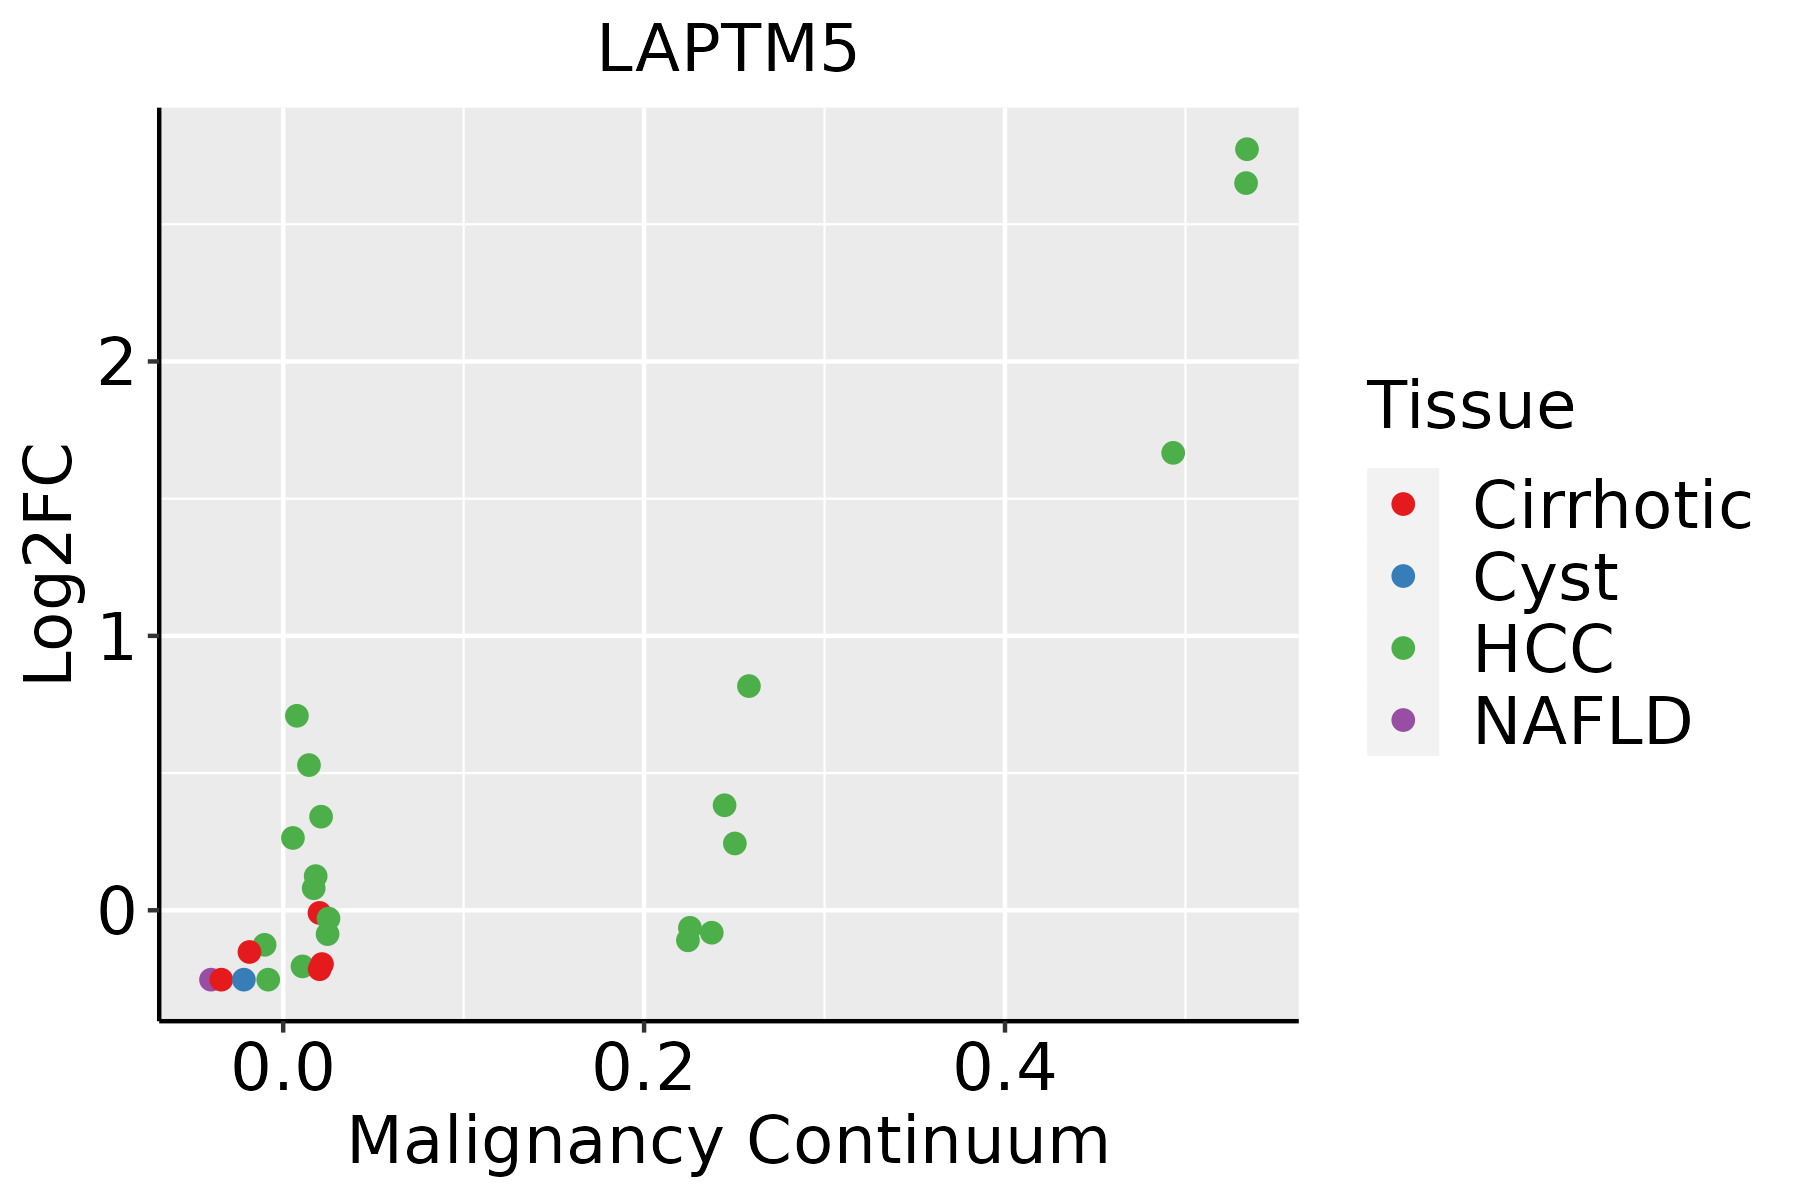 | HCC: Hepatocellular carcinoma |
| NAFLD: Non-alcoholic fatty liver disease |
| Oral Cavity | 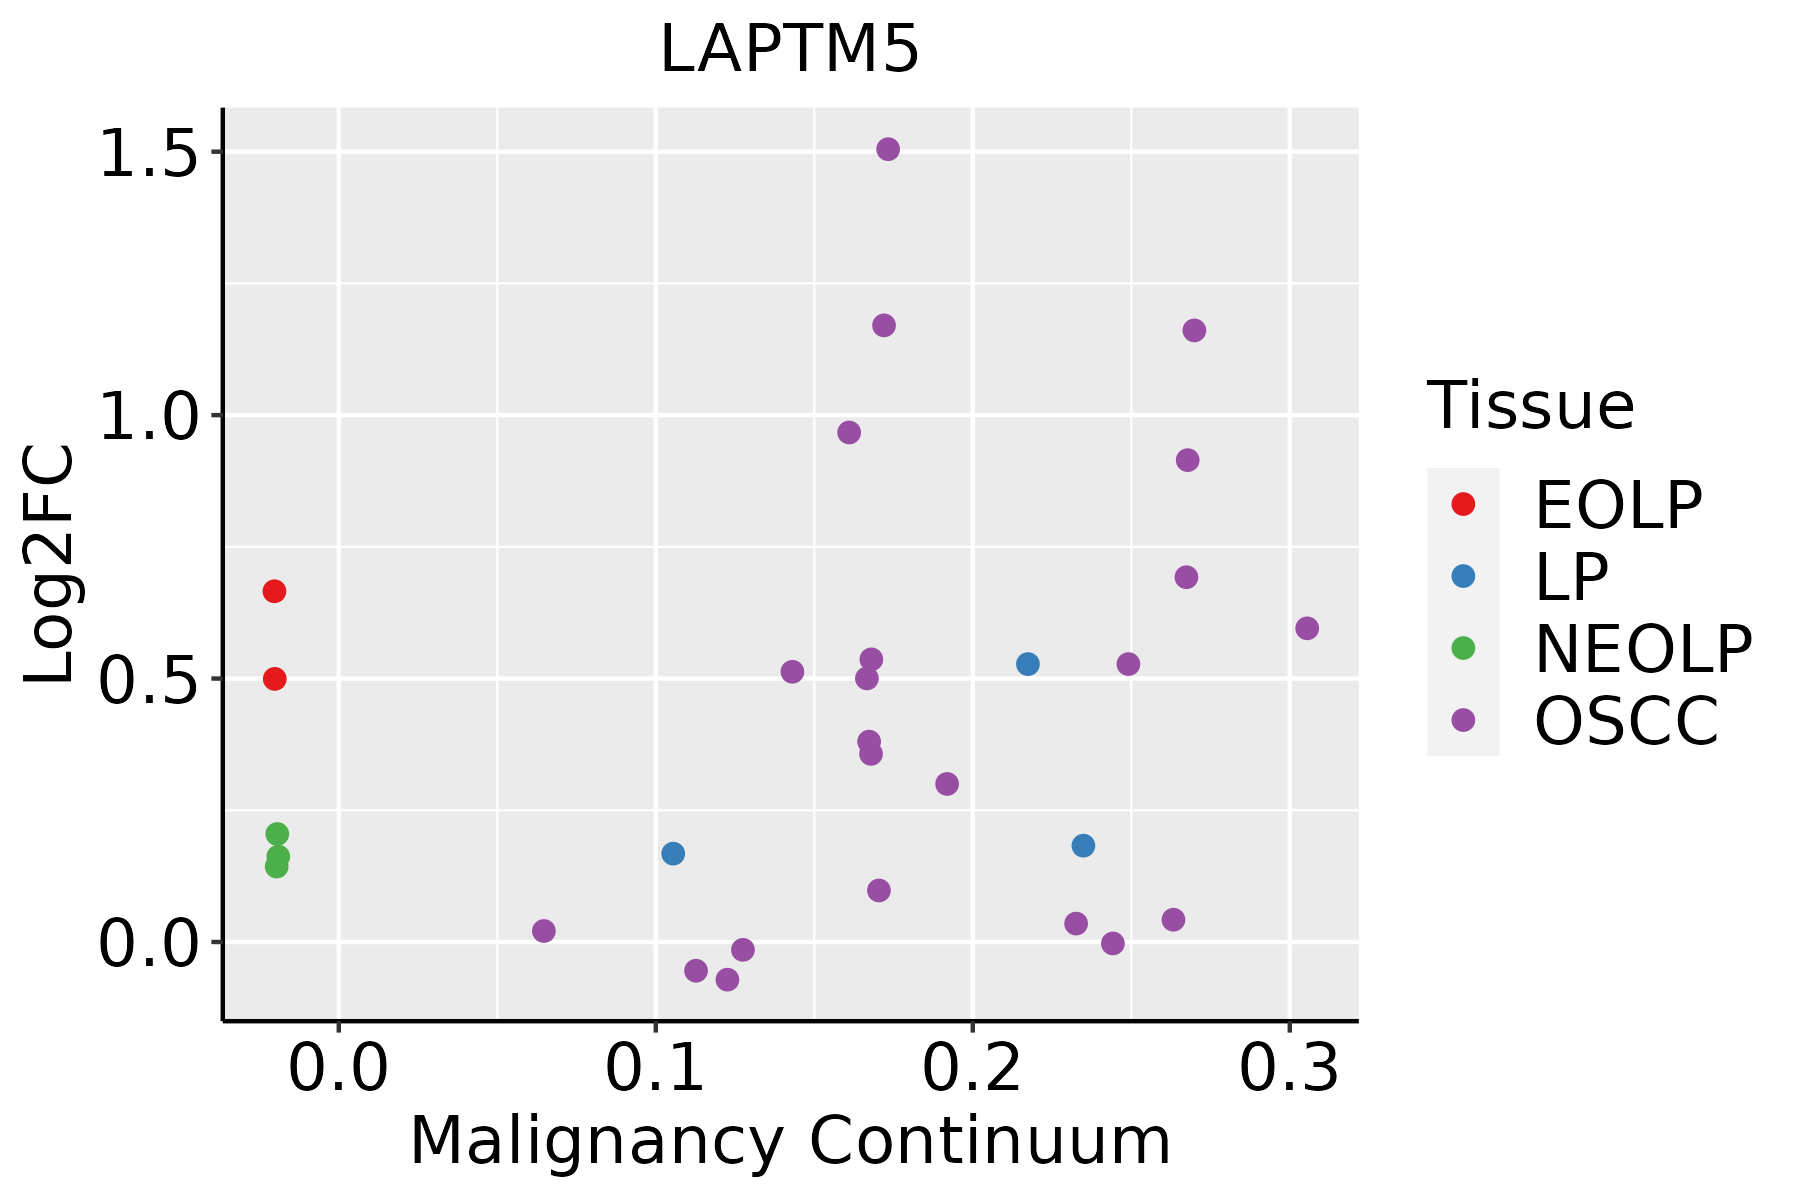 | EOLP: Erosive Oral lichen planus |
| LP: leukoplakia |
| NEOLP: Non-erosive oral lichen planus |
| OSCC: Oral squamous cell carcinoma |
| Prostate |  | BPH: Benign Prostatic Hyperplasia |
| Thyroid | 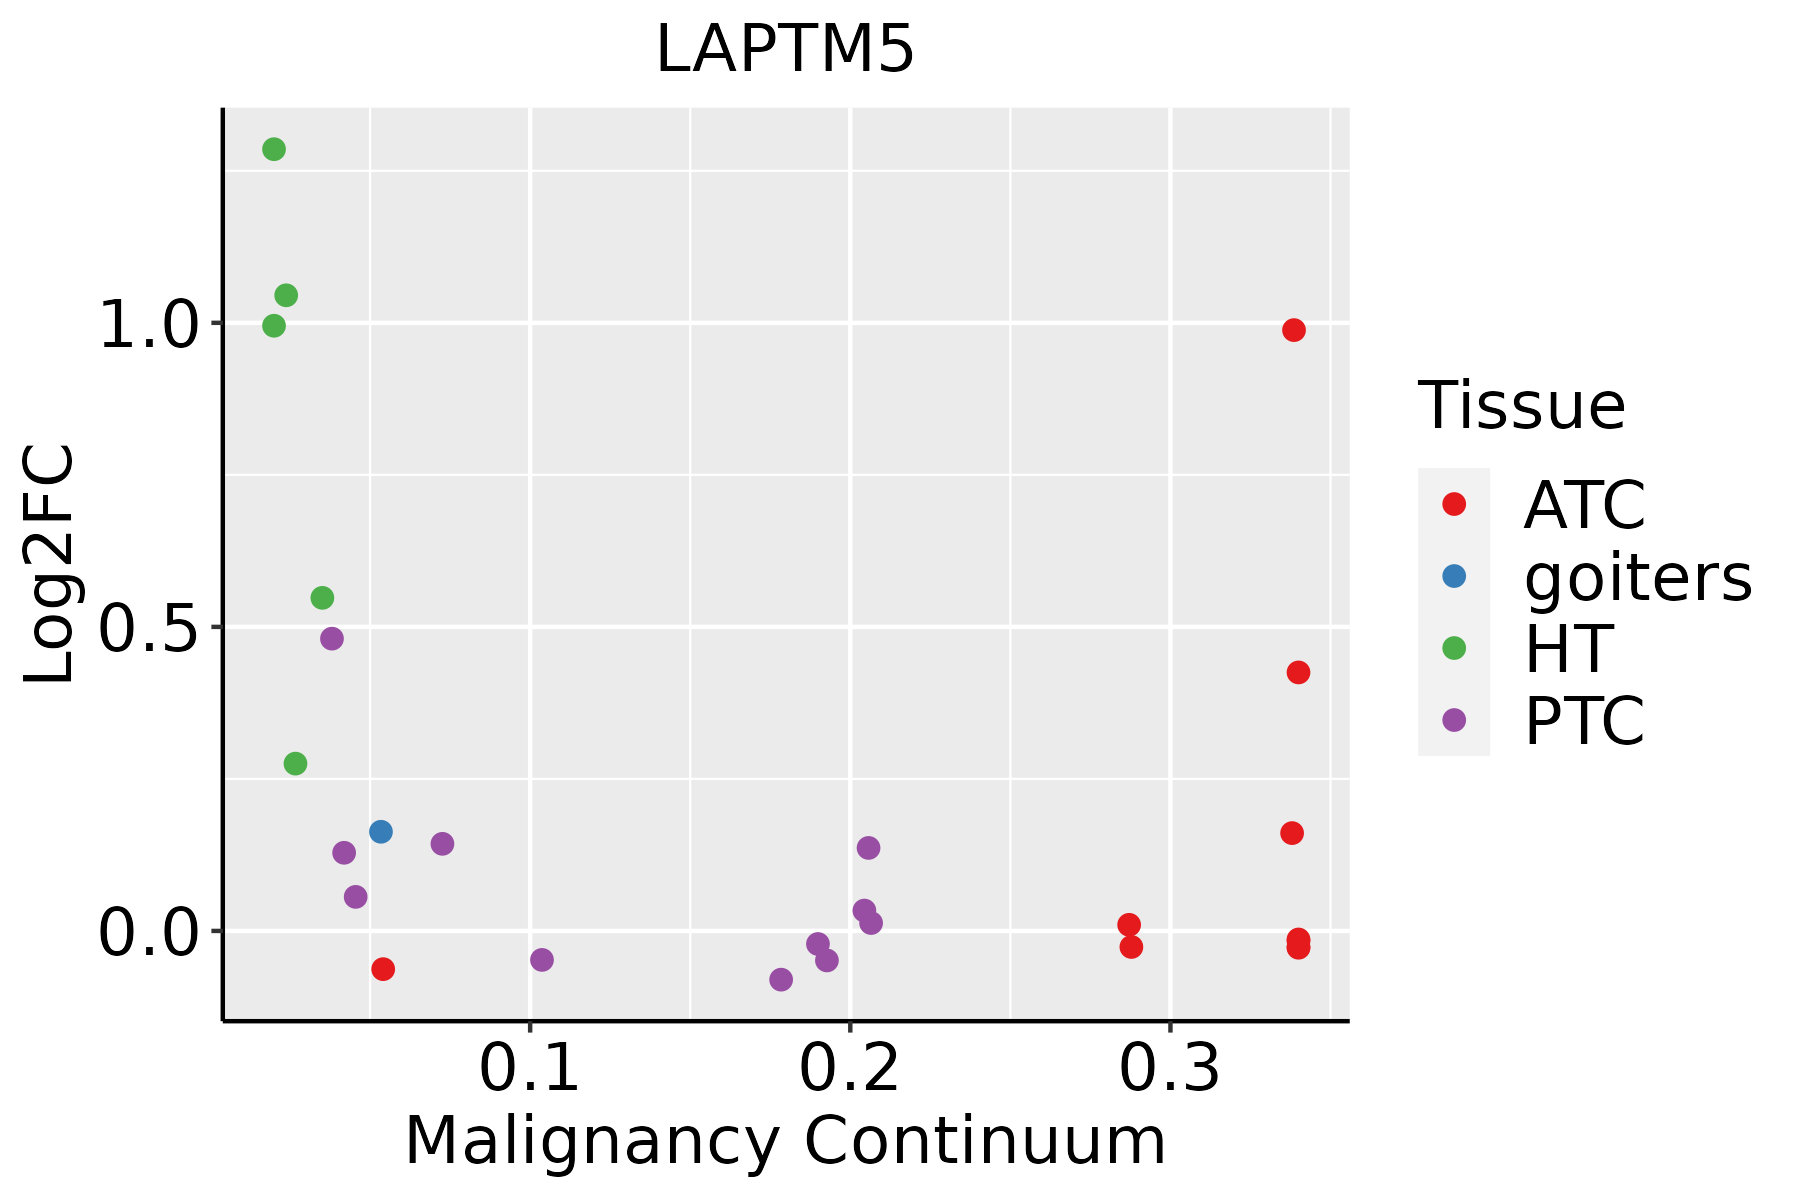 | ATC: Anaplastic thyroid cancer |
| HT: Hashimoto's thyroiditis |
| PTC: Papillary thyroid cancer |
| GO ID | Tissue | Disease Stage | Description | Gene Ratio | Bg Ratio | pvalue | p.adjust | Count |
| GO:005254714 | Breast | IDC | regulation of peptidase activity | 96/1434 | 461/18723 | 7.58e-20 | 6.15e-17 | 96 |
| GO:005254814 | Breast | IDC | regulation of endopeptidase activity | 88/1434 | 432/18723 | 1.20e-17 | 4.85e-15 | 88 |
| GO:200011614 | Breast | IDC | regulation of cysteine-type endopeptidase activity | 55/1434 | 235/18723 | 4.25e-14 | 1.21e-11 | 55 |
| GO:004328114 | Breast | IDC | regulation of cysteine-type endopeptidase activity involved in apoptotic process | 50/1434 | 209/18723 | 2.49e-13 | 6.14e-11 | 50 |
| GO:004586214 | Breast | IDC | positive regulation of proteolysis | 66/1434 | 372/18723 | 9.76e-11 | 1.29e-08 | 66 |
| GO:001095214 | Breast | IDC | positive regulation of peptidase activity | 40/1434 | 197/18723 | 1.04e-08 | 7.67e-07 | 40 |
| GO:004217614 | Breast | IDC | regulation of protein catabolic process | 63/1434 | 391/18723 | 1.32e-08 | 9.61e-07 | 63 |
| GO:190336214 | Breast | IDC | regulation of cellular protein catabolic process | 46/1434 | 255/18723 | 4.00e-08 | 2.68e-06 | 46 |
| GO:190305014 | Breast | IDC | regulation of proteolysis involved in cellular protein catabolic process | 41/1434 | 221/18723 | 9.77e-08 | 5.84e-06 | 41 |
| GO:004328013 | Breast | IDC | positive regulation of cysteine-type endopeptidase activity involved in apoptotic process | 29/1434 | 129/18723 | 1.10e-07 | 6.35e-06 | 29 |
| GO:190332014 | Breast | IDC | regulation of protein modification by small protein conjugation or removal | 43/1434 | 242/18723 | 1.71e-07 | 9.16e-06 | 43 |
| GO:200105613 | Breast | IDC | positive regulation of cysteine-type endopeptidase activity | 31/1434 | 148/18723 | 2.22e-07 | 1.17e-05 | 31 |
| GO:001095013 | Breast | IDC | positive regulation of endopeptidase activity | 35/1434 | 179/18723 | 2.24e-07 | 1.17e-05 | 35 |
| GO:003139614 | Breast | IDC | regulation of protein ubiquitination | 37/1434 | 210/18723 | 1.50e-06 | 6.36e-05 | 37 |
| GO:000691911 | Breast | IDC | activation of cysteine-type endopeptidase activity involved in apoptotic process | 19/1434 | 78/18723 | 4.75e-06 | 1.63e-04 | 19 |
| GO:190336414 | Breast | IDC | positive regulation of cellular protein catabolic process | 29/1434 | 155/18723 | 5.93e-06 | 1.90e-04 | 29 |
| GO:200005814 | Breast | IDC | regulation of ubiquitin-dependent protein catabolic process | 30/1434 | 164/18723 | 6.62e-06 | 2.05e-04 | 30 |
| GO:004573214 | Breast | IDC | positive regulation of protein catabolic process | 37/1434 | 231/18723 | 1.46e-05 | 3.71e-04 | 37 |
| GO:004211012 | Breast | IDC | T cell activation | 64/1434 | 487/18723 | 1.49e-05 | 3.77e-04 | 64 |
| GO:190305213 | Breast | IDC | positive regulation of proteolysis involved in cellular protein catabolic process | 25/1434 | 133/18723 | 2.34e-05 | 5.59e-04 | 25 |
| Hugo Symbol | Variant Class | Variant Classification | dbSNP RS | HGVSc | HGVSp | HGVSp Short | SWISSPROT | BIOTYPE | SIFT | PolyPhen | Tumor Sample Barcode | Tissue | Histology | Sex | Age | Stage | Therapy Types | Drugs | Outcome |
| LAPTM5 | SNV | Missense_Mutation | rs755216643 | c.67G>A | p.Ala23Thr | p.A23T | Q13571 | protein_coding | tolerated(0.48) | benign(0.079) | TCGA-2W-A8YY-01 | Cervix | cervical & endocervical cancer | Female | <65 | I/II | Chemotherapy | cisplatin | CR |
| LAPTM5 | SNV | Missense_Mutation | rs747955844 | c.382N>T | p.Arg128Cys | p.R128C | Q13571 | protein_coding | tolerated(0.07) | probably_damaging(0.939) | TCGA-VS-A9UL-01 | Cervix | cervical & endocervical cancer | Female | >=65 | III/IV | Unknown | Unknown | PD |
| LAPTM5 | SNV | Missense_Mutation | | c.561G>T | p.Met187Ile | p.M187I | Q13571 | protein_coding | tolerated(0.4) | benign(0.003) | TCGA-AA-3977-01 | Colorectum | colon adenocarcinoma | Male | >=65 | I/II | Unknown | Unknown | SD |
| LAPTM5 | SNV | Missense_Mutation | novel | c.470A>C | p.Glu157Ala | p.E157A | Q13571 | protein_coding | tolerated(0.19) | possibly_damaging(0.771) | TCGA-A5-A1OF-01 | Endometrium | uterine corpus endometrioid carcinoma | Female | <65 | I/II | Unknown | Unknown | SD |
| LAPTM5 | SNV | Missense_Mutation | | c.763N>T | p.Ala255Ser | p.A255S | Q13571 | protein_coding | tolerated(0.31) | possibly_damaging(0.818) | TCGA-AP-A059-01 | Endometrium | uterine corpus endometrioid carcinoma | Female | >=65 | I/II | Unknown | Unknown | SD |
| LAPTM5 | SNV | Missense_Mutation | | c.114G>T | p.Glu38Asp | p.E38D | Q13571 | protein_coding | tolerated(0.2) | probably_damaging(0.993) | TCGA-B5-A0JY-01 | Endometrium | uterine corpus endometrioid carcinoma | Female | <65 | III/IV | Chemotherapy | doxorubicin | SD |
| LAPTM5 | SNV | Missense_Mutation | novel | c.236N>A | p.Ser79Asn | p.S79N | Q13571 | protein_coding | tolerated(0.35) | benign(0.015) | TCGA-B5-A3FA-01 | Endometrium | uterine corpus endometrioid carcinoma | Female | >=65 | I/II | Unknown | Unknown | SD |
| LAPTM5 | SNV | Missense_Mutation | rs369470045 | c.58N>A | p.Ala20Thr | p.A20T | Q13571 | protein_coding | deleterious(0.01) | possibly_damaging(0.794) | TCGA-BS-A0UV-01 | Endometrium | uterine corpus endometrioid carcinoma | Female | <65 | III/IV | Unknown | Unknown | SD |
| LAPTM5 | SNV | Missense_Mutation | | c.558N>T | p.Lys186Asn | p.K186N | Q13571 | protein_coding | tolerated(0.09) | benign(0.009) | TCGA-D1-A103-01 | Endometrium | uterine corpus endometrioid carcinoma | Female | >=65 | I/II | Unknown | Unknown | SD |
| LAPTM5 | SNV | Missense_Mutation | rs183822203 | c.250N>A | p.Val84Ile | p.V84I | Q13571 | protein_coding | tolerated(0.1) | possibly_damaging(0.472) | TCGA-D1-A103-01 | Endometrium | uterine corpus endometrioid carcinoma | Female | >=65 | I/II | Unknown | Unknown | SD |


