
|
|||||
|
 | |
| |
| |
| |
| |
| |
|
Gene: LAPTM4B |
Gene summary for LAPTM4B |
| Gene information | Species | Human | Gene symbol | LAPTM4B | Gene ID | 55353 |
| Gene name | lysosomal protein transmembrane 4 beta | |
| Gene Alias | LAPTM4beta | |
| Cytomap | 8q22.1 | |
| Gene Type | protein-coding | GO ID | GO:0001816 | UniProtAcc | Q86VI4 |
Top |
Malignant transformation analysis |
| Identification of the aberrant gene expression in precancerous and cancerous lesions by comparing the gene expression of stem-like cells in diseased tissues with normal stem cells |
| Entrez ID | Symbol | Replicates | Species | Organ | Tissue | Adj P-value | Log2FC | Malignancy |
| 55353 | LAPTM4B | GSM4909281 | Human | Breast | IDC | 6.87e-73 | 1.03e+00 | 0.21 |
| 55353 | LAPTM4B | GSM4909282 | Human | Breast | IDC | 3.38e-18 | 4.73e-01 | -0.0288 |
| 55353 | LAPTM4B | GSM4909285 | Human | Breast | IDC | 1.16e-12 | 3.92e-01 | 0.21 |
| 55353 | LAPTM4B | GSM4909286 | Human | Breast | IDC | 3.24e-35 | 6.72e-01 | 0.1081 |
| 55353 | LAPTM4B | GSM4909287 | Human | Breast | IDC | 8.54e-10 | 5.14e-01 | 0.2057 |
| 55353 | LAPTM4B | GSM4909290 | Human | Breast | IDC | 6.99e-32 | 9.14e-01 | 0.2096 |
| 55353 | LAPTM4B | GSM4909291 | Human | Breast | IDC | 2.33e-14 | 6.65e-01 | 0.1753 |
| 55353 | LAPTM4B | GSM4909293 | Human | Breast | IDC | 1.98e-34 | 6.84e-01 | 0.1581 |
| 55353 | LAPTM4B | GSM4909296 | Human | Breast | IDC | 2.24e-08 | -1.56e-01 | 0.1524 |
| 55353 | LAPTM4B | GSM4909297 | Human | Breast | IDC | 7.43e-08 | 3.15e-02 | 0.1517 |
| 55353 | LAPTM4B | GSM4909301 | Human | Breast | IDC | 1.03e-03 | -8.69e-02 | 0.1577 |
| 55353 | LAPTM4B | GSM4909304 | Human | Breast | IDC | 5.55e-03 | 2.18e-01 | 0.1636 |
| 55353 | LAPTM4B | GSM4909311 | Human | Breast | IDC | 2.70e-17 | 9.30e-03 | 0.1534 |
| 55353 | LAPTM4B | GSM4909312 | Human | Breast | IDC | 1.25e-09 | 8.07e-02 | 0.1552 |
| 55353 | LAPTM4B | GSM4909319 | Human | Breast | IDC | 7.60e-31 | 9.91e-02 | 0.1563 |
| 55353 | LAPTM4B | GSM4909321 | Human | Breast | IDC | 9.93e-12 | -1.18e-01 | 0.1559 |
| 55353 | LAPTM4B | brca1 | Human | Breast | Precancer | 2.82e-05 | 2.55e-01 | -0.0338 |
| 55353 | LAPTM4B | brca2 | Human | Breast | Precancer | 3.67e-04 | 1.98e-01 | -0.024 |
| 55353 | LAPTM4B | M2 | Human | Breast | IDC | 3.65e-02 | 1.94e-01 | 0.21 |
| 55353 | LAPTM4B | NCCBC14 | Human | Breast | DCIS | 4.62e-11 | -1.96e-01 | 0.2021 |
| Page: 1 2 3 4 5 6 7 8 9 10 |
| Tissue | Expression Dynamics | Abbreviation |
| Breast | 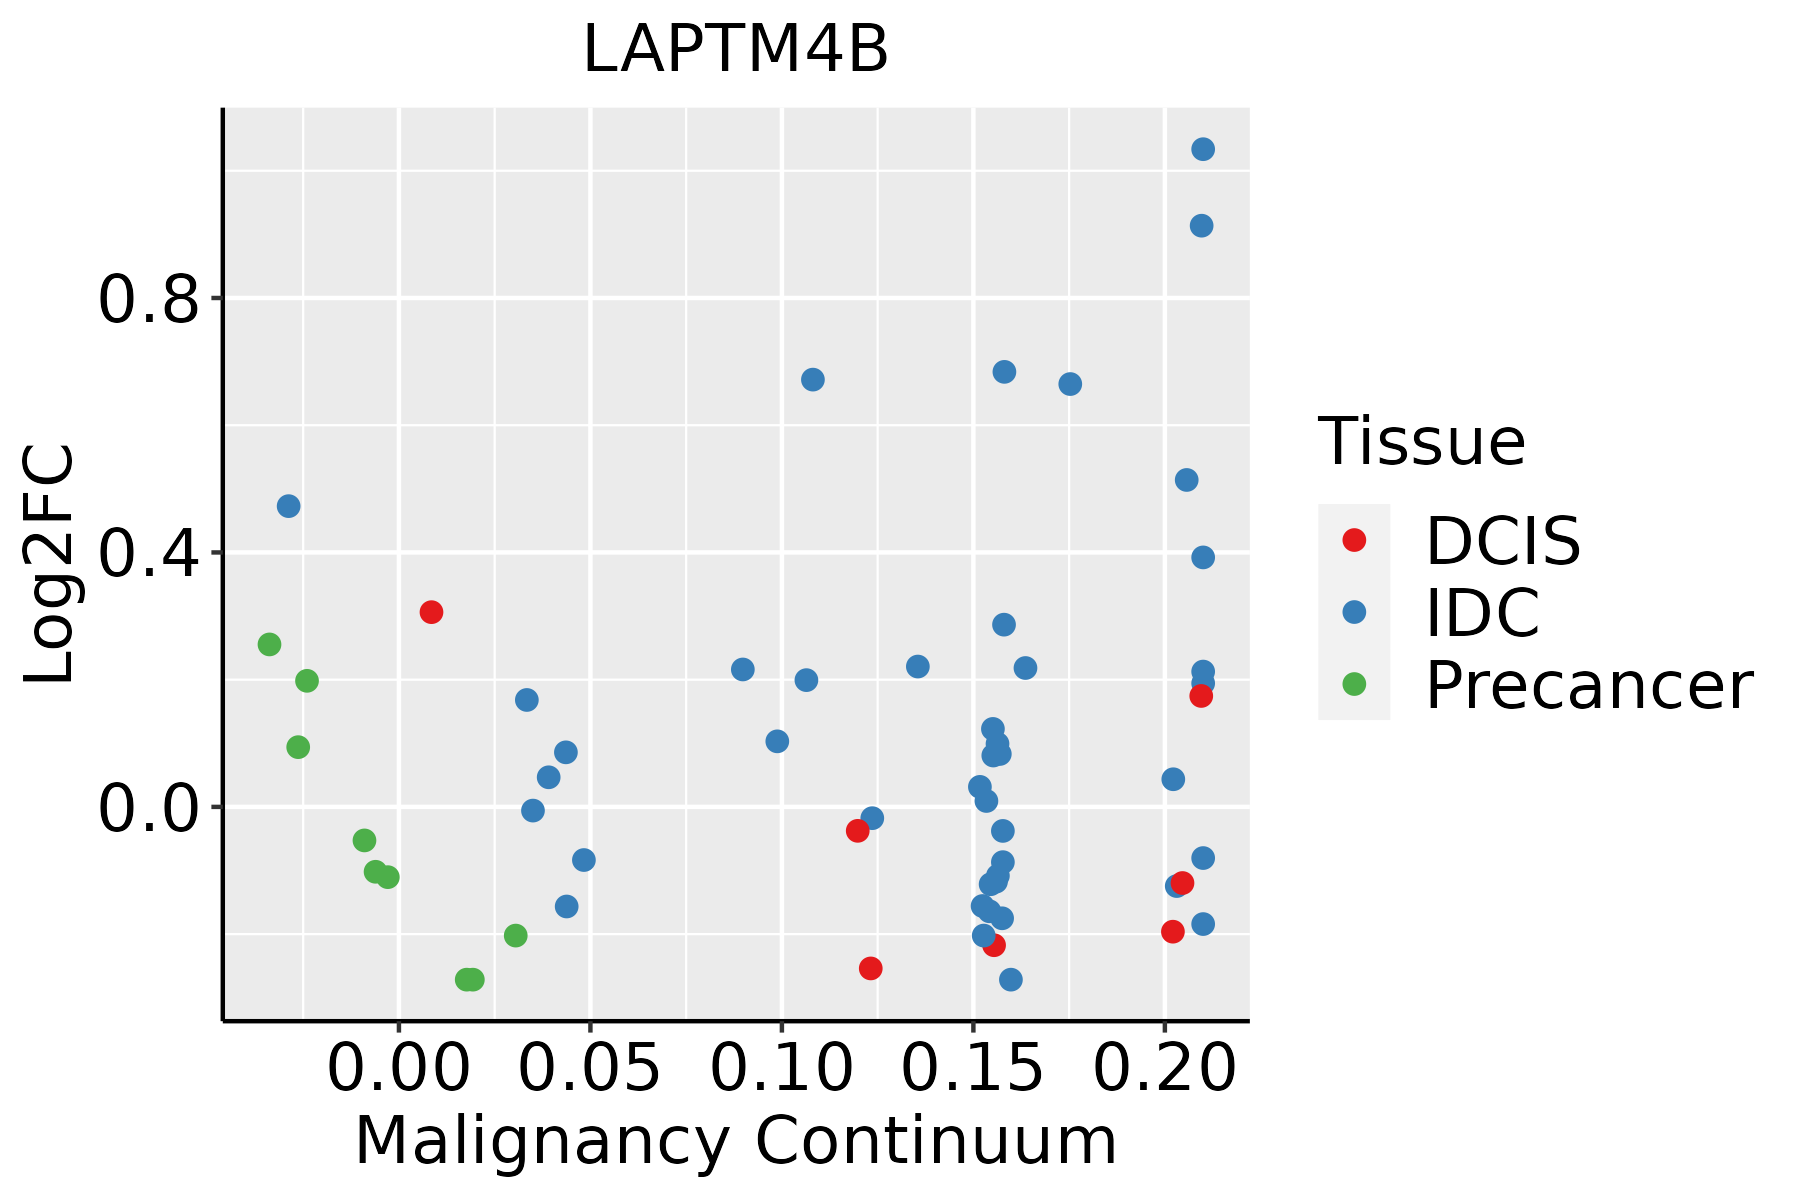 | IDC: Invasive ductal carcinoma |
| DCIS: Ductal carcinoma in situ | ||
| Precancer(BRCA1-mut): Precancerous lesion from BRCA1 mutation carriers | ||
| Colorectum (GSE201348) |  | FAP: Familial adenomatous polyposis |
| CRC: Colorectal cancer | ||
| Colorectum (HTA11) |  | AD: Adenomas |
| SER: Sessile serrated lesions | ||
| MSI-H: Microsatellite-high colorectal cancer | ||
| MSS: Microsatellite stable colorectal cancer | ||
| Endometrium | 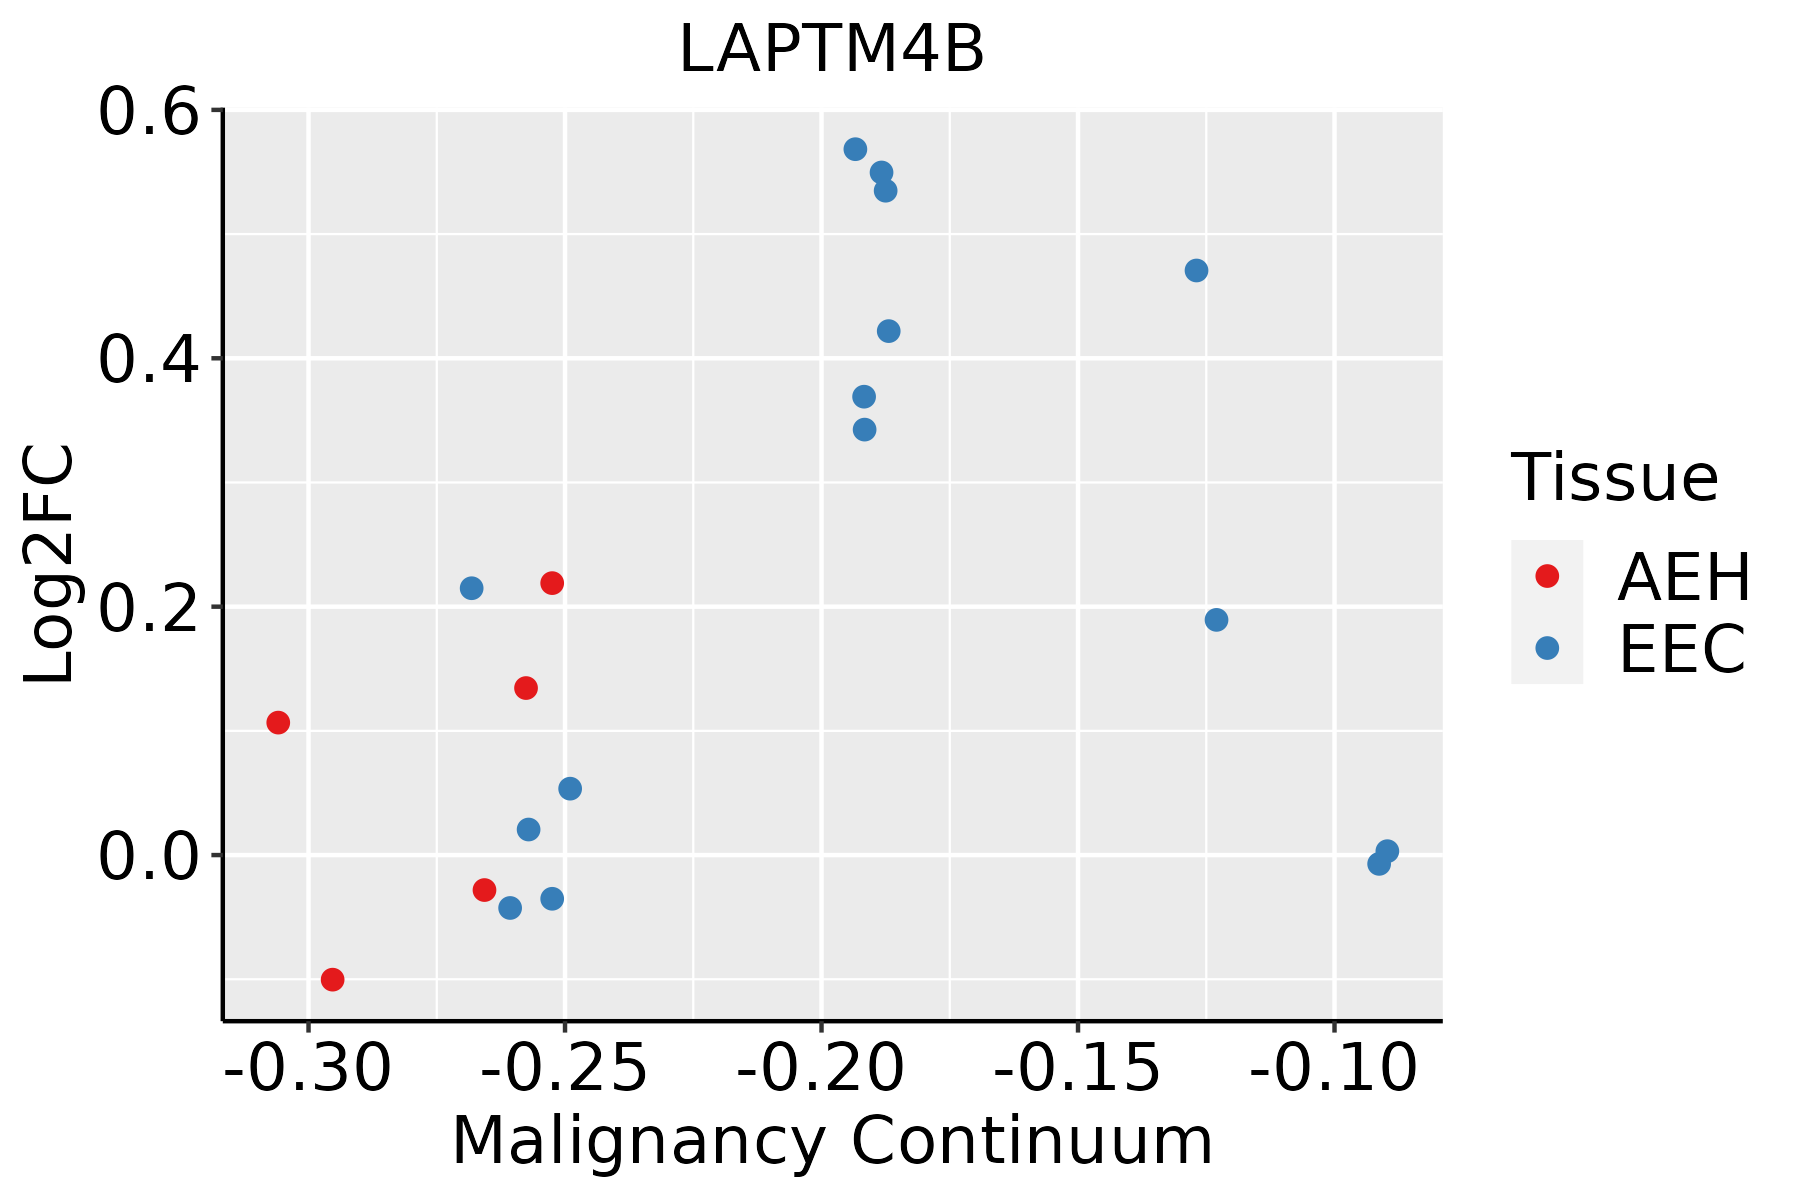 | AEH: Atypical endometrial hyperplasia |
| EEC: Endometrioid Cancer | ||
| Esophagus | 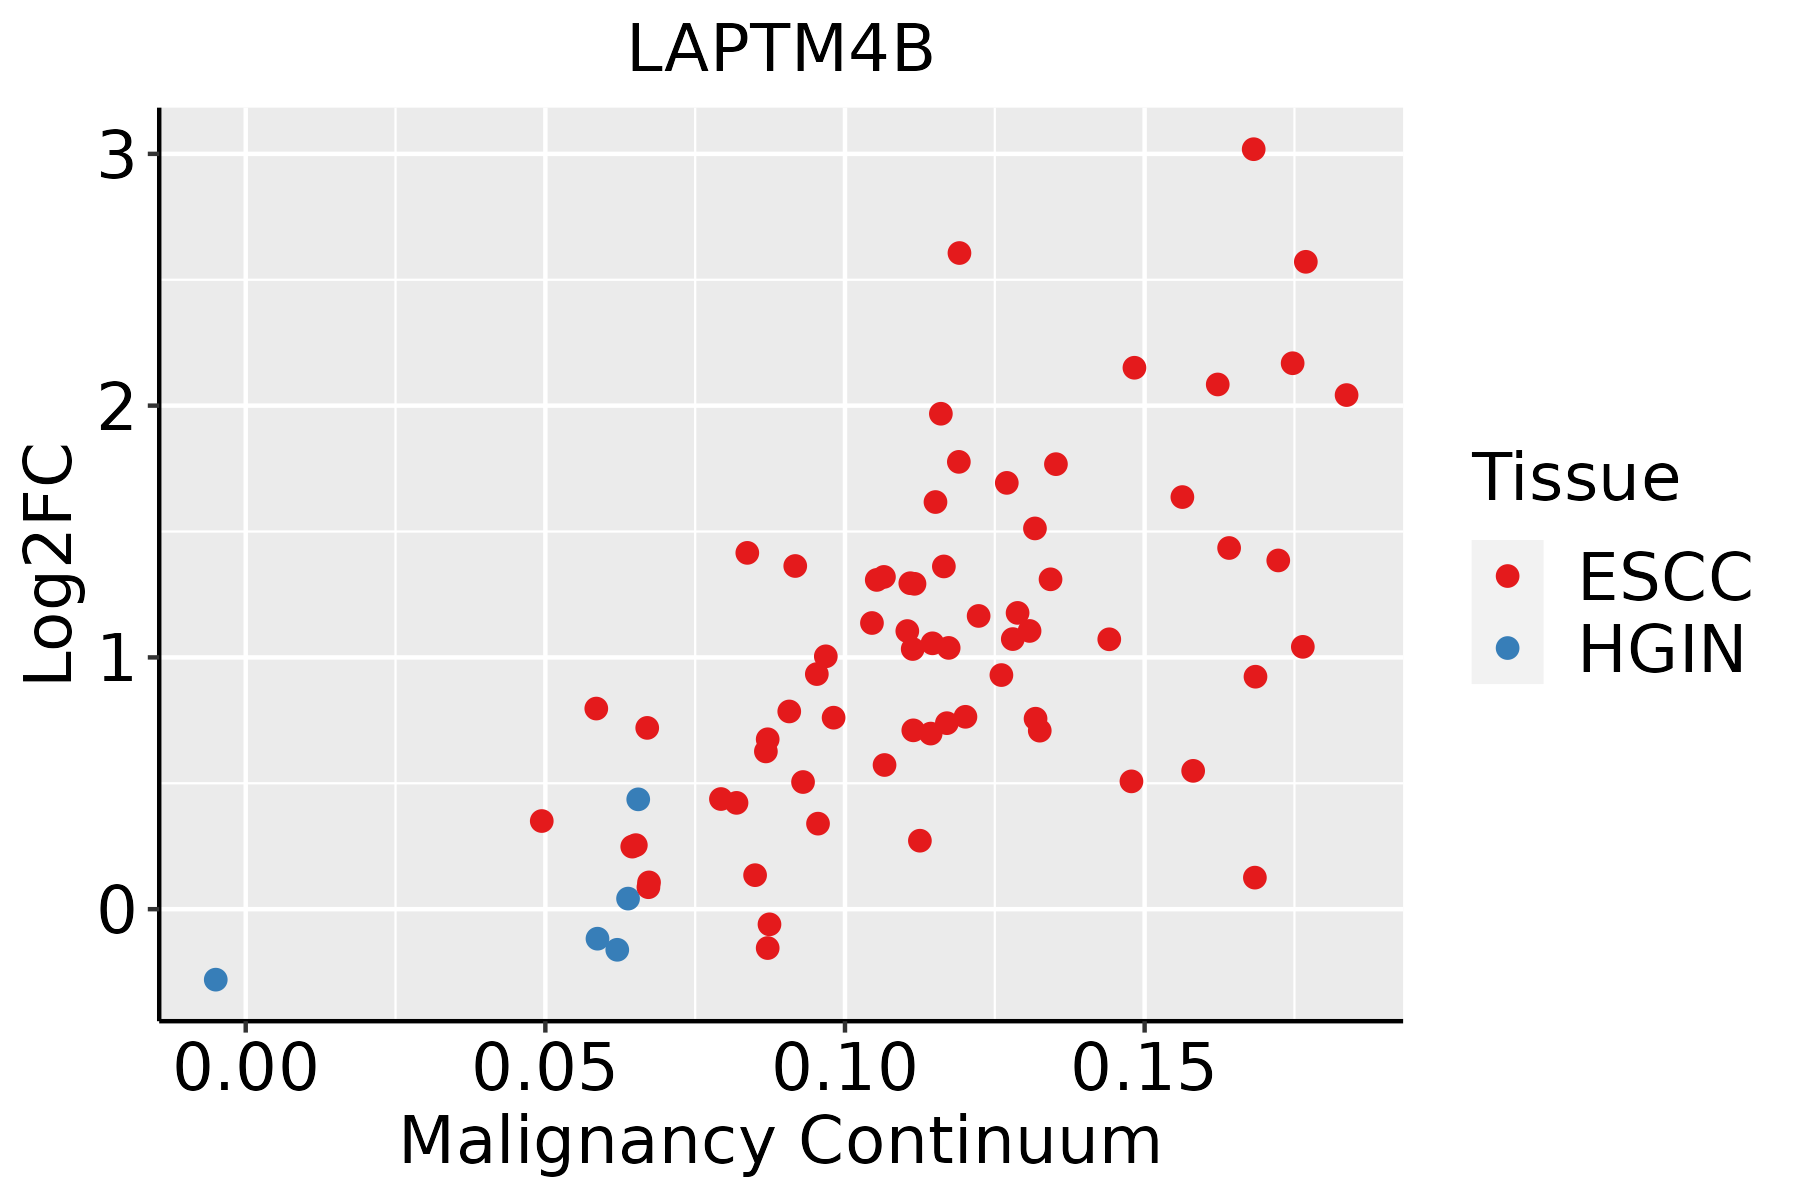 | ESCC: Esophageal squamous cell carcinoma |
| HGIN: High-grade intraepithelial neoplasias | ||
| LGIN: Low-grade intraepithelial neoplasias | ||
| Liver | 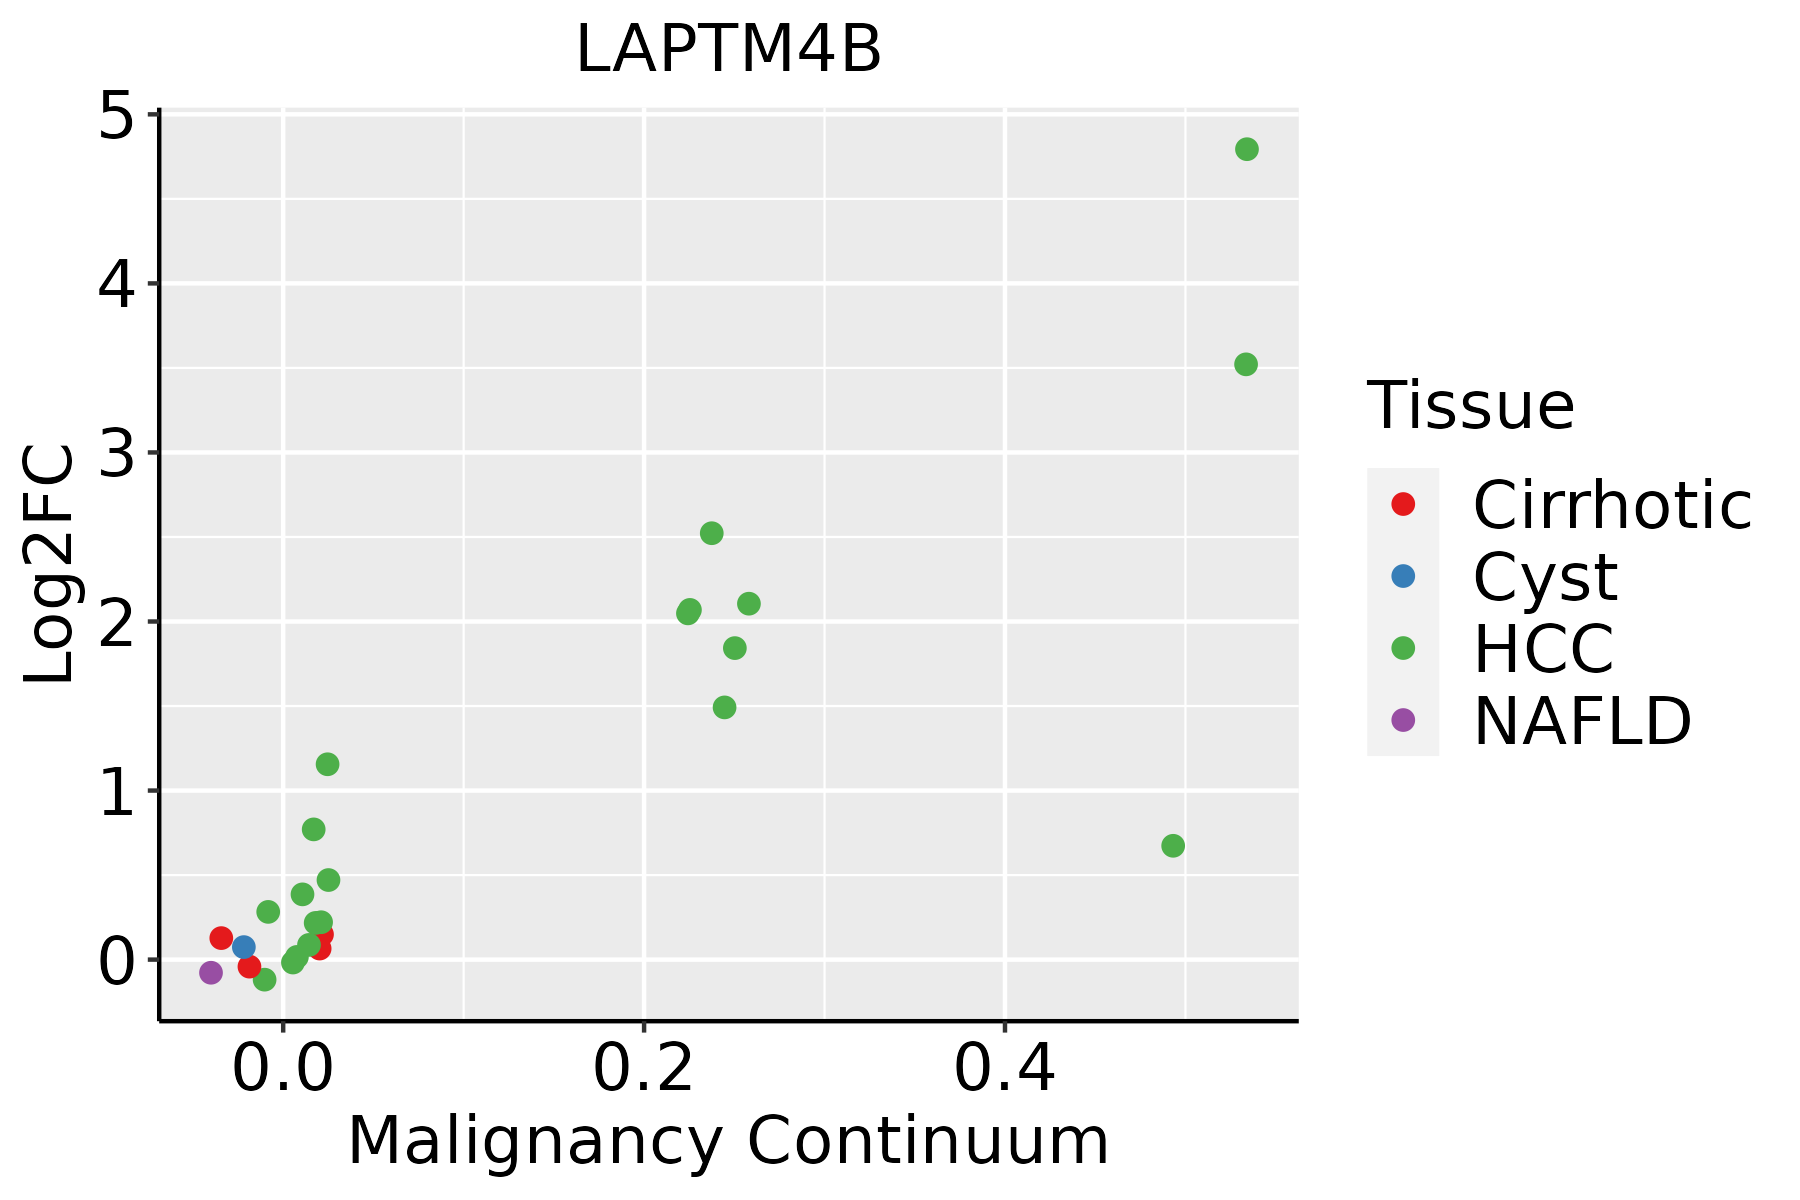 | HCC: Hepatocellular carcinoma |
| NAFLD: Non-alcoholic fatty liver disease | ||
| Lung | 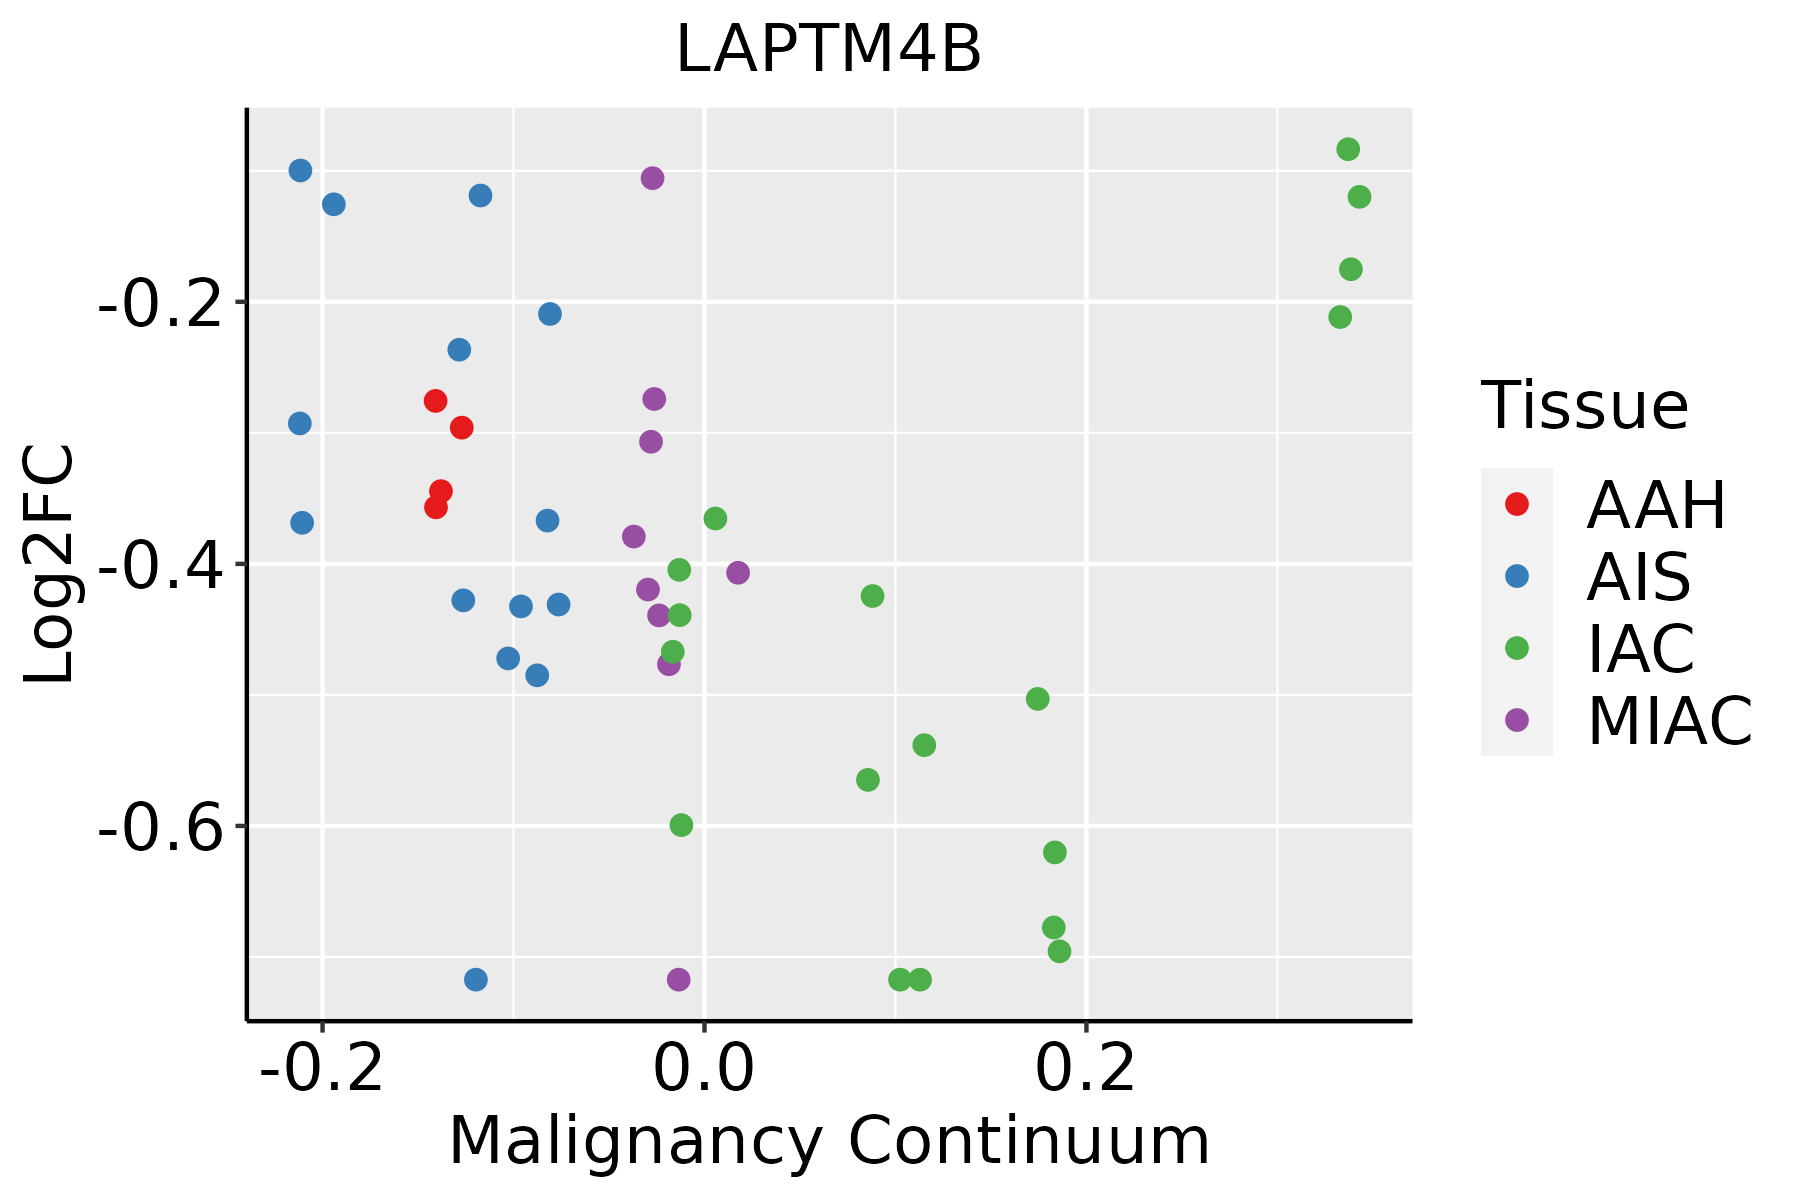 | AAH: Atypical adenomatous hyperplasia |
| AIS: Adenocarcinoma in situ | ||
| IAC: Invasive lung adenocarcinoma | ||
| MIA: Minimally invasive adenocarcinoma | ||
| Oral Cavity | 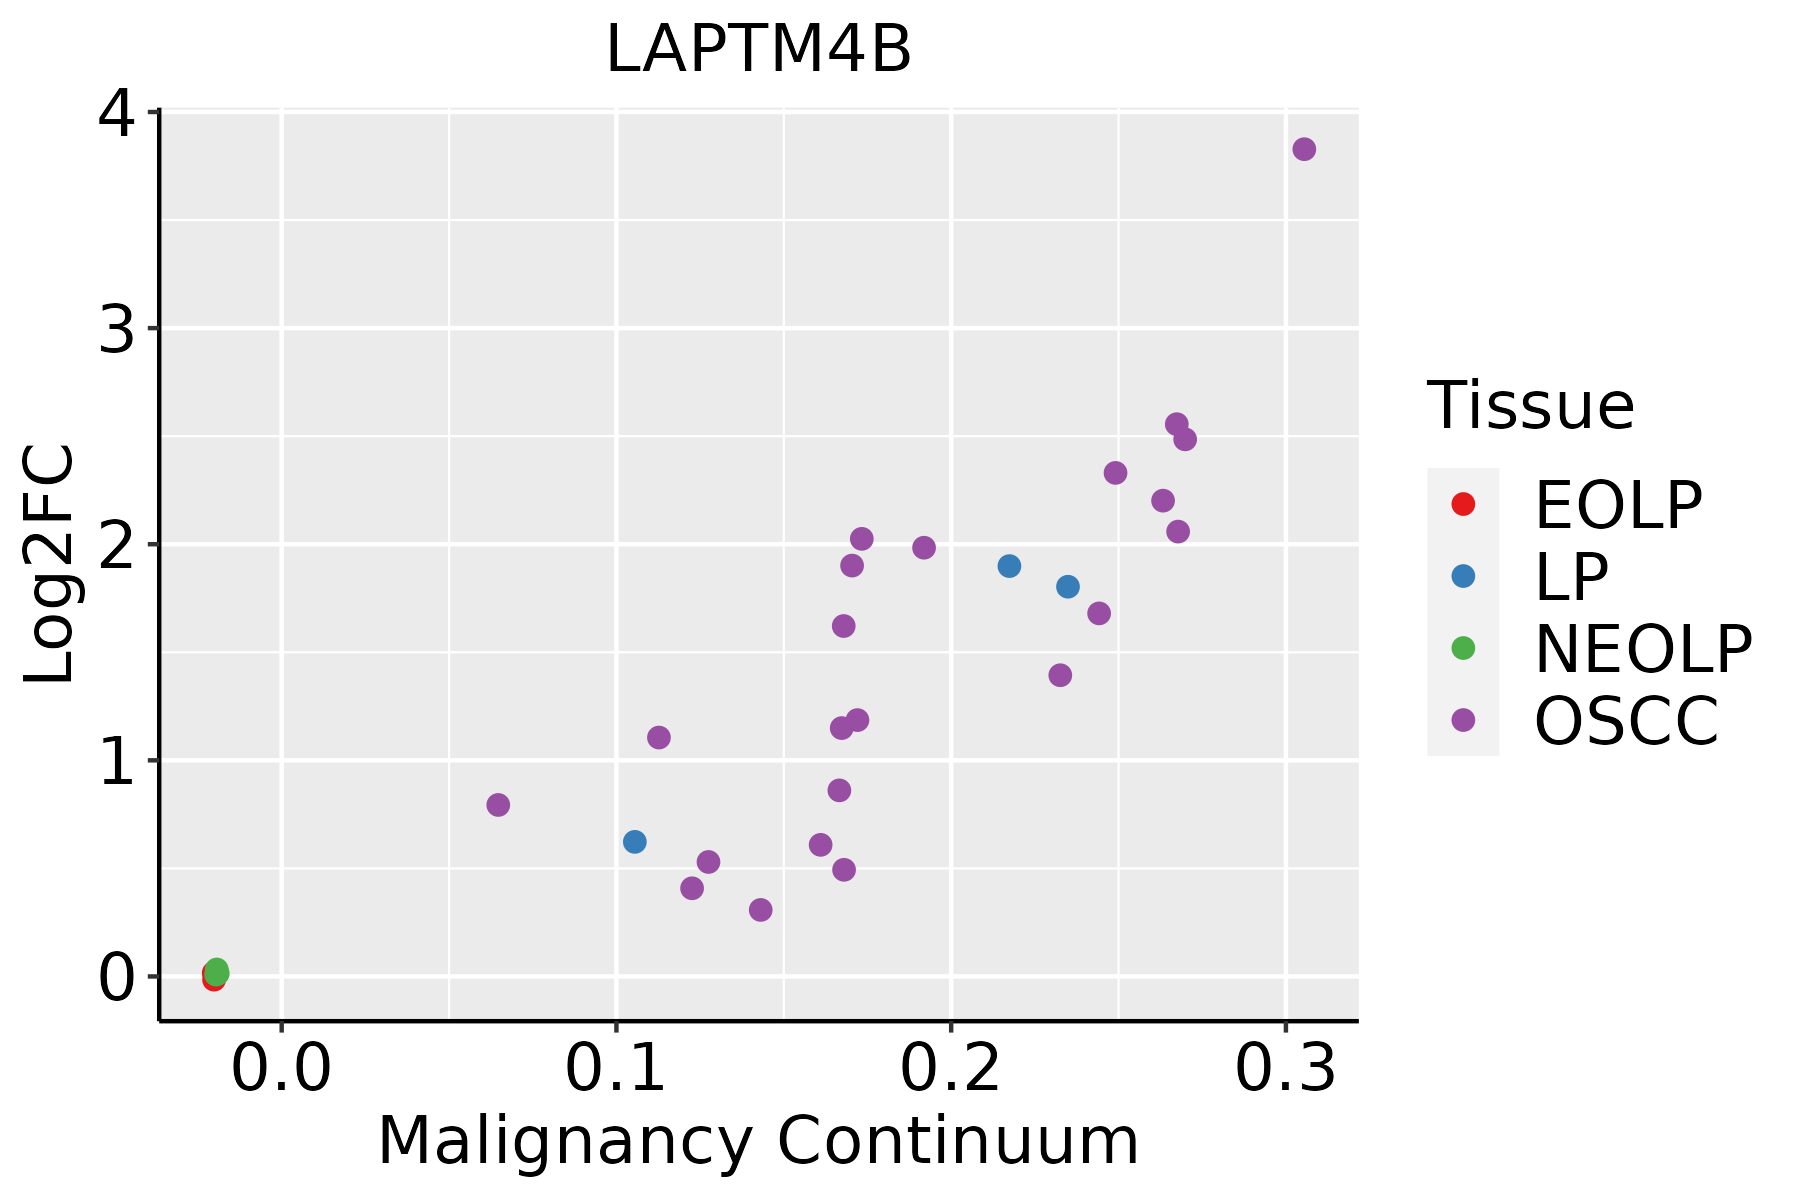 | EOLP: Erosive Oral lichen planus |
| LP: leukoplakia | ||
| NEOLP: Non-erosive oral lichen planus | ||
| OSCC: Oral squamous cell carcinoma | ||
| Skin | 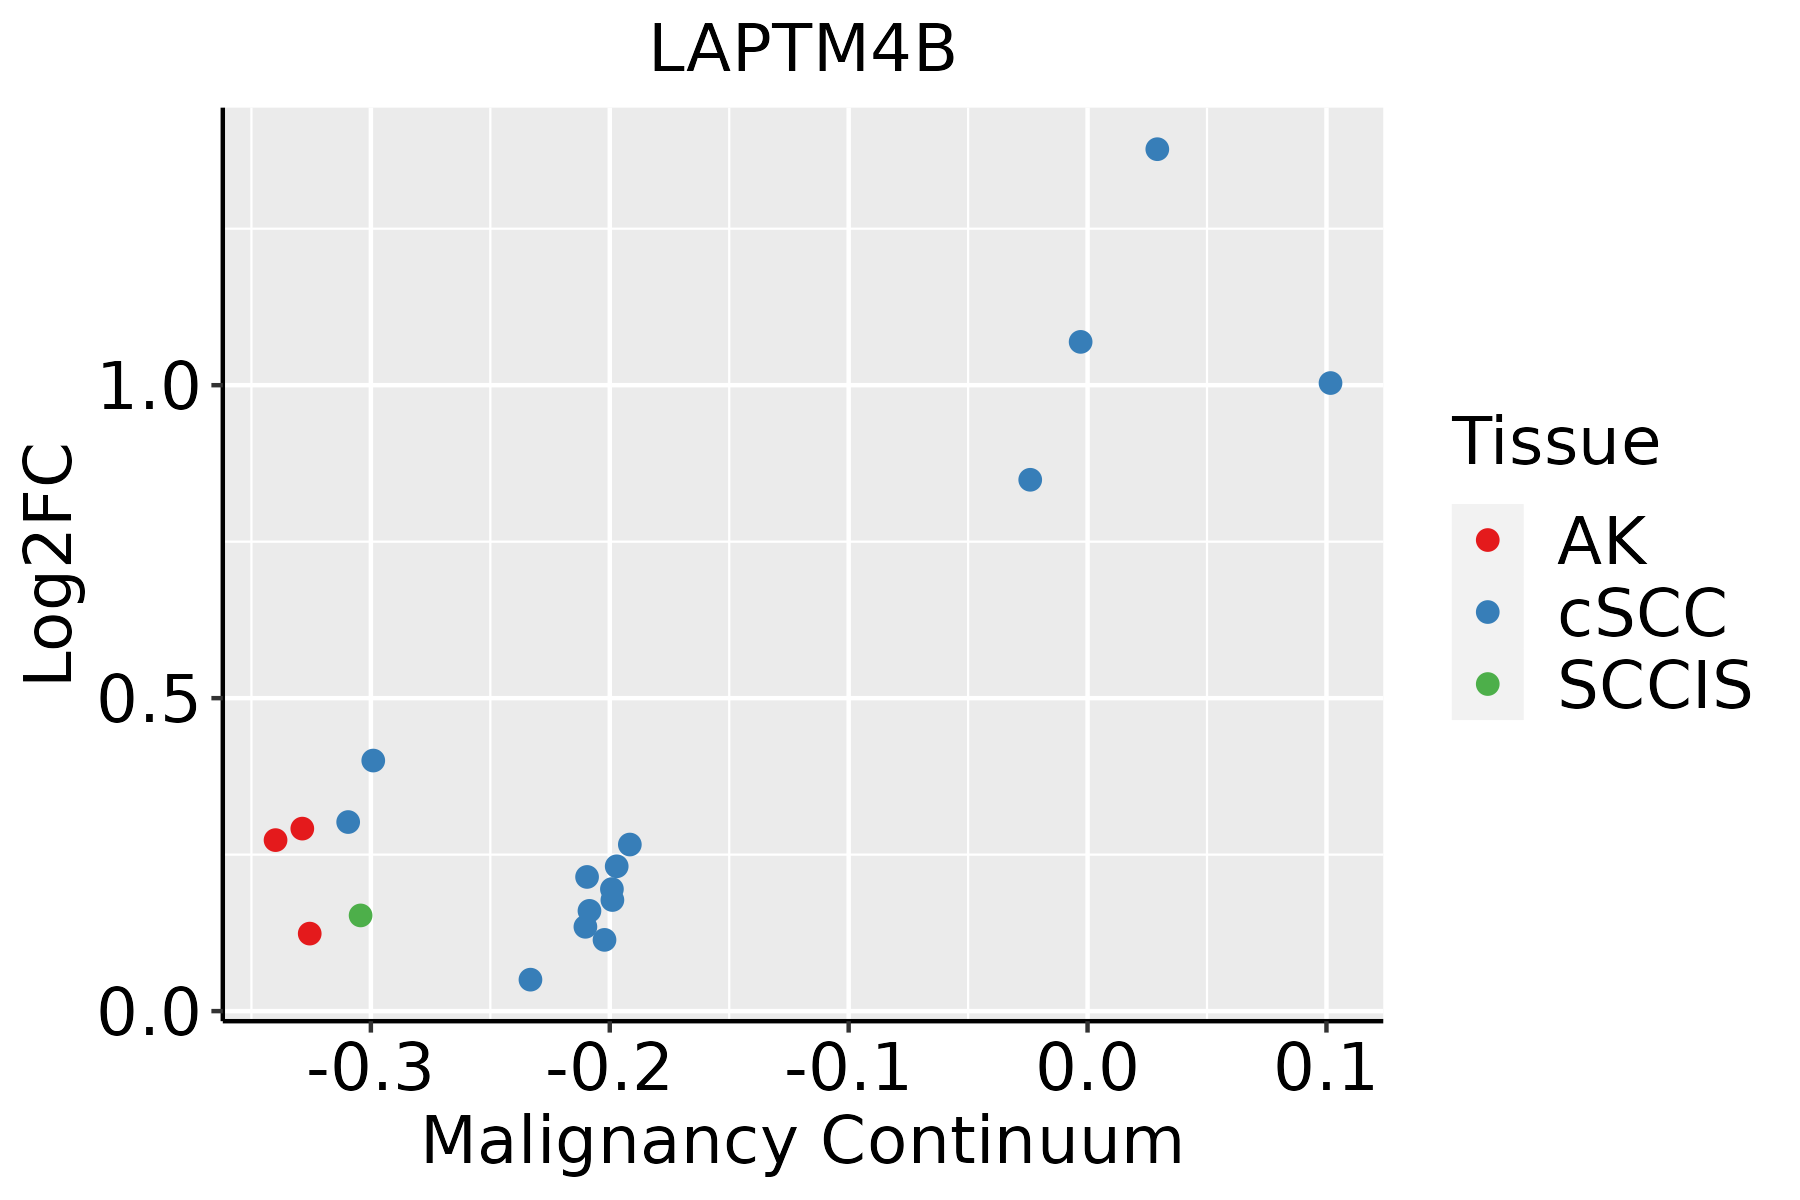 | AK: Actinic keratosis |
| cSCC: Cutaneous squamous cell carcinoma | ||
| SCCIS:squamous cell carcinoma in situ | ||
| Thyroid |  | ATC: Anaplastic thyroid cancer |
| HT: Hashimoto's thyroiditis | ||
| PTC: Papillary thyroid cancer |
| ∗log2FC in expression of this searched gene in stem-like cells from each diseased tissue sample relative to stem-like cells in normal samples in each tissue plotted against the malignancy continuum. Samples are colored based on if they are from different disease stage. |
Top |
Malignant transformation related pathway analysis |
| Find out the enriched GO biological processes and KEGG pathways involved in transition from healthy to precancer to cancer |
| Tissue | Disease Stage | Enriched GO biological Processes |
| Colorectum | AD |  |
| Colorectum | SER |  |
| Colorectum | MSS |  |
| Colorectum | MSI-H |  |
| Colorectum | FAP |  |
| ∗Top 15 enriched GO BP terms are showed in the bar plot of each disease state in each tissue. Each row represents a significant GO biological process which is colored according to the -log10(p.adjust). |
| Page: 1 2 3 4 5 6 7 8 9 |
| GO ID | Tissue | Disease Stage | Description | Gene Ratio | Bg Ratio | pvalue | p.adjust | Count |
| GO:19033629 | Breast | Precancer | regulation of cellular protein catabolic process | 36/1080 | 255/18723 | 6.03e-07 | 2.55e-05 | 36 |
| GO:00421769 | Breast | Precancer | regulation of protein catabolic process | 47/1080 | 391/18723 | 1.50e-06 | 5.58e-05 | 47 |
| GO:00313309 | Breast | Precancer | negative regulation of cellular catabolic process | 34/1080 | 262/18723 | 8.16e-06 | 2.20e-04 | 34 |
| GO:00905595 | Breast | Precancer | regulation of membrane permeability | 15/1080 | 78/18723 | 3.35e-05 | 7.29e-04 | 15 |
| GO:19033638 | Breast | Precancer | negative regulation of cellular protein catabolic process | 14/1080 | 75/18723 | 8.54e-05 | 1.63e-03 | 14 |
| GO:00098959 | Breast | Precancer | negative regulation of catabolic process | 36/1080 | 320/18723 | 9.92e-05 | 1.83e-03 | 36 |
| GO:00421779 | Breast | Precancer | negative regulation of protein catabolic process | 17/1080 | 121/18723 | 5.76e-04 | 7.28e-03 | 17 |
| GO:004217614 | Breast | IDC | regulation of protein catabolic process | 63/1434 | 391/18723 | 1.32e-08 | 9.61e-07 | 63 |
| GO:190336214 | Breast | IDC | regulation of cellular protein catabolic process | 46/1434 | 255/18723 | 4.00e-08 | 2.68e-06 | 46 |
| GO:009055913 | Breast | IDC | regulation of membrane permeability | 17/1434 | 78/18723 | 6.88e-05 | 1.40e-03 | 17 |
| GO:003133014 | Breast | IDC | negative regulation of cellular catabolic process | 37/1434 | 262/18723 | 2.20e-04 | 3.52e-03 | 37 |
| GO:190336313 | Breast | IDC | negative regulation of cellular protein catabolic process | 15/1434 | 75/18723 | 4.86e-04 | 6.42e-03 | 15 |
| GO:004217714 | Breast | IDC | negative regulation of protein catabolic process | 20/1434 | 121/18723 | 8.51e-04 | 9.92e-03 | 20 |
| GO:000989514 | Breast | IDC | negative regulation of catabolic process | 40/1434 | 320/18723 | 1.49e-03 | 1.50e-02 | 40 |
| GO:004217624 | Breast | DCIS | regulation of protein catabolic process | 62/1390 | 391/18723 | 9.98e-09 | 7.53e-07 | 62 |
| GO:190336224 | Breast | DCIS | regulation of cellular protein catabolic process | 46/1390 | 255/18723 | 1.56e-08 | 1.12e-06 | 46 |
| GO:009055922 | Breast | DCIS | regulation of membrane permeability | 17/1390 | 78/18723 | 4.66e-05 | 9.63e-04 | 17 |
| GO:003133024 | Breast | DCIS | negative regulation of cellular catabolic process | 37/1390 | 262/18723 | 1.18e-04 | 2.07e-03 | 37 |
| GO:190336323 | Breast | DCIS | negative regulation of cellular protein catabolic process | 15/1390 | 75/18723 | 3.49e-04 | 4.97e-03 | 15 |
| GO:004217722 | Breast | DCIS | negative regulation of protein catabolic process | 20/1390 | 121/18723 | 5.76e-04 | 7.34e-03 | 20 |
| Page: 1 2 3 4 5 6 7 8 9 10 11 12 13 14 |
| Pathway ID | Tissue | Disease Stage | Description | Gene Ratio | Bg Ratio | pvalue | p.adjust | qvalue | Count |
| hsa041426 | Esophagus | HGIN | Lysosome | 33/1383 | 132/8465 | 6.65e-03 | 4.37e-02 | 3.47e-02 | 33 |
| hsa0414213 | Esophagus | HGIN | Lysosome | 33/1383 | 132/8465 | 6.65e-03 | 4.37e-02 | 3.47e-02 | 33 |
| hsa0414222 | Esophagus | ESCC | Lysosome | 102/4205 | 132/8465 | 5.11e-11 | 7.13e-10 | 3.65e-10 | 102 |
| hsa0414232 | Esophagus | ESCC | Lysosome | 102/4205 | 132/8465 | 5.11e-11 | 7.13e-10 | 3.65e-10 | 102 |
| hsa041424 | Liver | Cirrhotic | Lysosome | 68/2530 | 132/8465 | 1.34e-07 | 1.97e-06 | 1.21e-06 | 68 |
| hsa0414211 | Liver | Cirrhotic | Lysosome | 68/2530 | 132/8465 | 1.34e-07 | 1.97e-06 | 1.21e-06 | 68 |
| hsa041422 | Liver | HCC | Lysosome | 100/4020 | 132/8465 | 2.32e-11 | 4.31e-10 | 2.40e-10 | 100 |
| hsa041423 | Liver | HCC | Lysosome | 100/4020 | 132/8465 | 2.32e-11 | 4.31e-10 | 2.40e-10 | 100 |
| hsa041425 | Oral cavity | OSCC | Lysosome | 87/3704 | 132/8465 | 1.97e-07 | 1.35e-06 | 6.86e-07 | 87 |
| hsa0414212 | Oral cavity | OSCC | Lysosome | 87/3704 | 132/8465 | 1.97e-07 | 1.35e-06 | 6.86e-07 | 87 |
| hsa0414221 | Oral cavity | LP | Lysosome | 67/2418 | 132/8465 | 5.13e-08 | 7.77e-07 | 5.01e-07 | 67 |
| hsa0414231 | Oral cavity | LP | Lysosome | 67/2418 | 132/8465 | 5.13e-08 | 7.77e-07 | 5.01e-07 | 67 |
| Page: 1 |
Top |
Cell-cell communication analysis |
| Identification of potential cell-cell interactions between two cell types and their ligand-receptor pairs for different disease states |
| Ligand | Receptor | LRpair | Pathway | Tissue | Disease Stage |
| Page: 1 |
Top |
Single-cell gene regulatory network inference analysis |
| Find out the significant the regulons (TFs) and the target genes of each regulon across cell types for different disease states |
| TF | Cell Type | Tissue | Disease Stage | Target Gene | RSS | Regulon Activity |
| ∗The dot plots of a searched regulon are shown for all cell subpopulations in each disease state of each tissue based on the regulon specific score inferred using pySCENIC and by calculating the average expression. |
| Page: 1 |
Top |
Somatic mutation of malignant transformation related genes |
| Annotation of somatic variants for genes involved in malignant transformation |
| Hugo Symbol | Variant Class | Variant Classification | dbSNP RS | HGVSc | HGVSp | HGVSp Short | SWISSPROT | BIOTYPE | SIFT | PolyPhen | Tumor Sample Barcode | Tissue | Histology | Sex | Age | Stage | Therapy Types | Drugs | Outcome |
| LAPTM4B | SNV | Missense_Mutation | c.671T>A | p.Ile224Lys | p.I224K | Q86VI4 | protein_coding | deleterious(0) | probably_damaging(0.917) | TCGA-A2-A0T1-01 | Breast | breast invasive carcinoma | Female | <65 | III/IV | Targeted Molecular therapy | herceptin | SD | |
| LAPTM4B | SNV | Missense_Mutation | c.482N>T | p.Ala161Val | p.A161V | Q86VI4 | protein_coding | tolerated(0.06) | probably_damaging(0.975) | TCGA-BH-A0BZ-01 | Breast | breast invasive carcinoma | Female | <65 | III/IV | Chemotherapy | doxorubicin | CR | |
| LAPTM4B | SNV | Missense_Mutation | novel | c.563N>A | p.Arg188His | p.R188H | Q86VI4 | protein_coding | tolerated(0.77) | benign(0.007) | TCGA-AA-3947-01 | Colorectum | colon adenocarcinoma | Female | <65 | I/II | Unknown | Unknown | SD |
| LAPTM4B | SNV | Missense_Mutation | c.511N>G | p.Leu171Val | p.L171V | Q86VI4 | protein_coding | tolerated(0.31) | benign(0.038) | TCGA-BM-6198-01 | Colorectum | rectum adenocarcinoma | Male | >=65 | III/IV | Chemotherapy | xeloda | SD | |
| LAPTM4B | SNV | Missense_Mutation | rs147058372 | c.815N>A | p.Arg272Gln | p.R272Q | Q86VI4 | protein_coding | deleterious(0.02) | probably_damaging(0.999) | TCGA-A5-A0G1-01 | Endometrium | uterine corpus endometrioid carcinoma | Female | >=65 | I/II | Unknown | Unknown | SD |
| LAPTM4B | SNV | Missense_Mutation | novel | c.585C>A | p.Phe195Leu | p.F195L | Q86VI4 | protein_coding | deleterious(0) | probably_damaging(0.995) | TCGA-A5-A2K5-01 | Endometrium | uterine corpus endometrioid carcinoma | Female | >=65 | I/II | Unknown | Unknown | SD |
| LAPTM4B | SNV | Missense_Mutation | novel | c.794N>A | p.Ser265Asn | p.S265N | Q86VI4 | protein_coding | tolerated(0.51) | possibly_damaging(0.828) | TCGA-AJ-A3EK-01 | Endometrium | uterine corpus endometrioid carcinoma | Female | <65 | I/II | Chemotherapy | carboplatin | CR |
| LAPTM4B | SNV | Missense_Mutation | c.811N>C | p.Tyr271His | p.Y271H | Q86VI4 | protein_coding | deleterious(0) | probably_damaging(0.999) | TCGA-AP-A054-01 | Endometrium | uterine corpus endometrioid carcinoma | Female | <65 | III/IV | Chemotherapy | carboplatin | PD | |
| LAPTM4B | SNV | Missense_Mutation | rs201585055 | c.674N>A | p.Arg225Gln | p.R225Q | Q86VI4 | protein_coding | tolerated(0.34) | benign(0.277) | TCGA-AP-A059-01 | Endometrium | uterine corpus endometrioid carcinoma | Female | >=65 | I/II | Unknown | Unknown | SD |
| LAPTM4B | SNV | Missense_Mutation | novel | c.461N>G | p.Asp154Gly | p.D154G | Q86VI4 | protein_coding | deleterious(0) | possibly_damaging(0.676) | TCGA-AX-A06F-01 | Endometrium | uterine corpus endometrioid carcinoma | Female | <65 | III/IV | Chemotherapy | carboplatin | SD |
| Page: 1 2 |
Top |
Related drugs of malignant transformation related genes |
| Identification of chemicals and drugs interact with genes involved in malignant transfromation |
| (DGIdb 4.0) |
| Entrez ID | Symbol | Category | Interaction Types | Drug Claim Name | Drug Name | PMIDs |
| Page: 1 |

Copyright 2023-Present -The University of Texas Health Science Center at Houston |