
|
|||||
|
 | |
| |
| |
| |
| |
| |
|
Gene: LAP3 |
Gene summary for LAP3 |
| Gene information | Species | Human | Gene symbol | LAP3 | Gene ID | 51056 |
| Gene name | leucine aminopeptidase 3 | |
| Gene Alias | HEL-S-106 | |
| Cytomap | 4p15.32 | |
| Gene Type | protein-coding | GO ID | GO:0006508 | UniProtAcc | P28838 |
Top |
Malignant transformation analysis |
| Identification of the aberrant gene expression in precancerous and cancerous lesions by comparing the gene expression of stem-like cells in diseased tissues with normal stem cells |
| Entrez ID | Symbol | Replicates | Species | Organ | Tissue | Adj P-value | Log2FC | Malignancy |
| 51056 | LAP3 | LZE4T | Human | Esophagus | ESCC | 3.16e-04 | 1.08e-01 | 0.0811 |
| 51056 | LAP3 | LZE7T | Human | Esophagus | ESCC | 1.16e-05 | 3.62e-01 | 0.0667 |
| 51056 | LAP3 | LZE8T | Human | Esophagus | ESCC | 6.31e-08 | 3.54e-01 | 0.067 |
| 51056 | LAP3 | LZE20T | Human | Esophagus | ESCC | 2.24e-08 | 4.57e-01 | 0.0662 |
| 51056 | LAP3 | LZE24T | Human | Esophagus | ESCC | 1.88e-20 | 7.75e-01 | 0.0596 |
| 51056 | LAP3 | LZE21T | Human | Esophagus | ESCC | 1.43e-04 | 1.78e-01 | 0.0655 |
| 51056 | LAP3 | P1T-E | Human | Esophagus | ESCC | 3.72e-11 | 7.06e-01 | 0.0875 |
| 51056 | LAP3 | P2T-E | Human | Esophagus | ESCC | 7.73e-55 | 1.07e+00 | 0.1177 |
| 51056 | LAP3 | P4T-E | Human | Esophagus | ESCC | 4.12e-24 | 6.33e-01 | 0.1323 |
| 51056 | LAP3 | P5T-E | Human | Esophagus | ESCC | 3.80e-19 | 5.17e-01 | 0.1327 |
| 51056 | LAP3 | P8T-E | Human | Esophagus | ESCC | 2.07e-33 | 5.93e-01 | 0.0889 |
| 51056 | LAP3 | P9T-E | Human | Esophagus | ESCC | 1.27e-17 | 7.63e-01 | 0.1131 |
| 51056 | LAP3 | P10T-E | Human | Esophagus | ESCC | 1.83e-10 | 2.27e-01 | 0.116 |
| 51056 | LAP3 | P11T-E | Human | Esophagus | ESCC | 9.99e-26 | 1.18e+00 | 0.1426 |
| 51056 | LAP3 | P12T-E | Human | Esophagus | ESCC | 9.68e-25 | 5.44e-01 | 0.1122 |
| 51056 | LAP3 | P15T-E | Human | Esophagus | ESCC | 1.97e-13 | 4.26e-01 | 0.1149 |
| 51056 | LAP3 | P16T-E | Human | Esophagus | ESCC | 3.56e-30 | 5.81e-01 | 0.1153 |
| 51056 | LAP3 | P17T-E | Human | Esophagus | ESCC | 2.89e-16 | 9.63e-01 | 0.1278 |
| 51056 | LAP3 | P19T-E | Human | Esophagus | ESCC | 7.62e-04 | 9.50e-01 | 0.1662 |
| 51056 | LAP3 | P20T-E | Human | Esophagus | ESCC | 1.93e-18 | 4.17e-01 | 0.1124 |
| Page: 1 2 3 4 5 6 7 |
| Tissue | Expression Dynamics | Abbreviation |
| Esophagus | 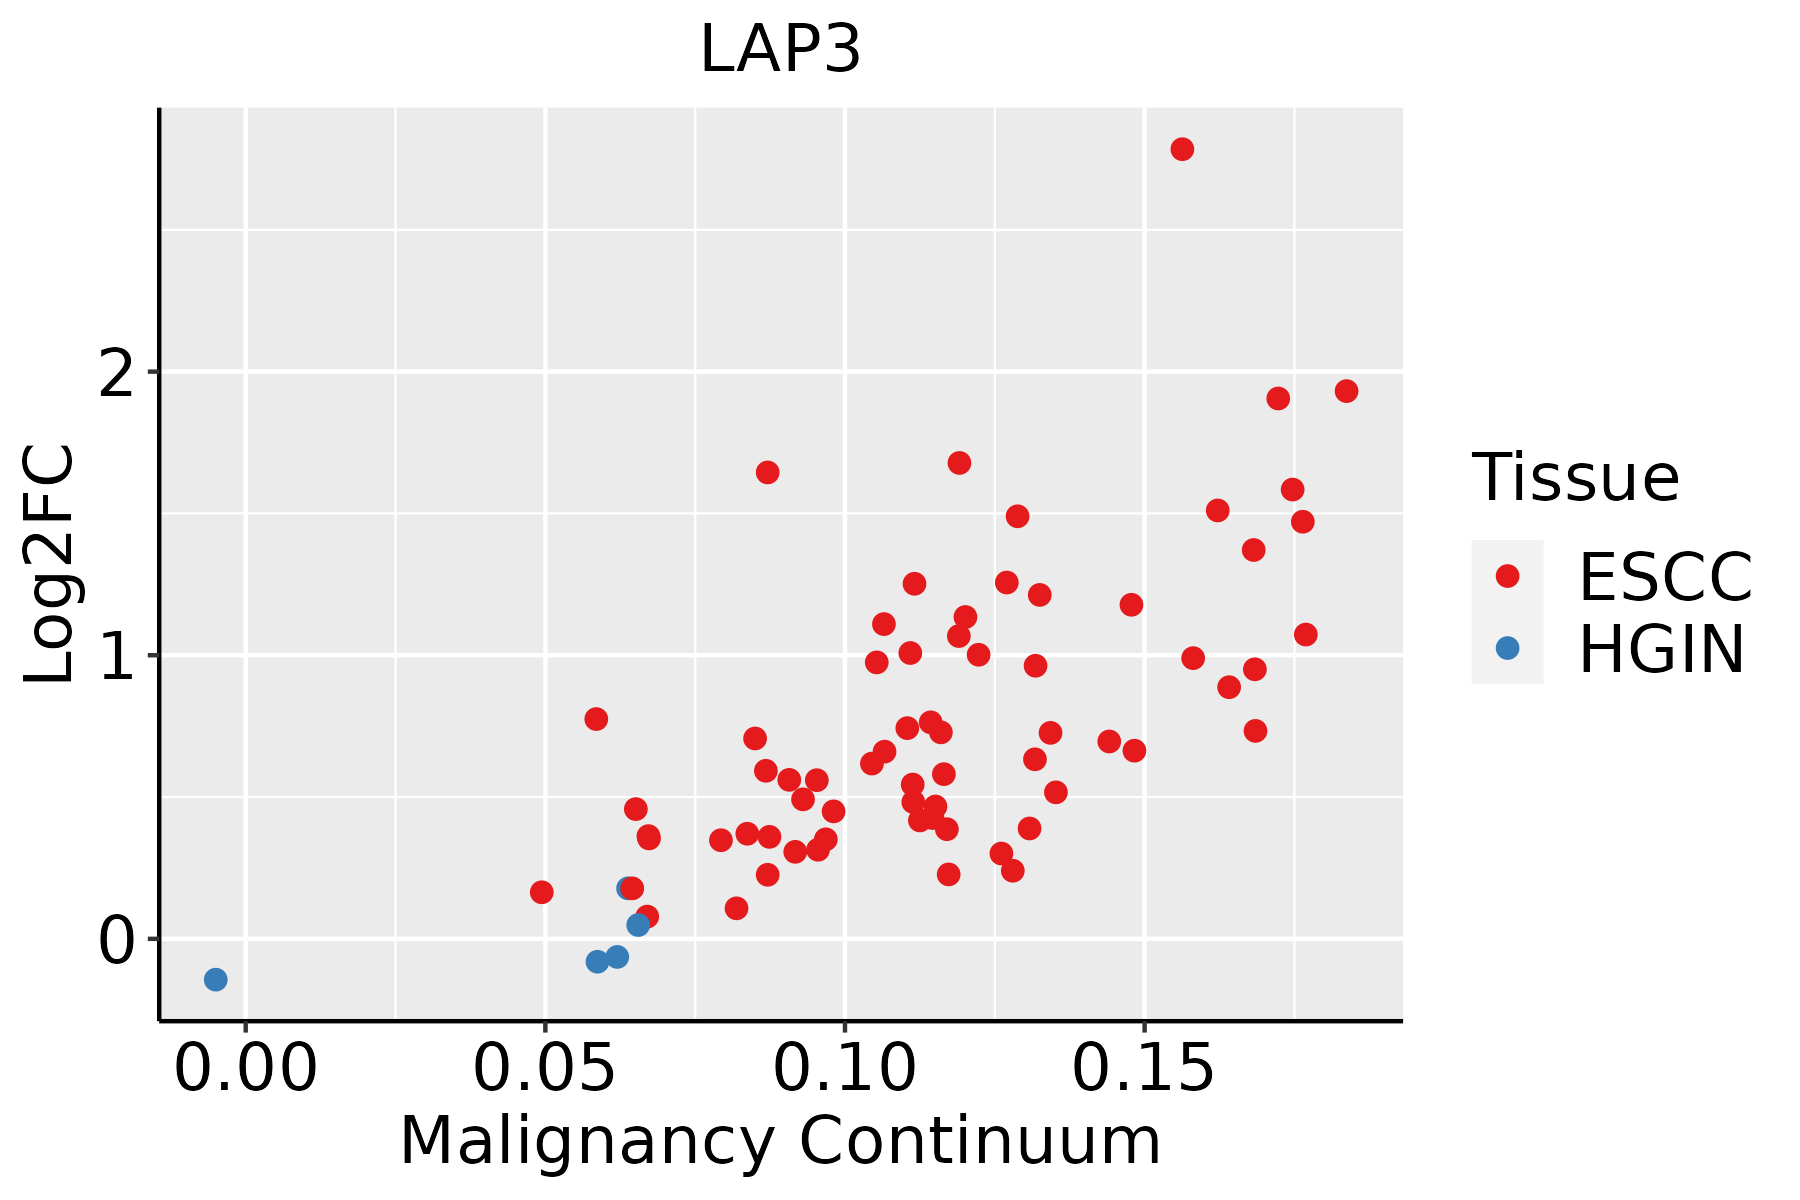 | ESCC: Esophageal squamous cell carcinoma |
| HGIN: High-grade intraepithelial neoplasias | ||
| LGIN: Low-grade intraepithelial neoplasias | ||
| Liver |  | HCC: Hepatocellular carcinoma |
| NAFLD: Non-alcoholic fatty liver disease | ||
| Oral Cavity |  | EOLP: Erosive Oral lichen planus |
| LP: leukoplakia | ||
| NEOLP: Non-erosive oral lichen planus | ||
| OSCC: Oral squamous cell carcinoma | ||
| Skin | 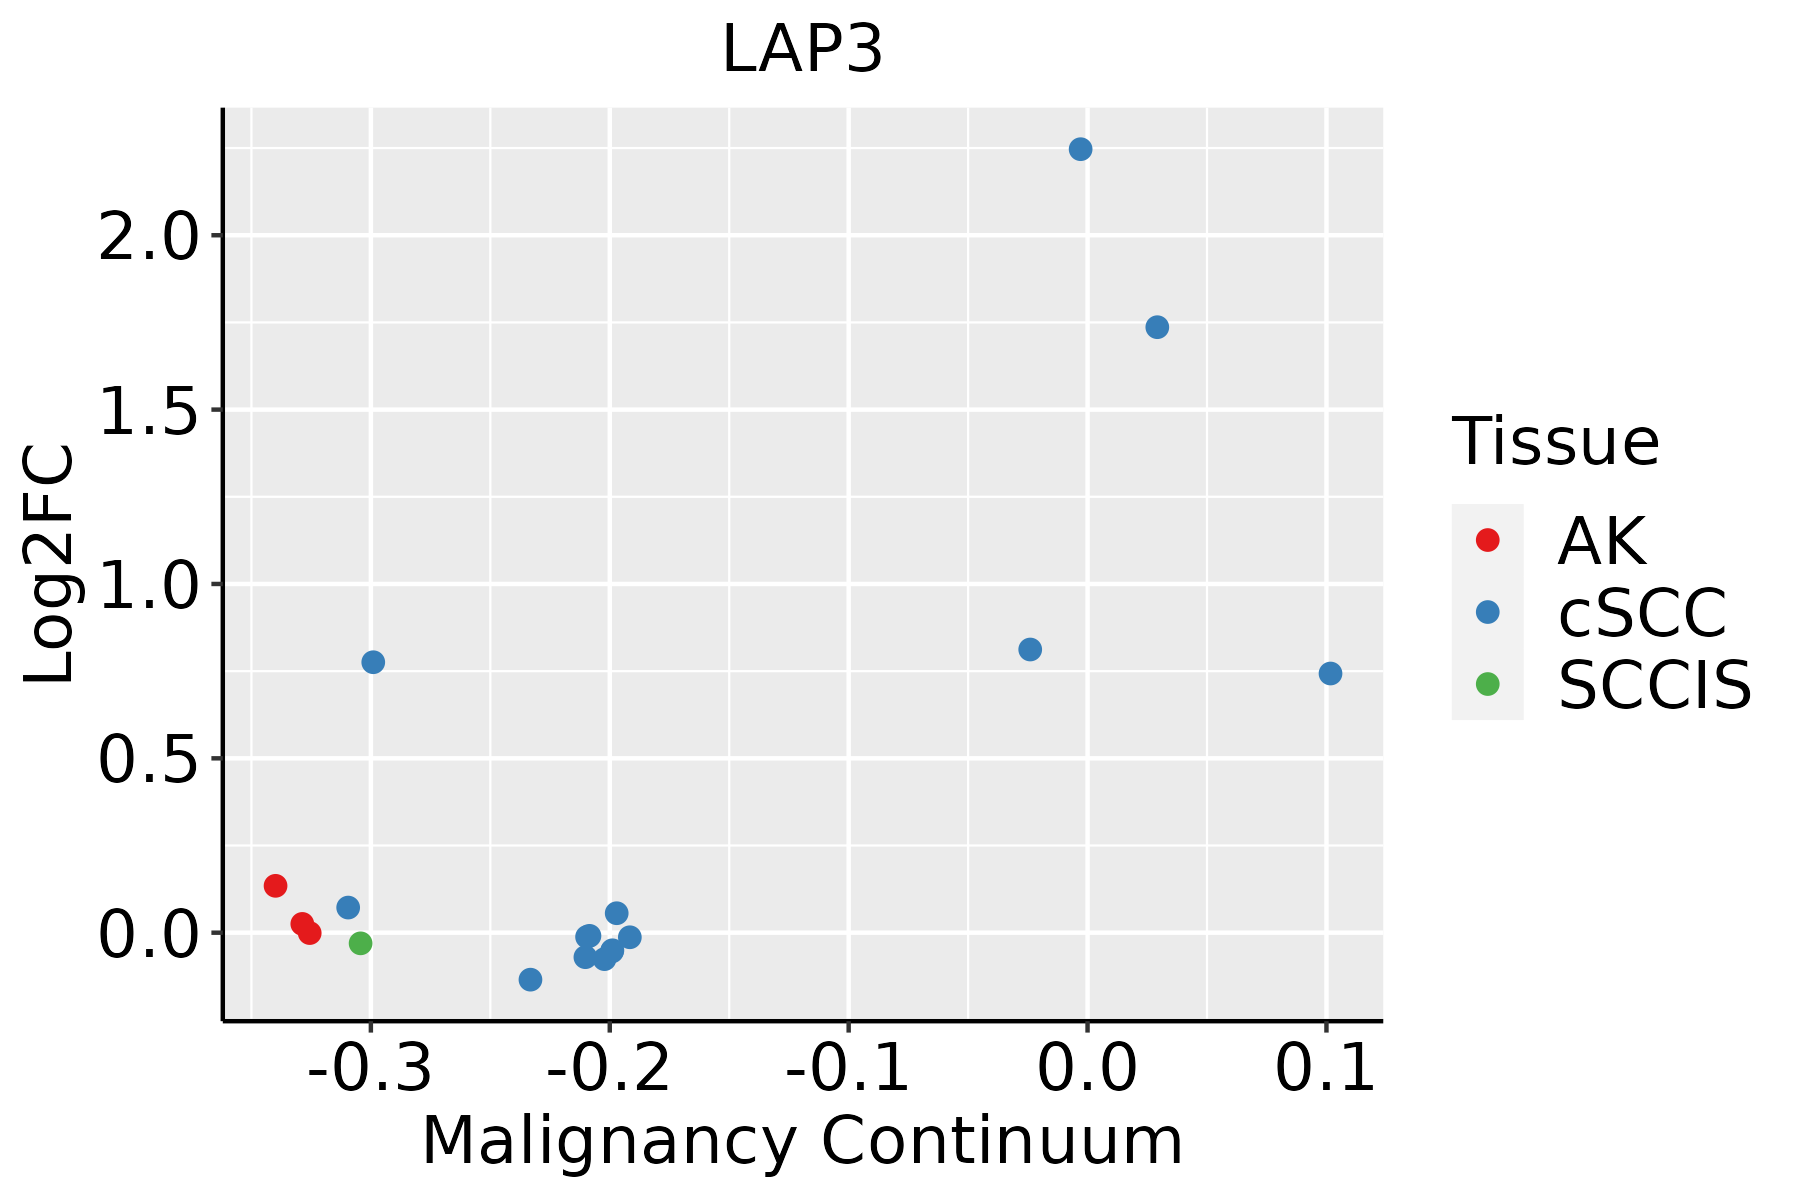 | AK: Actinic keratosis |
| cSCC: Cutaneous squamous cell carcinoma | ||
| SCCIS:squamous cell carcinoma in situ | ||
| Thyroid | 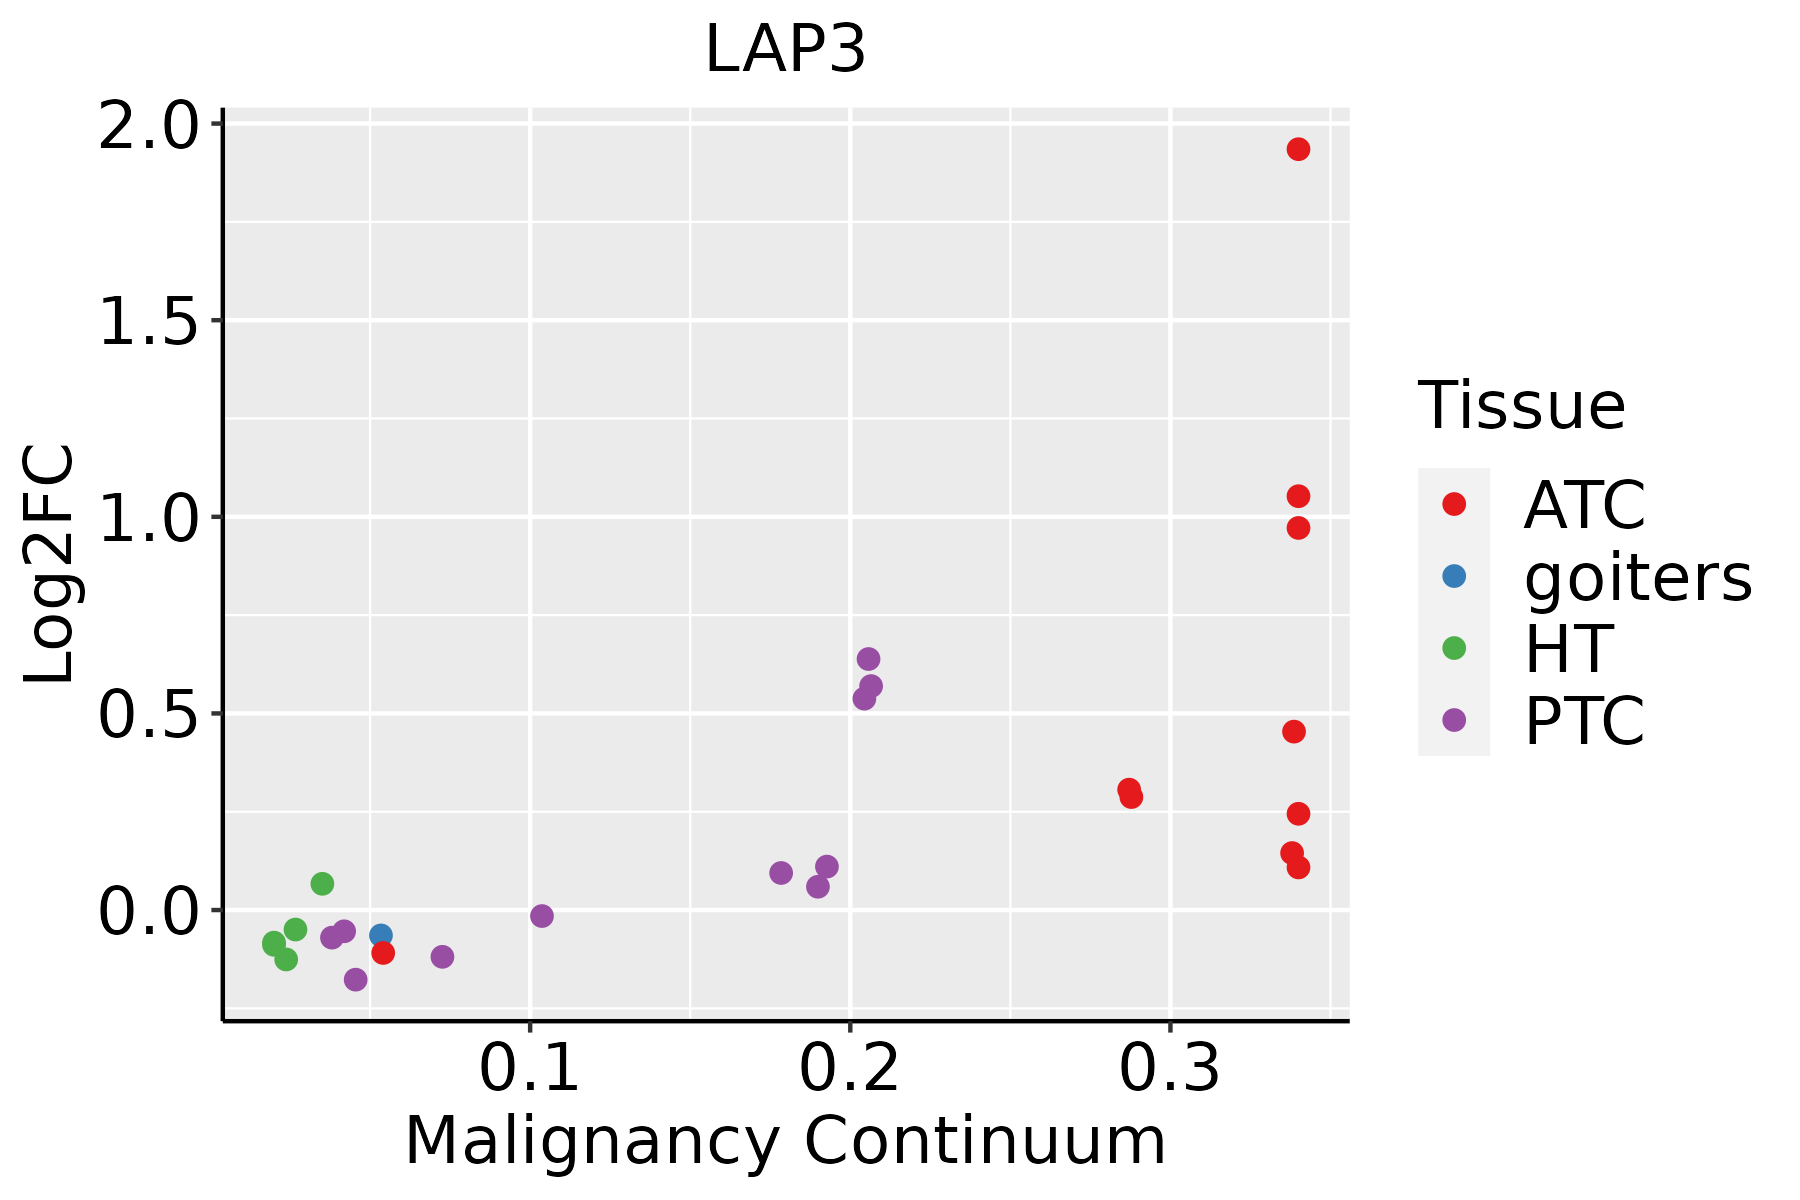 | ATC: Anaplastic thyroid cancer |
| HT: Hashimoto's thyroiditis | ||
| PTC: Papillary thyroid cancer |
| ∗log2FC in expression of this searched gene in stem-like cells from each diseased tissue sample relative to stem-like cells in normal samples in each tissue plotted against the malignancy continuum. Samples are colored based on if they are from different disease stage. |
Top |
Malignant transformation related pathway analysis |
| Find out the enriched GO biological processes and KEGG pathways involved in transition from healthy to precancer to cancer |
| Tissue | Disease Stage | Enriched GO biological Processes |
| Colorectum | AD |  |
| Colorectum | SER |  |
| Colorectum | MSS |  |
| Colorectum | MSI-H |  |
| Colorectum | FAP |  |
| ∗Top 15 enriched GO BP terms are showed in the bar plot of each disease state in each tissue. Each row represents a significant GO biological process which is colored according to the -log10(p.adjust). |
| Page: 1 2 3 4 5 6 7 8 9 |
| GO ID | Tissue | Disease Stage | Description | Gene Ratio | Bg Ratio | pvalue | p.adjust | Count |
| Page: 1 |
| Pathway ID | Tissue | Disease Stage | Description | Gene Ratio | Bg Ratio | pvalue | p.adjust | qvalue | Count |
| hsa0048018 | Esophagus | ESCC | Glutathione metabolism | 44/4205 | 57/8465 | 1.81e-05 | 9.03e-05 | 4.63e-05 | 44 |
| hsa0048019 | Esophagus | ESCC | Glutathione metabolism | 44/4205 | 57/8465 | 1.81e-05 | 9.03e-05 | 4.63e-05 | 44 |
| hsa004809 | Liver | Cirrhotic | Glutathione metabolism | 30/2530 | 57/8465 | 2.63e-04 | 1.72e-03 | 1.06e-03 | 30 |
| hsa003308 | Liver | Cirrhotic | Arginine and proline metabolism | 25/2530 | 50/8465 | 2.18e-03 | 9.41e-03 | 5.80e-03 | 25 |
| hsa0048012 | Liver | Cirrhotic | Glutathione metabolism | 30/2530 | 57/8465 | 2.63e-04 | 1.72e-03 | 1.06e-03 | 30 |
| hsa0033011 | Liver | Cirrhotic | Arginine and proline metabolism | 25/2530 | 50/8465 | 2.18e-03 | 9.41e-03 | 5.80e-03 | 25 |
| hsa0048022 | Liver | HCC | Glutathione metabolism | 42/4020 | 57/8465 | 5.00e-05 | 2.62e-04 | 1.46e-04 | 42 |
| hsa0033021 | Liver | HCC | Arginine and proline metabolism | 33/4020 | 50/8465 | 6.28e-03 | 1.77e-02 | 9.83e-03 | 33 |
| hsa0048032 | Liver | HCC | Glutathione metabolism | 42/4020 | 57/8465 | 5.00e-05 | 2.62e-04 | 1.46e-04 | 42 |
| hsa0033031 | Liver | HCC | Arginine and proline metabolism | 33/4020 | 50/8465 | 6.28e-03 | 1.77e-02 | 9.83e-03 | 33 |
| hsa0048016 | Oral cavity | OSCC | Glutathione metabolism | 36/3704 | 57/8465 | 2.41e-03 | 6.41e-03 | 3.26e-03 | 36 |
| hsa0033010 | Oral cavity | OSCC | Arginine and proline metabolism | 30/3704 | 50/8465 | 1.50e-02 | 3.26e-02 | 1.66e-02 | 30 |
| hsa0048017 | Oral cavity | OSCC | Glutathione metabolism | 36/3704 | 57/8465 | 2.41e-03 | 6.41e-03 | 3.26e-03 | 36 |
| hsa0033013 | Oral cavity | OSCC | Arginine and proline metabolism | 30/3704 | 50/8465 | 1.50e-02 | 3.26e-02 | 1.66e-02 | 30 |
| hsa0033023 | Oral cavity | LP | Arginine and proline metabolism | 26/2418 | 50/8465 | 3.94e-04 | 2.08e-03 | 1.34e-03 | 26 |
| hsa0048024 | Oral cavity | LP | Glutathione metabolism | 25/2418 | 57/8465 | 9.58e-03 | 3.47e-02 | 2.24e-02 | 25 |
| hsa0033033 | Oral cavity | LP | Arginine and proline metabolism | 26/2418 | 50/8465 | 3.94e-04 | 2.08e-03 | 1.34e-03 | 26 |
| hsa0048034 | Oral cavity | LP | Glutathione metabolism | 25/2418 | 57/8465 | 9.58e-03 | 3.47e-02 | 2.24e-02 | 25 |
| Page: 1 |
Top |
Cell-cell communication analysis |
| Identification of potential cell-cell interactions between two cell types and their ligand-receptor pairs for different disease states |
| Ligand | Receptor | LRpair | Pathway | Tissue | Disease Stage |
| Page: 1 |
Top |
Single-cell gene regulatory network inference analysis |
| Find out the significant the regulons (TFs) and the target genes of each regulon across cell types for different disease states |
| TF | Cell Type | Tissue | Disease Stage | Target Gene | RSS | Regulon Activity |
| ∗The dot plots of a searched regulon are shown for all cell subpopulations in each disease state of each tissue based on the regulon specific score inferred using pySCENIC and by calculating the average expression. |
| Page: 1 |
Top |
Somatic mutation of malignant transformation related genes |
| Annotation of somatic variants for genes involved in malignant transformation |
| Hugo Symbol | Variant Class | Variant Classification | dbSNP RS | HGVSc | HGVSp | HGVSp Short | SWISSPROT | BIOTYPE | SIFT | PolyPhen | Tumor Sample Barcode | Tissue | Histology | Sex | Age | Stage | Therapy Types | Drugs | Outcome |
| LAP3 | SNV | Missense_Mutation | c.472N>C | p.Gly158Arg | p.G158R | P28838 | protein_coding | deleterious(0.03) | probably_damaging(0.996) | TCGA-AR-A24Z-01 | Breast | breast invasive carcinoma | Female | <65 | I/II | Chemotherapy | doxorubicin | SD | |
| LAP3 | SNV | Missense_Mutation | novel | c.627G>T | p.Glu209Asp | p.E209D | P28838 | protein_coding | tolerated(0.2) | benign(0.015) | TCGA-2W-A8YY-01 | Cervix | cervical & endocervical cancer | Female | <65 | I/II | Chemotherapy | cisplatin | CR |
| LAP3 | SNV | Missense_Mutation | rs748906411 | c.769G>A | p.Glu257Lys | p.E257K | P28838 | protein_coding | deleterious(0) | probably_damaging(0.984) | TCGA-2W-A8YY-01 | Cervix | cervical & endocervical cancer | Female | <65 | I/II | Chemotherapy | cisplatin | CR |
| LAP3 | SNV | Missense_Mutation | rs781094926 | c.251N>A | p.Arg84Gln | p.R84Q | P28838 | protein_coding | deleterious(0.02) | probably_damaging(0.995) | TCGA-FU-A3HZ-01 | Cervix | cervical & endocervical cancer | Female | <65 | I/II | Chemotherapy | cisplatin | CR |
| LAP3 | SNV | Missense_Mutation | rs748906411 | c.769N>A | p.Glu257Lys | p.E257K | P28838 | protein_coding | deleterious(0) | probably_damaging(0.984) | TCGA-AA-3947-01 | Colorectum | colon adenocarcinoma | Female | <65 | I/II | Unknown | Unknown | SD |
| LAP3 | SNV | Missense_Mutation | c.130N>A | p.Glu44Lys | p.E44K | P28838 | protein_coding | tolerated(0.18) | benign(0.05) | TCGA-CA-6717-01 | Colorectum | colon adenocarcinoma | Male | <65 | I/II | Chemotherapy | oxaliplatin | CR | |
| LAP3 | SNV | Missense_Mutation | c.1049T>C | p.Val350Ala | p.V350A | P28838 | protein_coding | deleterious(0.02) | probably_damaging(0.997) | TCGA-DM-A28A-01 | Colorectum | colon adenocarcinoma | Male | >=65 | III/IV | Unknown | Unknown | SD | |
| LAP3 | SNV | Missense_Mutation | c.776C>A | p.Pro259Gln | p.P259Q | P28838 | protein_coding | deleterious(0) | probably_damaging(1) | TCGA-F4-6807-01 | Colorectum | colon adenocarcinoma | Female | <65 | III/IV | Chemotherapy | xeloda | CR | |
| LAP3 | SNV | Missense_Mutation | c.79N>T | p.Leu27Phe | p.L27F | P28838 | protein_coding | tolerated(0.74) | benign(0) | TCGA-G4-6309-01 | Colorectum | colon adenocarcinoma | Female | <65 | III/IV | Chemotherapy | xeloda | PD | |
| LAP3 | SNV | Missense_Mutation | c.1474N>A | p.Val492Ile | p.V492I | P28838 | protein_coding | tolerated(0.3) | benign(0.007) | TCGA-NH-A5IV-01 | Colorectum | colon adenocarcinoma | Female | >=65 | I/II | Unknown | Unknown | SD |
| Page: 1 2 3 4 5 6 |
Top |
Related drugs of malignant transformation related genes |
| Identification of chemicals and drugs interact with genes involved in malignant transfromation |
| (DGIdb 4.0) |
| Entrez ID | Symbol | Category | Interaction Types | Drug Claim Name | Drug Name | PMIDs |
| 51056 | LAP3 | PROTEASE, DRUGGABLE GENOME, ENZYME | inhibitor | CHEMBL2103847 | TOSEDOSTAT |
| Page: 1 |

Copyright 2023-Present -The University of Texas Health Science Center at Houston |