
|
|||||
|
 | |
| |
| |
| |
| |
| |
|
Gene: LANCL1 |
Gene summary for LANCL1 |
| Gene information | Species | Human | Gene symbol | LANCL1 | Gene ID | 10314 |
| Gene name | LanC like 1 | |
| Gene Alias | GPR69A | |
| Cytomap | 2q34 | |
| Gene Type | protein-coding | GO ID | GO:0005975 | UniProtAcc | O43813 |
Top |
Malignant transformation analysis |
| Identification of the aberrant gene expression in precancerous and cancerous lesions by comparing the gene expression of stem-like cells in diseased tissues with normal stem cells |
| Entrez ID | Symbol | Replicates | Species | Organ | Tissue | Adj P-value | Log2FC | Malignancy |
| 10314 | LANCL1 | LZE4T | Human | Esophagus | ESCC | 9.30e-11 | 2.91e-01 | 0.0811 |
| 10314 | LANCL1 | LZE24T | Human | Esophagus | ESCC | 2.51e-08 | 1.68e-01 | 0.0596 |
| 10314 | LANCL1 | P2T-E | Human | Esophagus | ESCC | 8.76e-20 | 2.64e-01 | 0.1177 |
| 10314 | LANCL1 | P4T-E | Human | Esophagus | ESCC | 3.52e-13 | 1.88e-01 | 0.1323 |
| 10314 | LANCL1 | P5T-E | Human | Esophagus | ESCC | 3.54e-03 | 3.88e-02 | 0.1327 |
| 10314 | LANCL1 | P8T-E | Human | Esophagus | ESCC | 3.48e-07 | 1.57e-01 | 0.0889 |
| 10314 | LANCL1 | P9T-E | Human | Esophagus | ESCC | 9.68e-07 | 1.17e-01 | 0.1131 |
| 10314 | LANCL1 | P10T-E | Human | Esophagus | ESCC | 2.72e-15 | 2.71e-01 | 0.116 |
| 10314 | LANCL1 | P11T-E | Human | Esophagus | ESCC | 1.18e-07 | 2.24e-01 | 0.1426 |
| 10314 | LANCL1 | P12T-E | Human | Esophagus | ESCC | 2.96e-20 | 4.25e-01 | 0.1122 |
| 10314 | LANCL1 | P15T-E | Human | Esophagus | ESCC | 6.60e-12 | 1.87e-01 | 0.1149 |
| 10314 | LANCL1 | P16T-E | Human | Esophagus | ESCC | 3.09e-23 | 3.56e-01 | 0.1153 |
| 10314 | LANCL1 | P20T-E | Human | Esophagus | ESCC | 2.83e-19 | 2.21e-01 | 0.1124 |
| 10314 | LANCL1 | P21T-E | Human | Esophagus | ESCC | 2.22e-16 | 2.61e-01 | 0.1617 |
| 10314 | LANCL1 | P22T-E | Human | Esophagus | ESCC | 2.47e-28 | 5.10e-01 | 0.1236 |
| 10314 | LANCL1 | P23T-E | Human | Esophagus | ESCC | 8.95e-09 | 5.84e-02 | 0.108 |
| 10314 | LANCL1 | P24T-E | Human | Esophagus | ESCC | 3.49e-09 | 1.32e-01 | 0.1287 |
| 10314 | LANCL1 | P26T-E | Human | Esophagus | ESCC | 7.68e-17 | 1.91e-01 | 0.1276 |
| 10314 | LANCL1 | P27T-E | Human | Esophagus | ESCC | 4.77e-18 | 2.16e-01 | 0.1055 |
| 10314 | LANCL1 | P28T-E | Human | Esophagus | ESCC | 2.15e-12 | 2.22e-01 | 0.1149 |
| Page: 1 2 3 4 5 |
| Tissue | Expression Dynamics | Abbreviation |
| Esophagus | 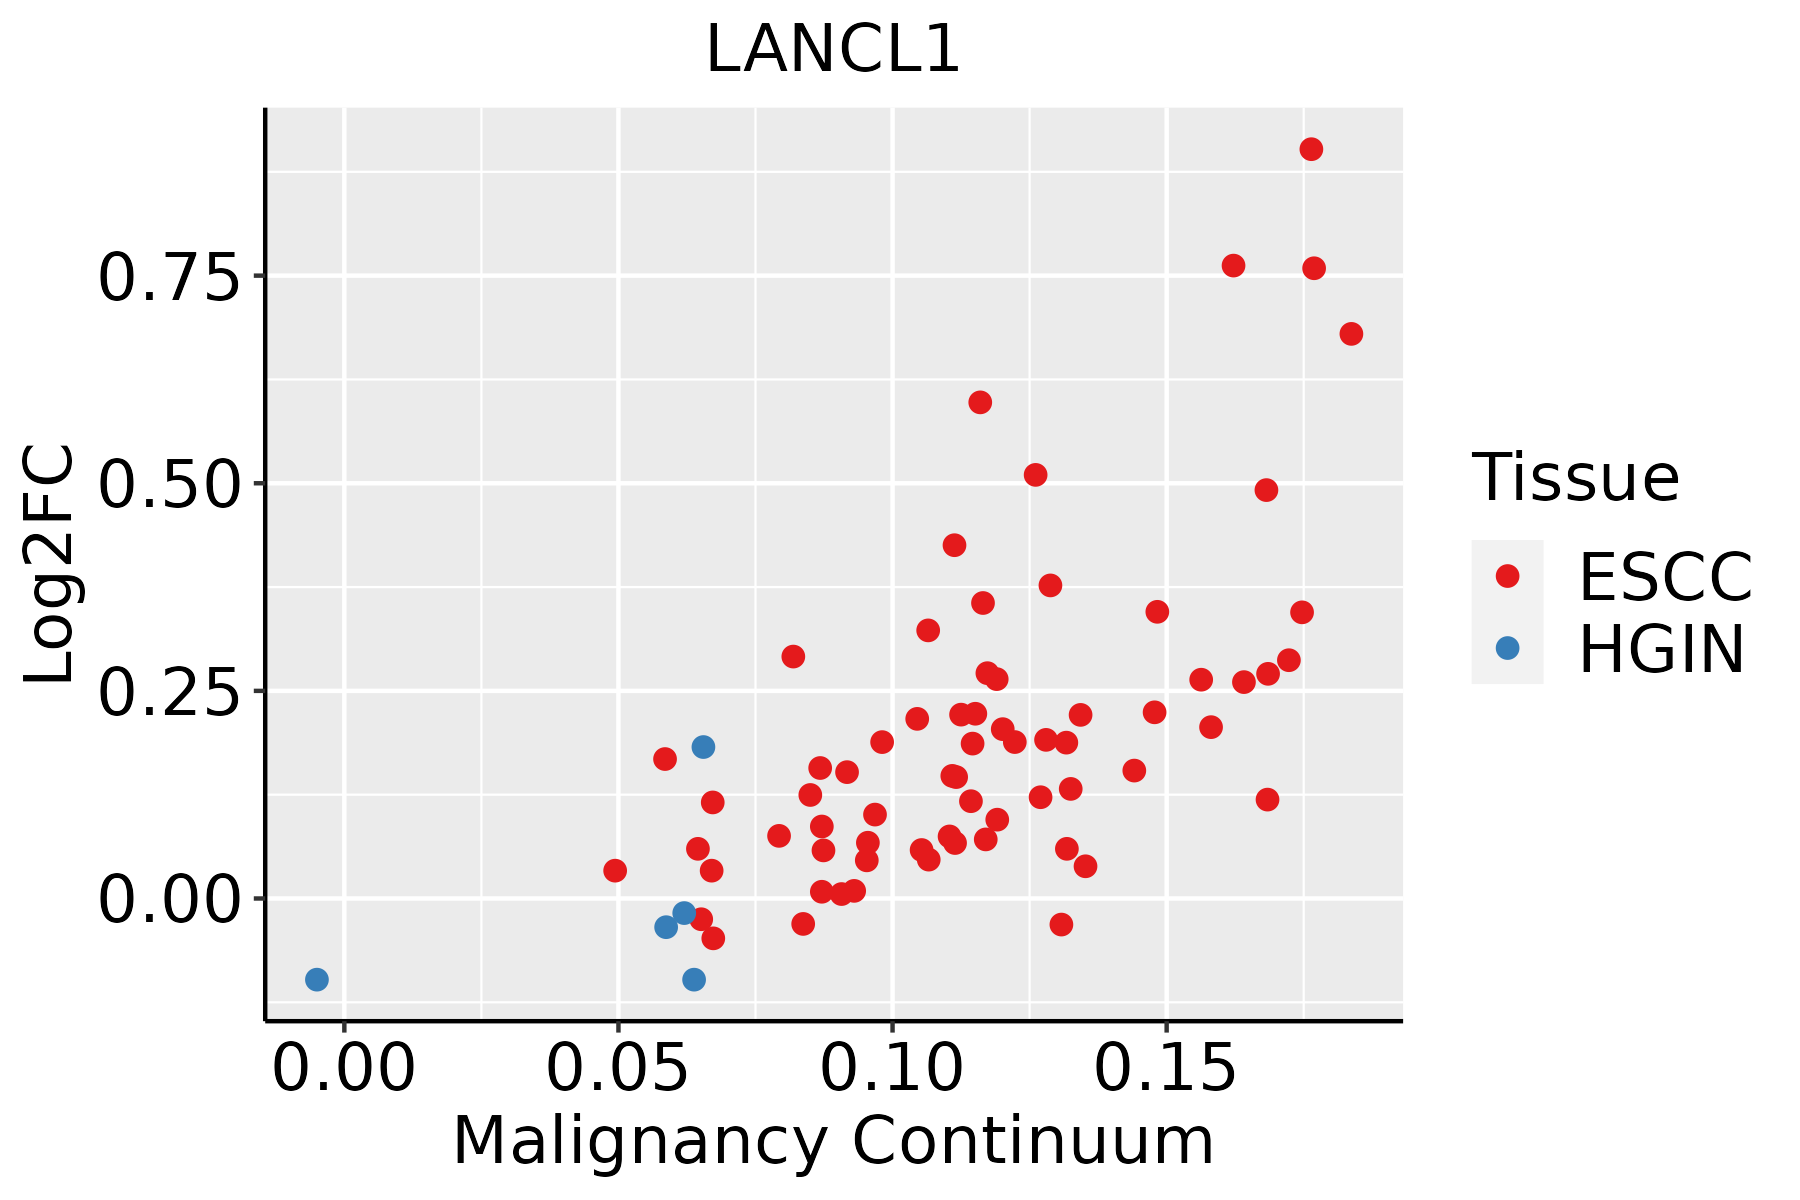 | ESCC: Esophageal squamous cell carcinoma |
| HGIN: High-grade intraepithelial neoplasias | ||
| LGIN: Low-grade intraepithelial neoplasias | ||
| Liver | 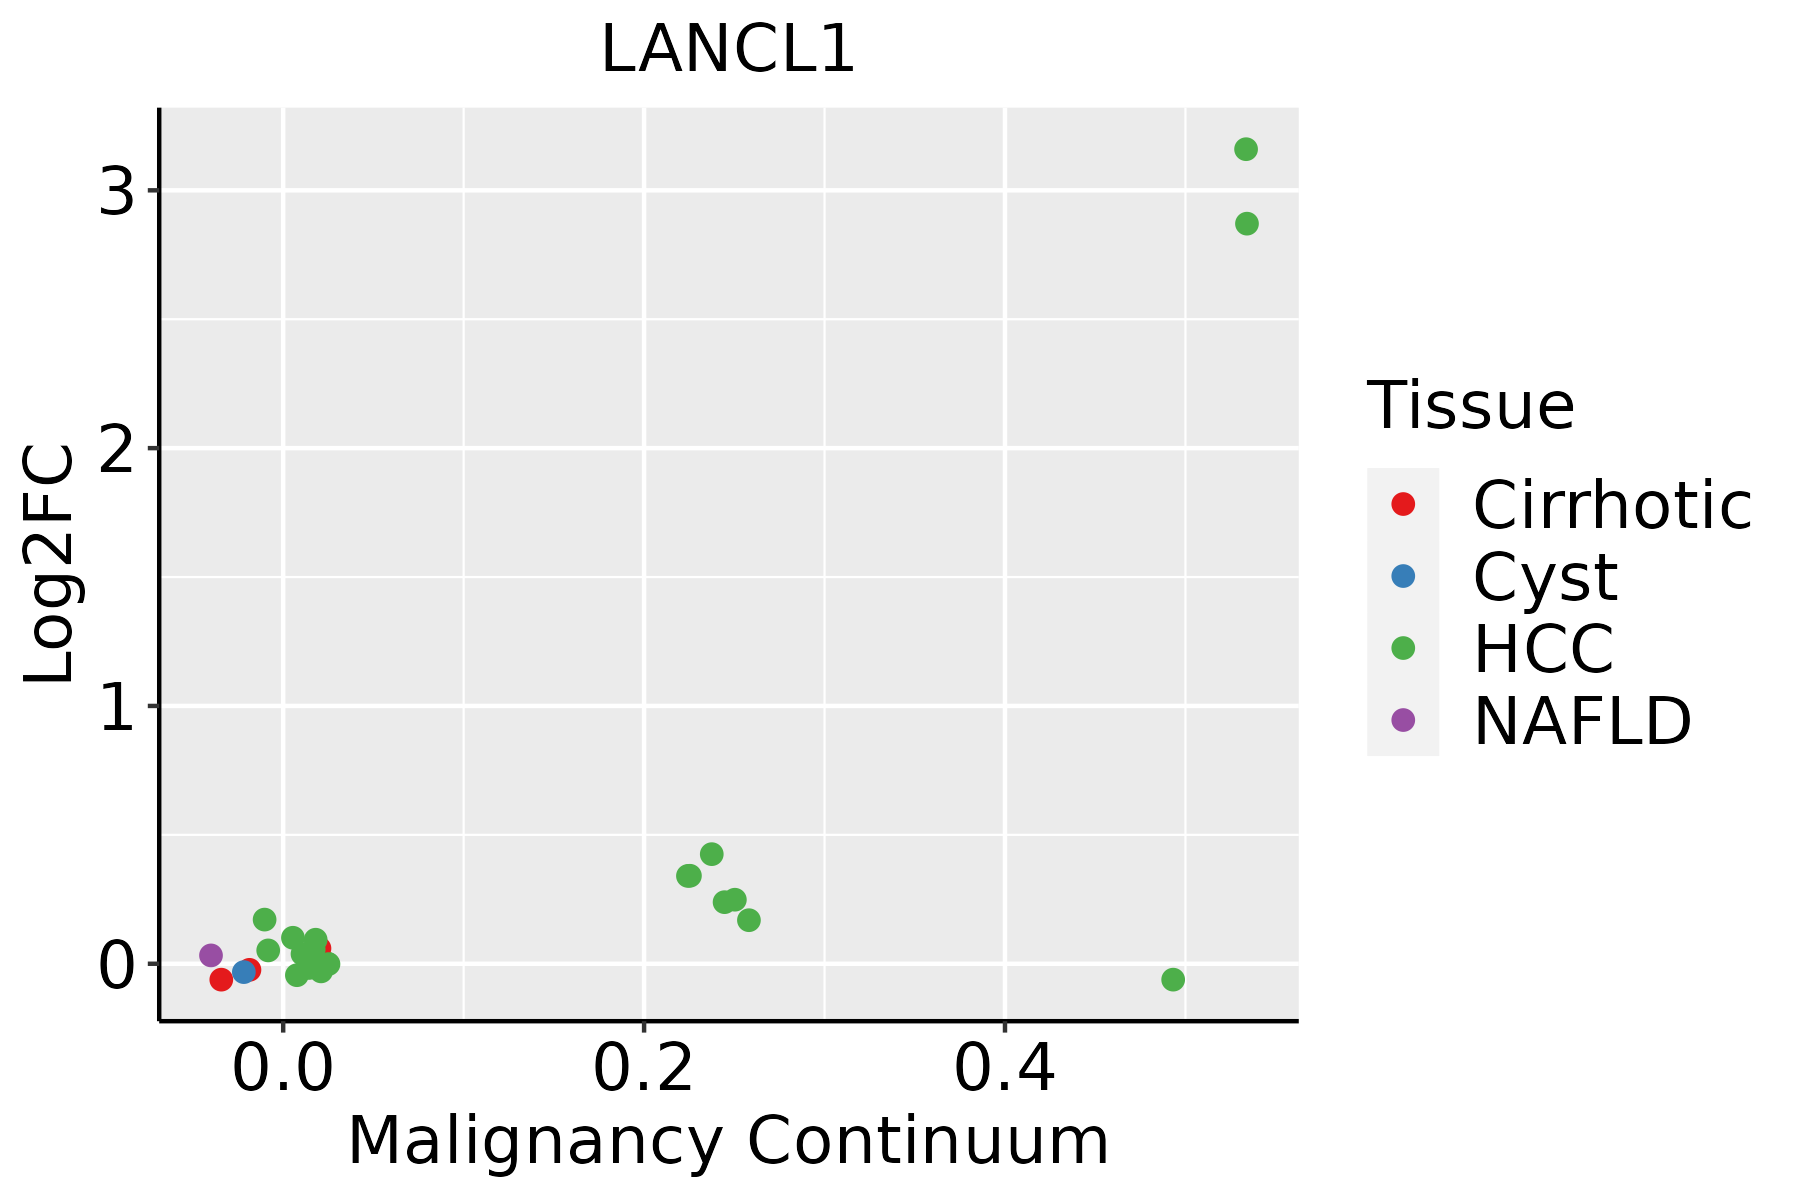 | HCC: Hepatocellular carcinoma |
| NAFLD: Non-alcoholic fatty liver disease | ||
| Oral Cavity | 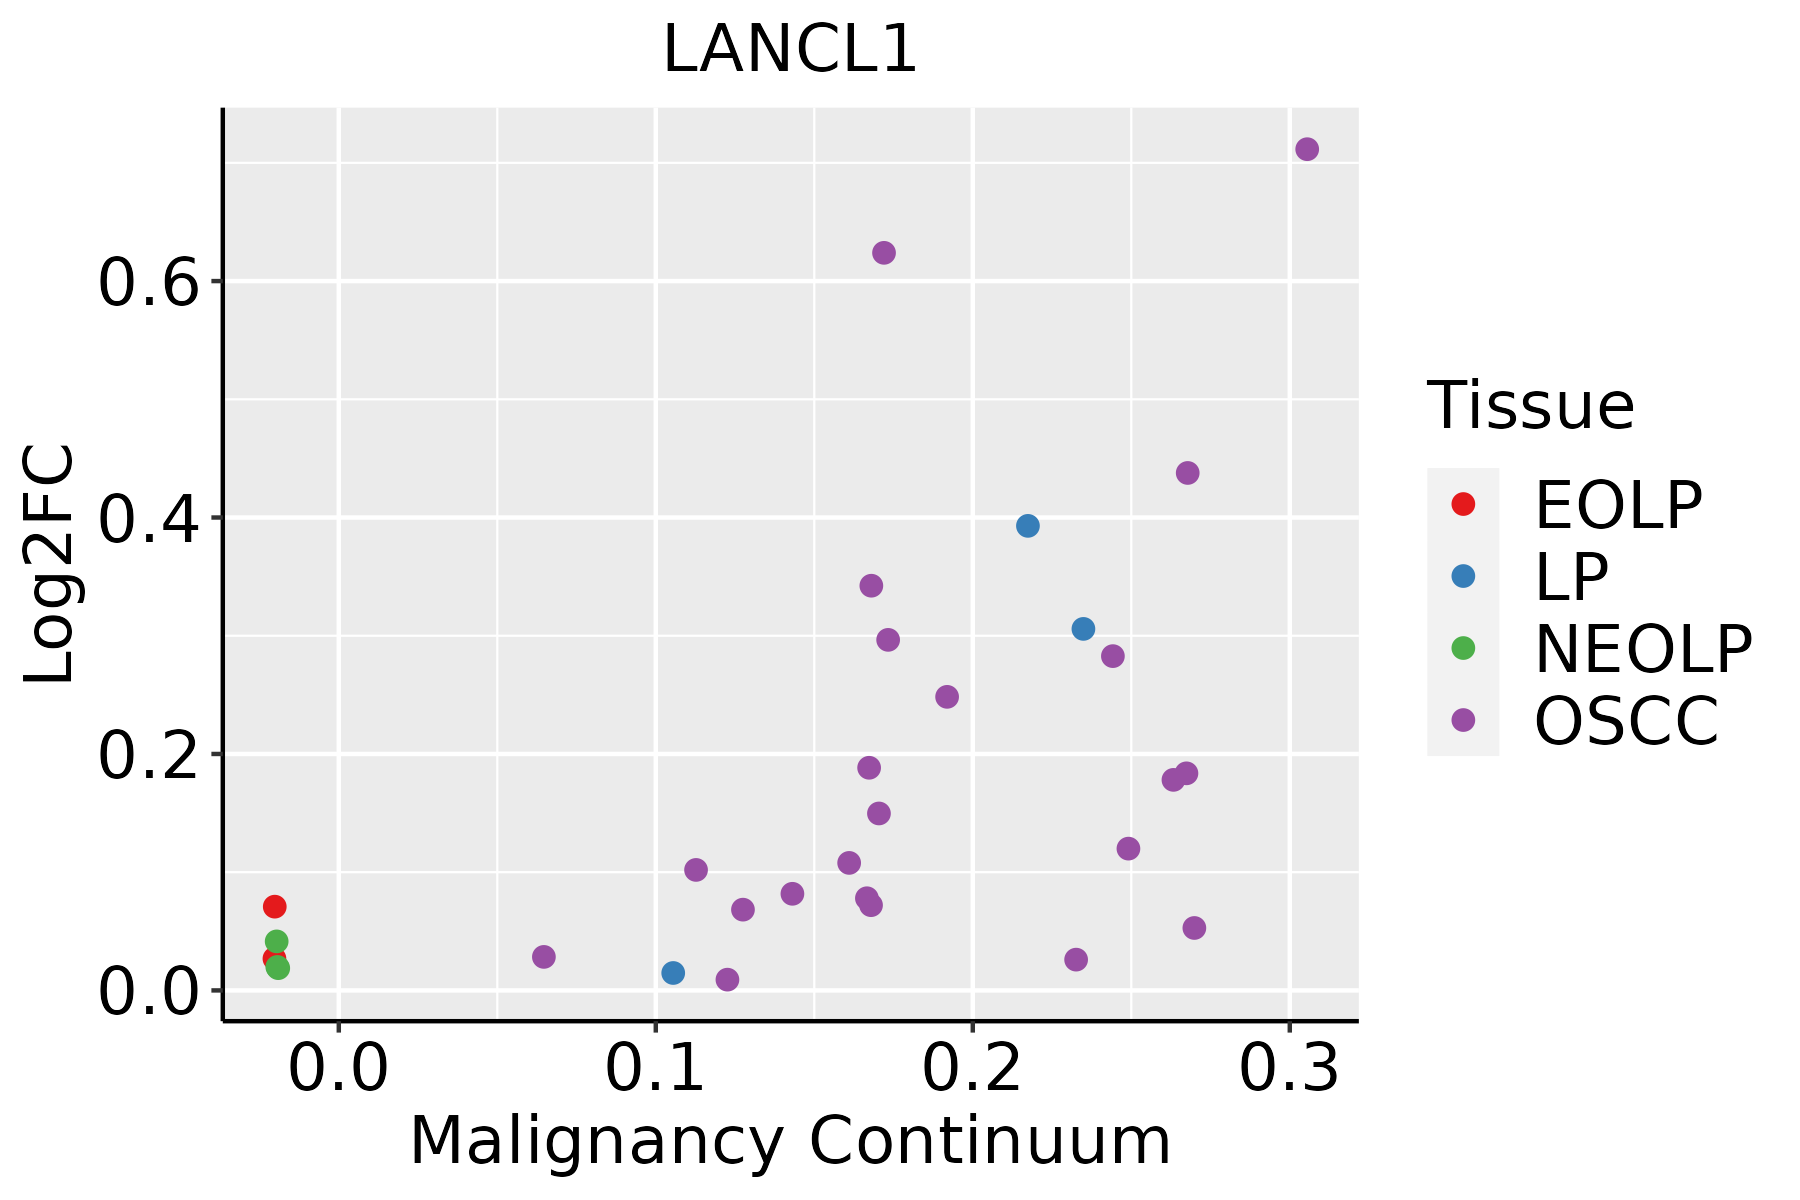 | EOLP: Erosive Oral lichen planus |
| LP: leukoplakia | ||
| NEOLP: Non-erosive oral lichen planus | ||
| OSCC: Oral squamous cell carcinoma | ||
| Prostate | 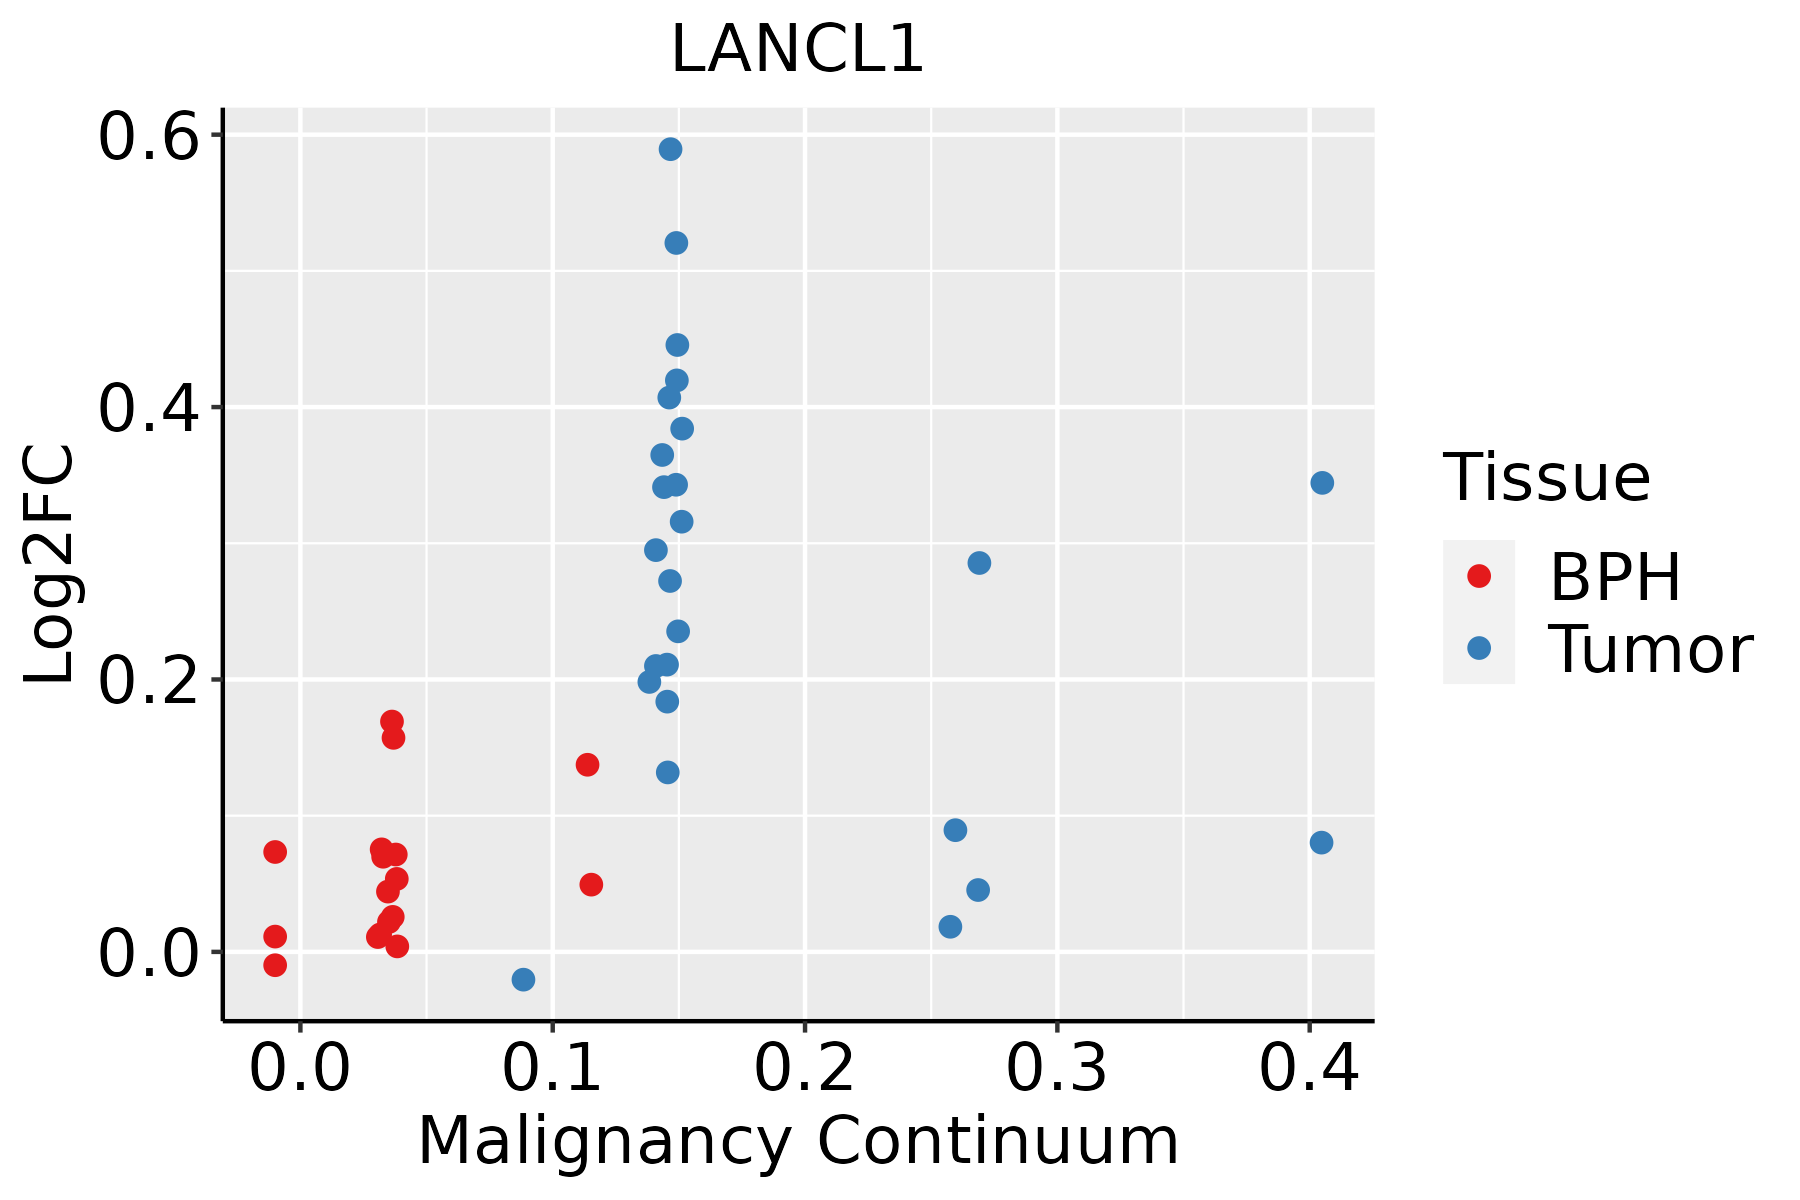 | BPH: Benign Prostatic Hyperplasia |
| ∗log2FC in expression of this searched gene in stem-like cells from each diseased tissue sample relative to stem-like cells in normal samples in each tissue plotted against the malignancy continuum. Samples are colored based on if they are from different disease stage. |
Top |
Malignant transformation related pathway analysis |
| Find out the enriched GO biological processes and KEGG pathways involved in transition from healthy to precancer to cancer |
| Tissue | Disease Stage | Enriched GO biological Processes |
| Colorectum | AD |  |
| Colorectum | SER |  |
| Colorectum | MSS |  |
| Colorectum | MSI-H |  |
| Colorectum | FAP |  |
| ∗Top 15 enriched GO BP terms are showed in the bar plot of each disease state in each tissue. Each row represents a significant GO biological process which is colored according to the -log10(p.adjust). |
| Page: 1 2 3 4 5 6 7 8 9 |
| GO ID | Tissue | Disease Stage | Description | Gene Ratio | Bg Ratio | pvalue | p.adjust | Count |
| GO:0006979111 | Esophagus | ESCC | response to oxidative stress | 303/8552 | 446/18723 | 7.15e-22 | 1.30e-19 | 303 |
| GO:0062197111 | Esophagus | ESCC | cellular response to chemical stress | 234/8552 | 337/18723 | 5.37e-19 | 5.97e-17 | 234 |
| GO:0034599111 | Esophagus | ESCC | cellular response to oxidative stress | 197/8552 | 288/18723 | 3.76e-15 | 2.15e-13 | 197 |
| GO:0070997111 | Esophagus | ESCC | neuron death | 216/8552 | 361/18723 | 3.49e-08 | 6.45e-07 | 216 |
| GO:0051402110 | Esophagus | ESCC | neuron apoptotic process | 148/8552 | 246/18723 | 3.08e-06 | 3.47e-05 | 148 |
| GO:1901214111 | Esophagus | ESCC | regulation of neuron death | 186/8552 | 319/18723 | 3.35e-06 | 3.73e-05 | 186 |
| GO:004352317 | Esophagus | ESCC | regulation of neuron apoptotic process | 122/8552 | 212/18723 | 3.21e-04 | 1.90e-03 | 122 |
| GO:003647320 | Esophagus | ESCC | cell death in response to oxidative stress | 59/8552 | 95/18723 | 9.12e-04 | 4.65e-03 | 59 |
| GO:190288220 | Esophagus | ESCC | regulation of response to oxidative stress | 58/8552 | 98/18723 | 4.86e-03 | 1.88e-02 | 58 |
| GO:190320316 | Esophagus | ESCC | regulation of oxidative stress-induced neuron death | 19/8552 | 27/18723 | 8.35e-03 | 2.95e-02 | 19 |
| GO:190040720 | Esophagus | ESCC | regulation of cellular response to oxidative stress | 52/8552 | 89/18723 | 1.04e-02 | 3.56e-02 | 52 |
| GO:190320120 | Esophagus | ESCC | regulation of oxidative stress-induced cell death | 44/8552 | 74/18723 | 1.18e-02 | 3.94e-02 | 44 |
| GO:000697922 | Liver | HCC | response to oxidative stress | 281/7958 | 446/18723 | 9.75e-19 | 1.24e-16 | 281 |
| GO:006219722 | Liver | HCC | cellular response to chemical stress | 216/7958 | 337/18723 | 6.86e-16 | 5.44e-14 | 216 |
| GO:003459922 | Liver | HCC | cellular response to oxidative stress | 183/7958 | 288/18723 | 3.65e-13 | 1.93e-11 | 183 |
| GO:007099722 | Liver | HCC | neuron death | 202/7958 | 361/18723 | 1.44e-07 | 2.70e-06 | 202 |
| GO:190121412 | Liver | HCC | regulation of neuron death | 179/7958 | 319/18723 | 5.65e-07 | 9.01e-06 | 179 |
| GO:005140212 | Liver | HCC | neuron apoptotic process | 135/7958 | 246/18723 | 5.64e-05 | 5.26e-04 | 135 |
| GO:004352312 | Liver | HCC | regulation of neuron apoptotic process | 117/7958 | 212/18723 | 1.25e-04 | 1.03e-03 | 117 |
| GO:003647511 | Liver | HCC | neuron death in response to oxidative stress | 22/7958 | 31/18723 | 1.27e-03 | 6.92e-03 | 22 |
| Page: 1 2 3 4 |
| Pathway ID | Tissue | Disease Stage | Description | Gene Ratio | Bg Ratio | pvalue | p.adjust | qvalue | Count |
| hsa0048018 | Esophagus | ESCC | Glutathione metabolism | 44/4205 | 57/8465 | 1.81e-05 | 9.03e-05 | 4.63e-05 | 44 |
| hsa0048019 | Esophagus | ESCC | Glutathione metabolism | 44/4205 | 57/8465 | 1.81e-05 | 9.03e-05 | 4.63e-05 | 44 |
| hsa0048022 | Liver | HCC | Glutathione metabolism | 42/4020 | 57/8465 | 5.00e-05 | 2.62e-04 | 1.46e-04 | 42 |
| hsa0048032 | Liver | HCC | Glutathione metabolism | 42/4020 | 57/8465 | 5.00e-05 | 2.62e-04 | 1.46e-04 | 42 |
| hsa0048016 | Oral cavity | OSCC | Glutathione metabolism | 36/3704 | 57/8465 | 2.41e-03 | 6.41e-03 | 3.26e-03 | 36 |
| hsa0048017 | Oral cavity | OSCC | Glutathione metabolism | 36/3704 | 57/8465 | 2.41e-03 | 6.41e-03 | 3.26e-03 | 36 |
| hsa0048014 | Prostate | Tumor | Glutathione metabolism | 20/1791 | 57/8465 | 1.05e-02 | 3.33e-02 | 2.07e-02 | 20 |
| hsa0048015 | Prostate | Tumor | Glutathione metabolism | 20/1791 | 57/8465 | 1.05e-02 | 3.33e-02 | 2.07e-02 | 20 |
| Page: 1 |
Top |
Cell-cell communication analysis |
| Identification of potential cell-cell interactions between two cell types and their ligand-receptor pairs for different disease states |
| Ligand | Receptor | LRpair | Pathway | Tissue | Disease Stage |
| Page: 1 |
Top |
Single-cell gene regulatory network inference analysis |
| Find out the significant the regulons (TFs) and the target genes of each regulon across cell types for different disease states |
| TF | Cell Type | Tissue | Disease Stage | Target Gene | RSS | Regulon Activity |
| ∗The dot plots of a searched regulon are shown for all cell subpopulations in each disease state of each tissue based on the regulon specific score inferred using pySCENIC and by calculating the average expression. |
| Page: 1 |
Top |
Somatic mutation of malignant transformation related genes |
| Annotation of somatic variants for genes involved in malignant transformation |
| Hugo Symbol | Variant Class | Variant Classification | dbSNP RS | HGVSc | HGVSp | HGVSp Short | SWISSPROT | BIOTYPE | SIFT | PolyPhen | Tumor Sample Barcode | Tissue | Histology | Sex | Age | Stage | Therapy Types | Drugs | Outcome |
| LANCL1 | SNV | Missense_Mutation | c.919G>A | p.Asp307Asn | p.D307N | O43813 | protein_coding | deleterious(0) | benign(0.006) | TCGA-A8-A06Q-01 | Breast | breast invasive carcinoma | Female | <65 | III/IV | Unknown | Unknown | SD | |
| LANCL1 | SNV | Missense_Mutation | novel | c.1174G>A | p.Ala392Thr | p.A392T | O43813 | protein_coding | deleterious(0.04) | possibly_damaging(0.861) | TCGA-AO-A1KT-01 | Breast | breast invasive carcinoma | Female | >=65 | I/II | Chemotherapy | fluorouracil | SD |
| LANCL1 | SNV | Missense_Mutation | novel | c.1174N>A | p.Ala392Thr | p.A392T | O43813 | protein_coding | deleterious(0.04) | possibly_damaging(0.861) | TCGA-D8-A1JA-01 | Breast | breast invasive carcinoma | Female | <65 | III/IV | Chemotherapy | adriamycin | PD |
| LANCL1 | SNV | Missense_Mutation | rs780286969 | c.773N>T | p.Ser258Phe | p.S258F | O43813 | protein_coding | deleterious(0) | probably_damaging(0.962) | TCGA-DG-A2KK-01 | Cervix | cervical & endocervical cancer | Female | <65 | III/IV | Chemotherapy | cisplatin | SD |
| LANCL1 | SNV | Missense_Mutation | rs370249839 | c.352N>A | p.Ala118Thr | p.A118T | O43813 | protein_coding | tolerated(0.07) | probably_damaging(0.926) | TCGA-A6-2686-01 | Colorectum | colon adenocarcinoma | Female | >=65 | I/II | Unknown | Unknown | SD |
| LANCL1 | SNV | Missense_Mutation | rs760716528 | c.103N>T | p.Arg35Cys | p.R35C | O43813 | protein_coding | deleterious(0.02) | benign(0.009) | TCGA-AA-3811-01 | Colorectum | colon adenocarcinoma | Female | >=65 | III/IV | Unknown | Unknown | PD |
| LANCL1 | SNV | Missense_Mutation | rs750087496 | c.373A>G | p.Asn125Asp | p.N125D | O43813 | protein_coding | tolerated(0.08) | benign(0.013) | TCGA-AA-3833-01 | Colorectum | colon adenocarcinoma | Female | <65 | I/II | Unknown | Unknown | SD |
| LANCL1 | SNV | Missense_Mutation | c.350N>T | p.Ala117Val | p.A117V | O43813 | protein_coding | tolerated(0.05) | benign(0.011) | TCGA-AA-3966-01 | Colorectum | colon adenocarcinoma | Female | >=65 | I/II | Unknown | Unknown | SD | |
| LANCL1 | SNV | Missense_Mutation | c.1063N>G | p.Cys355Gly | p.C355G | O43813 | protein_coding | deleterious(0) | probably_damaging(0.999) | TCGA-AA-A010-01 | Colorectum | colon adenocarcinoma | Female | <65 | I/II | Chemotherapy | folinic | CR | |
| LANCL1 | SNV | Missense_Mutation | c.37N>C | p.Tyr13His | p.Y13H | O43813 | protein_coding | deleterious(0) | benign(0.003) | TCGA-AD-6889-01 | Colorectum | colon adenocarcinoma | Male | >=65 | I/II | Chemotherapy | xeloda | PD |
| Page: 1 2 3 4 |
Top |
Related drugs of malignant transformation related genes |
| Identification of chemicals and drugs interact with genes involved in malignant transfromation |
| (DGIdb 4.0) |
| Entrez ID | Symbol | Category | Interaction Types | Drug Claim Name | Drug Name | PMIDs |
| Page: 1 |

Copyright 2023-Present -The University of Texas Health Science Center at Houston |