
|
|||||
|
 | |
| |
| |
| |
| |
| |
|
Gene: LAMTOR3 |
Gene summary for LAMTOR3 |
| Gene information | Species | Human | Gene symbol | LAMTOR3 | Gene ID | 8649 |
| Gene name | late endosomal/lysosomal adaptor, MAPK and MTOR activator 3 | |
| Gene Alias | MAP2K1IP1 | |
| Cytomap | 4q23 | |
| Gene Type | protein-coding | GO ID | GO:0000165 | UniProtAcc | Q9UHA4 |
Top |
Malignant transformation analysis |
| Identification of the aberrant gene expression in precancerous and cancerous lesions by comparing the gene expression of stem-like cells in diseased tissues with normal stem cells |
| Entrez ID | Symbol | Replicates | Species | Organ | Tissue | Adj P-value | Log2FC | Malignancy |
| 8649 | LAMTOR3 | LZE2T | Human | Esophagus | ESCC | 2.48e-02 | 2.03e-01 | 0.082 |
| 8649 | LAMTOR3 | LZE4T | Human | Esophagus | ESCC | 1.01e-13 | 3.00e-01 | 0.0811 |
| 8649 | LAMTOR3 | LZE5T | Human | Esophagus | ESCC | 1.49e-02 | 2.03e-01 | 0.0514 |
| 8649 | LAMTOR3 | LZE7T | Human | Esophagus | ESCC | 2.64e-03 | 1.21e-01 | 0.0667 |
| 8649 | LAMTOR3 | LZE8T | Human | Esophagus | ESCC | 3.42e-12 | 2.36e-01 | 0.067 |
| 8649 | LAMTOR3 | LZE20T | Human | Esophagus | ESCC | 7.92e-06 | 1.08e-01 | 0.0662 |
| 8649 | LAMTOR3 | LZE22T | Human | Esophagus | ESCC | 8.03e-06 | 2.28e-01 | 0.068 |
| 8649 | LAMTOR3 | LZE24T | Human | Esophagus | ESCC | 1.65e-12 | 3.46e-01 | 0.0596 |
| 8649 | LAMTOR3 | LZE22D3 | Human | Esophagus | HGIN | 4.09e-03 | 2.52e-01 | 0.0653 |
| 8649 | LAMTOR3 | LZE21T | Human | Esophagus | ESCC | 5.55e-06 | 4.12e-01 | 0.0655 |
| 8649 | LAMTOR3 | LZE6T | Human | Esophagus | ESCC | 2.87e-03 | 2.15e-01 | 0.0845 |
| 8649 | LAMTOR3 | P1T-E | Human | Esophagus | ESCC | 3.60e-04 | 4.48e-01 | 0.0875 |
| 8649 | LAMTOR3 | P2T-E | Human | Esophagus | ESCC | 6.68e-54 | 8.57e-01 | 0.1177 |
| 8649 | LAMTOR3 | P4T-E | Human | Esophagus | ESCC | 1.02e-29 | 7.93e-01 | 0.1323 |
| 8649 | LAMTOR3 | P5T-E | Human | Esophagus | ESCC | 1.64e-11 | 1.84e-01 | 0.1327 |
| 8649 | LAMTOR3 | P8T-E | Human | Esophagus | ESCC | 1.40e-34 | 4.84e-01 | 0.0889 |
| 8649 | LAMTOR3 | P9T-E | Human | Esophagus | ESCC | 6.13e-12 | 2.59e-01 | 0.1131 |
| 8649 | LAMTOR3 | P10T-E | Human | Esophagus | ESCC | 1.26e-35 | 5.40e-01 | 0.116 |
| 8649 | LAMTOR3 | P11T-E | Human | Esophagus | ESCC | 5.02e-14 | 5.74e-01 | 0.1426 |
| 8649 | LAMTOR3 | P12T-E | Human | Esophagus | ESCC | 3.38e-41 | 6.89e-01 | 0.1122 |
| Page: 1 2 3 4 5 6 |
| Tissue | Expression Dynamics | Abbreviation |
| Esophagus | 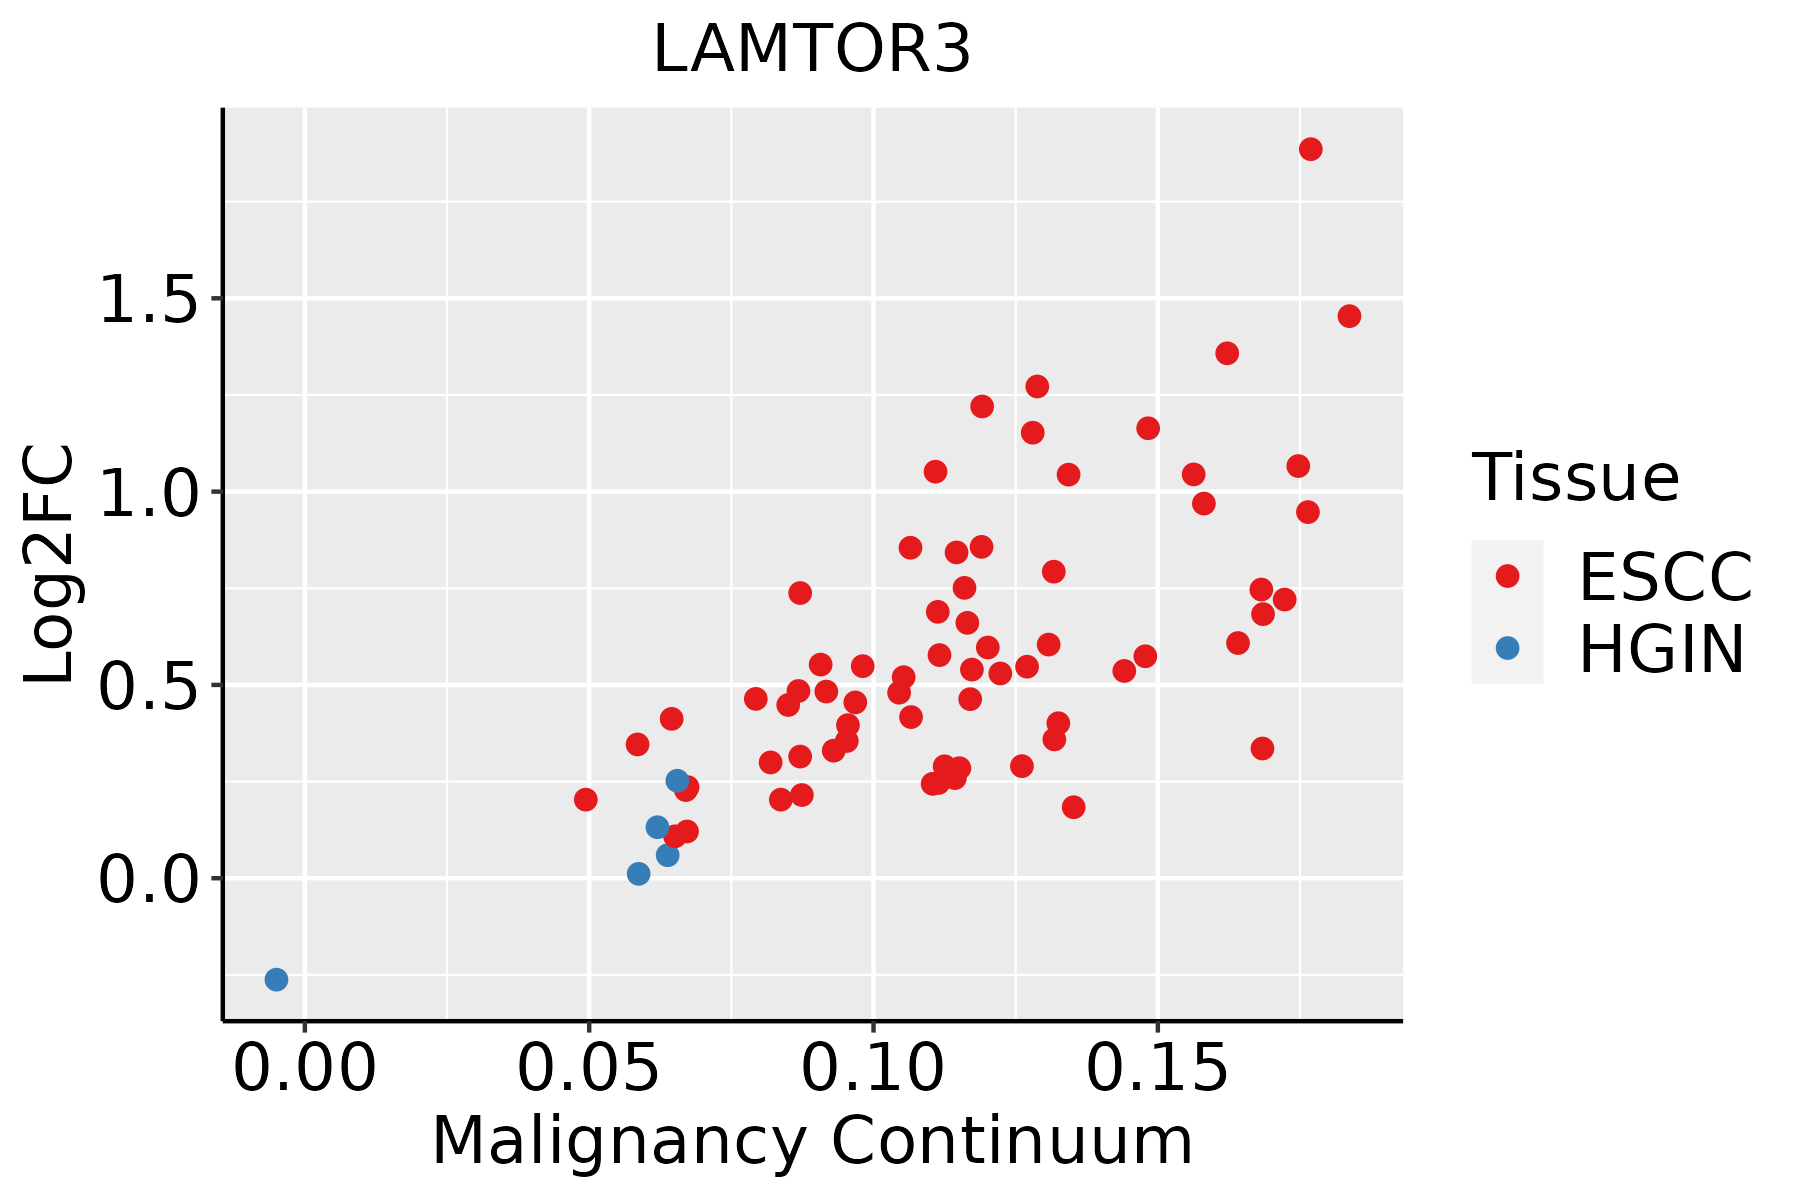 | ESCC: Esophageal squamous cell carcinoma |
| HGIN: High-grade intraepithelial neoplasias | ||
| LGIN: Low-grade intraepithelial neoplasias | ||
| Liver | 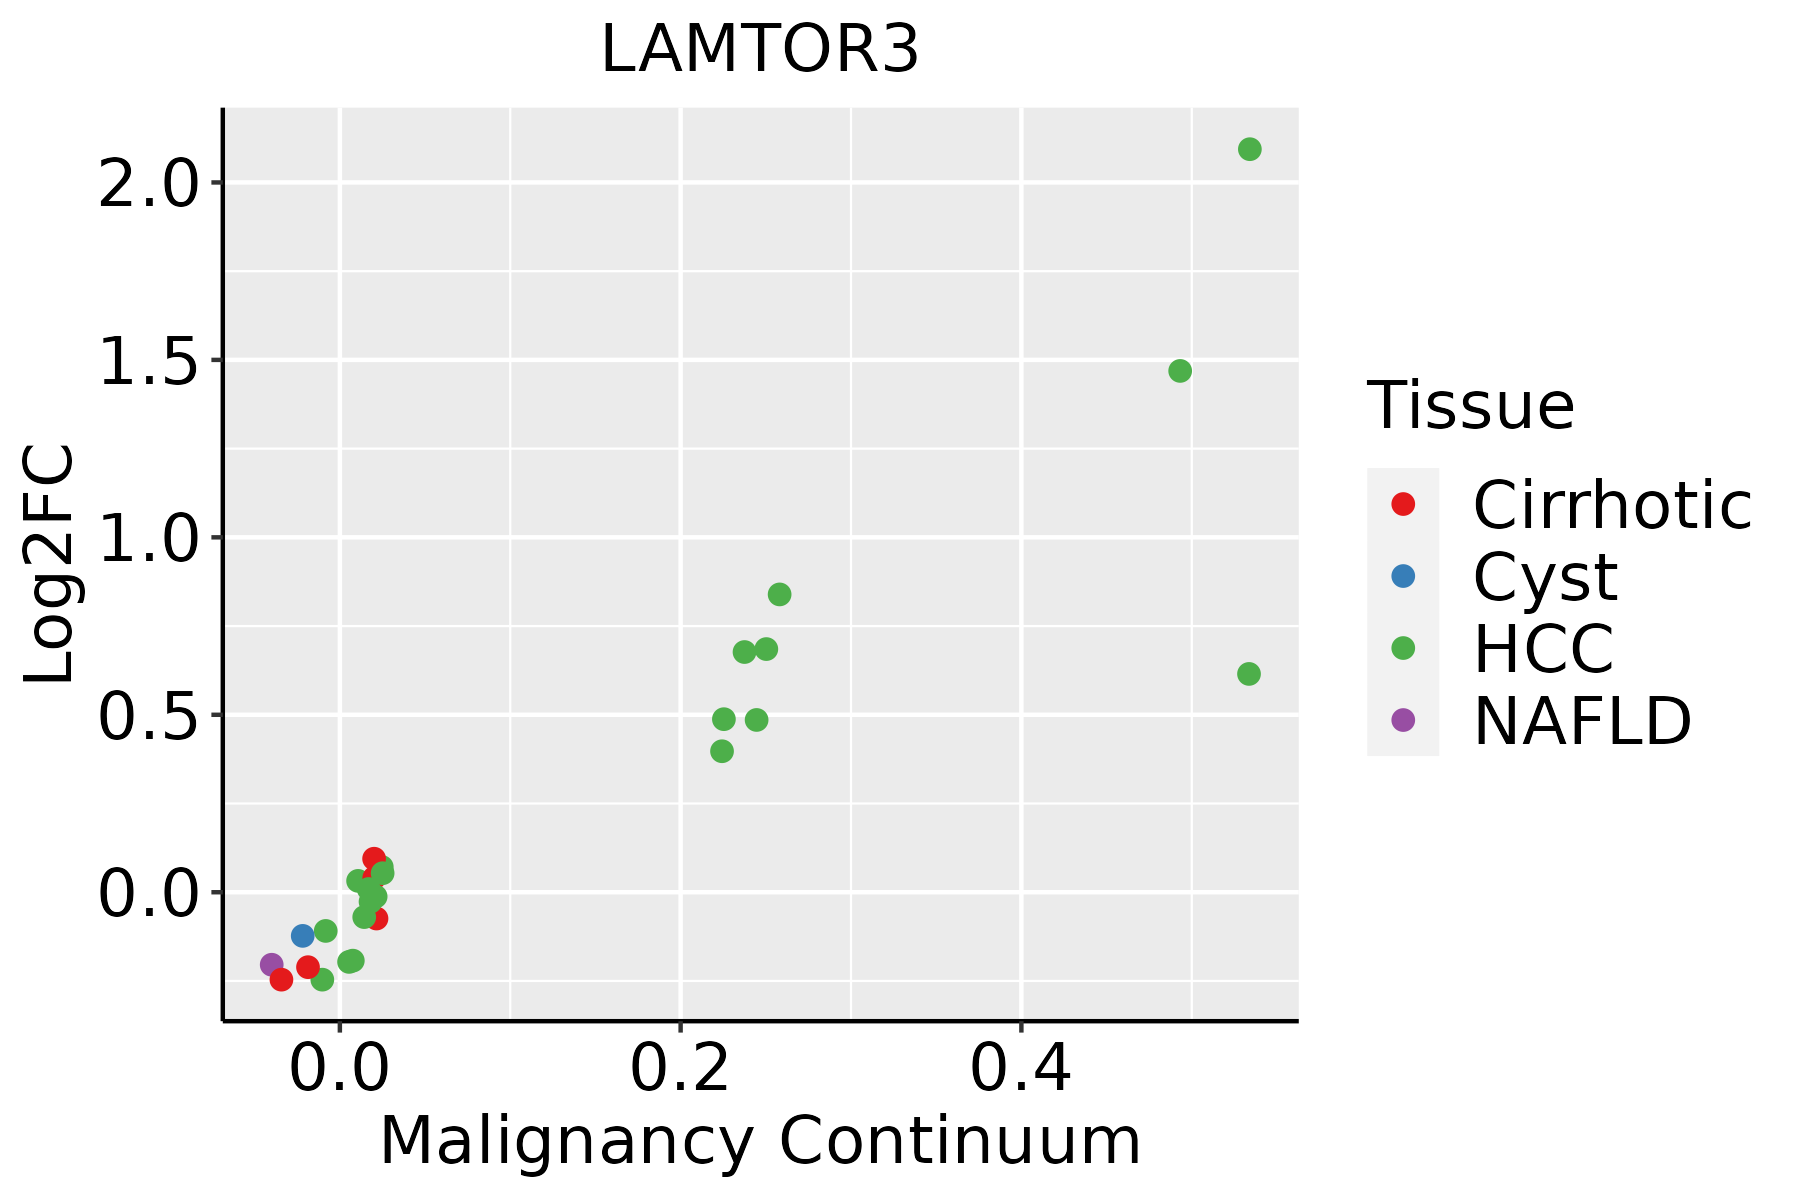 | HCC: Hepatocellular carcinoma |
| NAFLD: Non-alcoholic fatty liver disease | ||
| Oral Cavity | 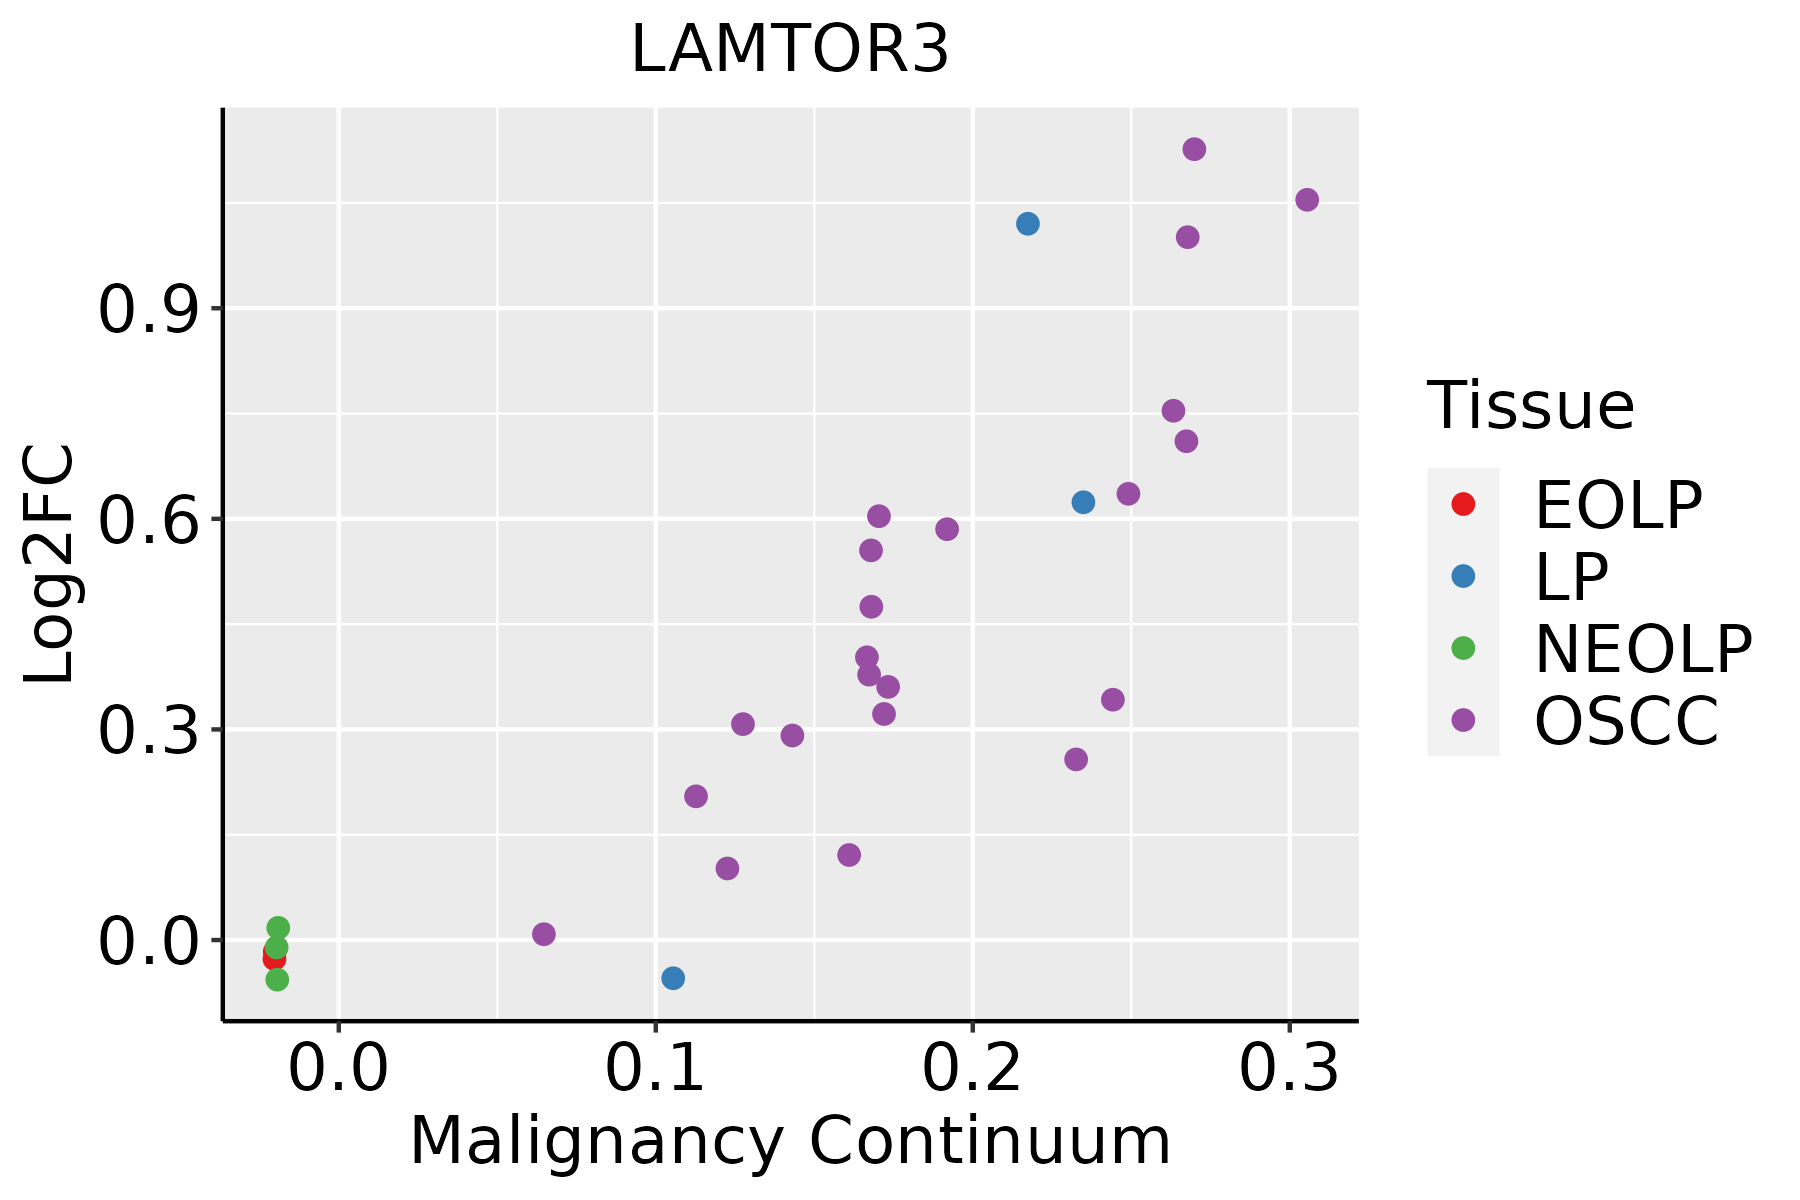 | EOLP: Erosive Oral lichen planus |
| LP: leukoplakia | ||
| NEOLP: Non-erosive oral lichen planus | ||
| OSCC: Oral squamous cell carcinoma | ||
| Skin | 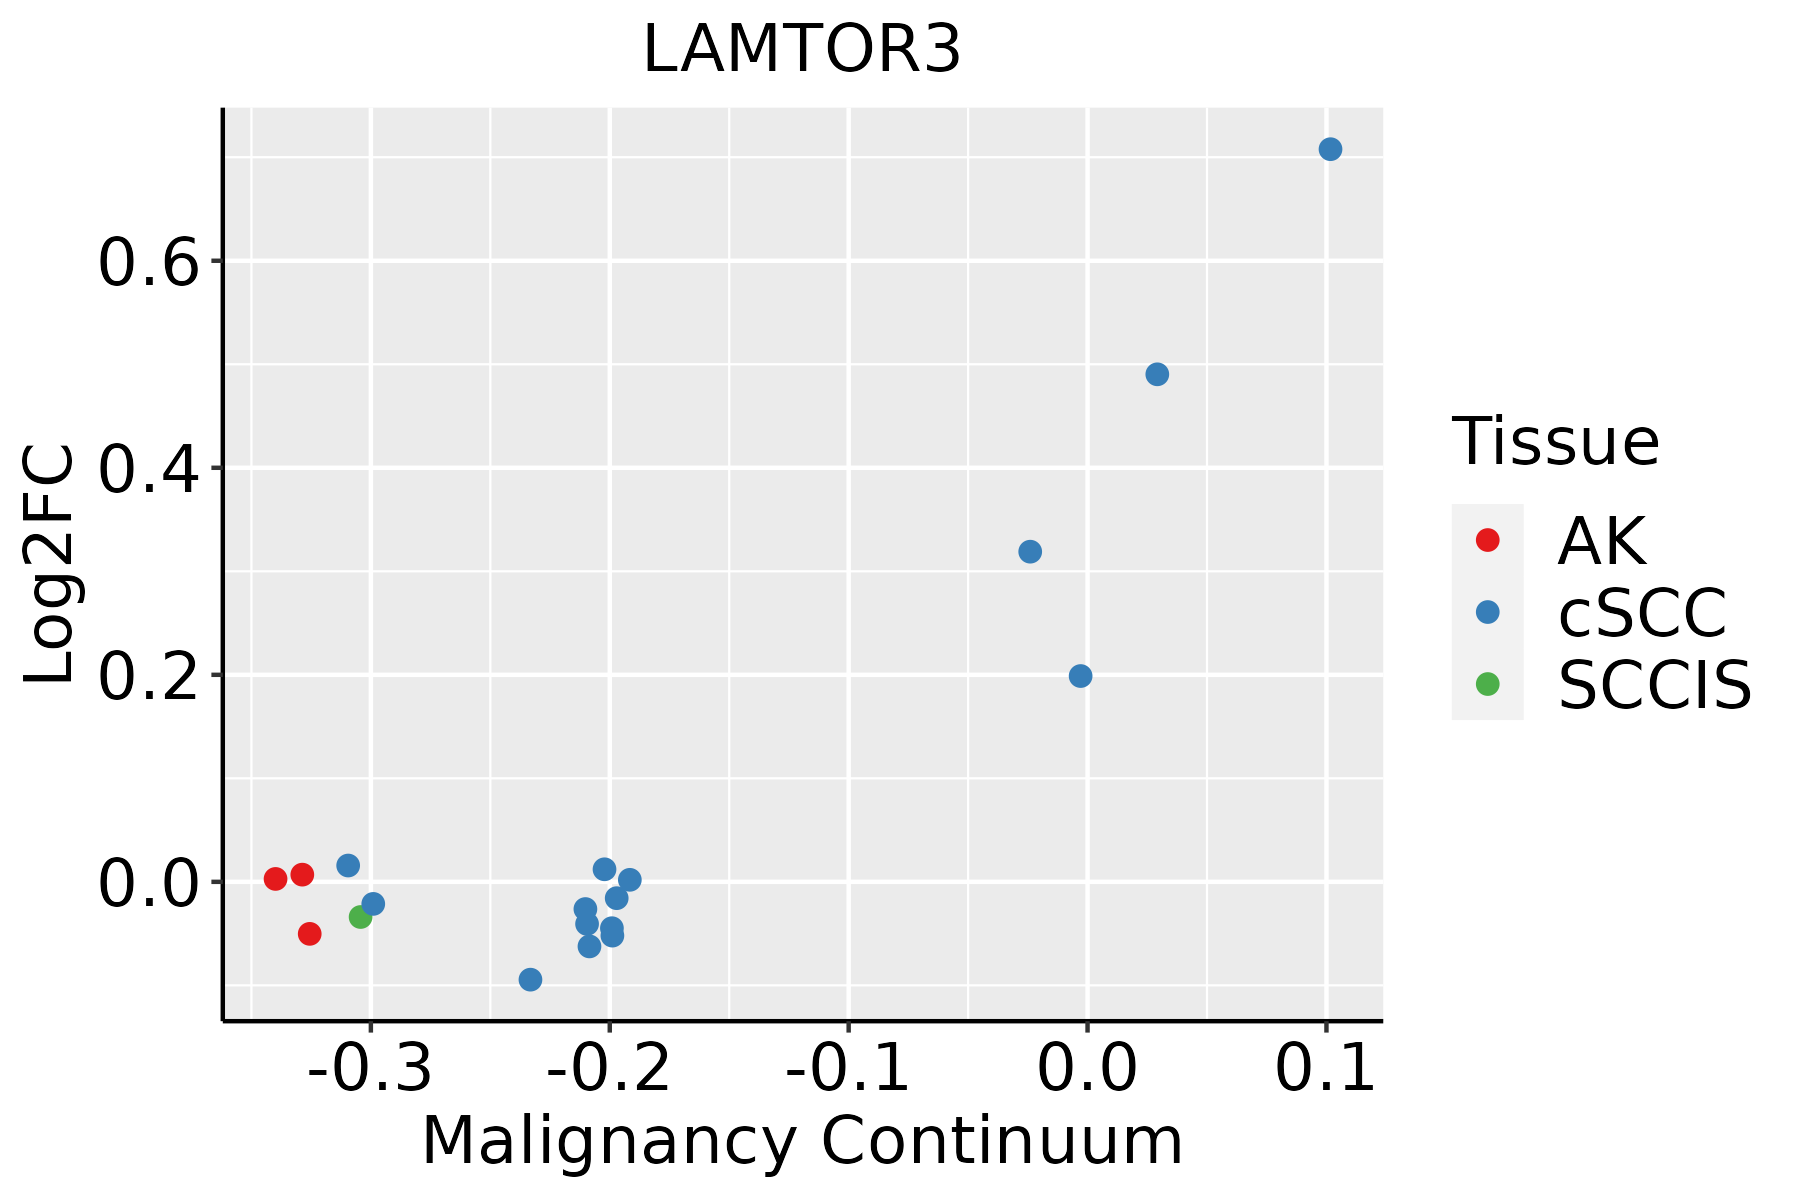 | AK: Actinic keratosis |
| cSCC: Cutaneous squamous cell carcinoma | ||
| SCCIS:squamous cell carcinoma in situ |
| ∗log2FC in expression of this searched gene in stem-like cells from each diseased tissue sample relative to stem-like cells in normal samples in each tissue plotted against the malignancy continuum. Samples are colored based on if they are from different disease stage. |
Top |
Malignant transformation related pathway analysis |
| Find out the enriched GO biological processes and KEGG pathways involved in transition from healthy to precancer to cancer |
| Tissue | Disease Stage | Enriched GO biological Processes |
| Colorectum | AD |  |
| Colorectum | SER |  |
| Colorectum | MSS |  |
| Colorectum | MSI-H |  |
| Colorectum | FAP |  |
| ∗Top 15 enriched GO BP terms are showed in the bar plot of each disease state in each tissue. Each row represents a significant GO biological process which is colored according to the -log10(p.adjust). |
| Page: 1 2 3 4 5 6 7 8 9 |
| GO ID | Tissue | Disease Stage | Description | Gene Ratio | Bg Ratio | pvalue | p.adjust | Count |
| GO:003367420 | Esophagus | ESCC | positive regulation of kinase activity | 260/8552 | 467/18723 | 7.26e-06 | 7.22e-05 | 260 |
| GO:00432007 | Esophagus | ESCC | response to amino acid | 74/8552 | 116/18723 | 6.23e-05 | 4.76e-04 | 74 |
| GO:000110110 | Esophagus | ESCC | response to acid chemical | 84/8552 | 135/18723 | 7.70e-05 | 5.74e-04 | 84 |
| GO:00319294 | Esophagus | ESCC | TOR signaling | 79/8552 | 126/18723 | 8.57e-05 | 6.21e-04 | 79 |
| GO:00712305 | Esophagus | ESCC | cellular response to amino acid stimulus | 48/8552 | 71/18723 | 1.55e-04 | 1.03e-03 | 48 |
| GO:00712296 | Esophagus | ESCC | cellular response to acid chemical | 52/8552 | 80/18723 | 3.79e-04 | 2.20e-03 | 52 |
| GO:00320061 | Esophagus | ESCC | regulation of TOR signaling | 63/8552 | 104/18723 | 1.55e-03 | 7.29e-03 | 63 |
| GO:00320082 | Esophagus | ESCC | positive regulation of TOR signaling | 31/8552 | 47/18723 | 4.01e-03 | 1.62e-02 | 31 |
| GO:00011013 | Liver | Cirrhotic | response to acid chemical | 52/4634 | 135/18723 | 2.65e-04 | 2.36e-03 | 52 |
| GO:00432002 | Liver | Cirrhotic | response to amino acid | 45/4634 | 116/18723 | 5.54e-04 | 4.36e-03 | 45 |
| GO:0071229 | Liver | Cirrhotic | cellular response to acid chemical | 31/4634 | 80/18723 | 3.83e-03 | 2.10e-02 | 31 |
| GO:00319292 | Liver | Cirrhotic | TOR signaling | 44/4634 | 126/18723 | 6.69e-03 | 3.30e-02 | 44 |
| GO:0071230 | Liver | Cirrhotic | cellular response to amino acid stimulus | 27/4634 | 71/18723 | 8.90e-03 | 4.11e-02 | 27 |
| GO:00319291 | Liver | HCC | TOR signaling | 78/7958 | 126/18723 | 8.49e-06 | 9.97e-05 | 78 |
| GO:000110111 | Liver | HCC | response to acid chemical | 79/7958 | 135/18723 | 1.24e-04 | 1.03e-03 | 79 |
| GO:0032006 | Liver | HCC | regulation of TOR signaling | 63/7958 | 104/18723 | 1.50e-04 | 1.20e-03 | 63 |
| GO:004320011 | Liver | HCC | response to amino acid | 68/7958 | 116/18723 | 3.31e-04 | 2.33e-03 | 68 |
| GO:0032008 | Liver | HCC | positive regulation of TOR signaling | 31/7958 | 47/18723 | 9.90e-04 | 5.71e-03 | 31 |
| GO:003367411 | Liver | HCC | positive regulation of kinase activity | 230/7958 | 467/18723 | 1.72e-03 | 8.95e-03 | 230 |
| GO:00712291 | Liver | HCC | cellular response to acid chemical | 45/7958 | 80/18723 | 9.02e-03 | 3.48e-02 | 45 |
| Page: 1 2 |
| Pathway ID | Tissue | Disease Stage | Description | Gene Ratio | Bg Ratio | pvalue | p.adjust | qvalue | Count |
| hsa041505 | Esophagus | ESCC | mTOR signaling pathway | 98/4205 | 156/8465 | 5.81e-04 | 1.95e-03 | 9.97e-04 | 98 |
| hsa0415013 | Esophagus | ESCC | mTOR signaling pathway | 98/4205 | 156/8465 | 5.81e-04 | 1.95e-03 | 9.97e-04 | 98 |
| hsa041502 | Liver | HCC | mTOR signaling pathway | 95/4020 | 156/8465 | 4.70e-04 | 1.99e-03 | 1.11e-03 | 95 |
| hsa0415011 | Liver | HCC | mTOR signaling pathway | 95/4020 | 156/8465 | 4.70e-04 | 1.99e-03 | 1.11e-03 | 95 |
| hsa0401014 | Oral cavity | OSCC | MAPK signaling pathway | 165/3704 | 302/8465 | 7.11e-05 | 2.74e-04 | 1.40e-04 | 165 |
| hsa041504 | Oral cavity | OSCC | mTOR signaling pathway | 90/3704 | 156/8465 | 2.87e-04 | 9.15e-04 | 4.66e-04 | 90 |
| hsa0401015 | Oral cavity | OSCC | MAPK signaling pathway | 165/3704 | 302/8465 | 7.11e-05 | 2.74e-04 | 1.40e-04 | 165 |
| hsa0415012 | Oral cavity | OSCC | mTOR signaling pathway | 90/3704 | 156/8465 | 2.87e-04 | 9.15e-04 | 4.66e-04 | 90 |
| Page: 1 |
Top |
Cell-cell communication analysis |
| Identification of potential cell-cell interactions between two cell types and their ligand-receptor pairs for different disease states |
| Ligand | Receptor | LRpair | Pathway | Tissue | Disease Stage |
| Page: 1 |
Top |
Single-cell gene regulatory network inference analysis |
| Find out the significant the regulons (TFs) and the target genes of each regulon across cell types for different disease states |
| TF | Cell Type | Tissue | Disease Stage | Target Gene | RSS | Regulon Activity |
| ∗The dot plots of a searched regulon are shown for all cell subpopulations in each disease state of each tissue based on the regulon specific score inferred using pySCENIC and by calculating the average expression. |
| Page: 1 |
Top |
Somatic mutation of malignant transformation related genes |
| Annotation of somatic variants for genes involved in malignant transformation |
| Hugo Symbol | Variant Class | Variant Classification | dbSNP RS | HGVSc | HGVSp | HGVSp Short | SWISSPROT | BIOTYPE | SIFT | PolyPhen | Tumor Sample Barcode | Tissue | Histology | Sex | Age | Stage | Therapy Types | Drugs | Outcome |
| LAMTOR3 | SNV | Missense_Mutation | novel | c.253N>T | p.Arg85Cys | p.R85C | Q9UHA4 | protein_coding | tolerated(0.11) | possibly_damaging(0.797) | TCGA-AP-A059-01 | Endometrium | uterine corpus endometrioid carcinoma | Female | >=65 | I/II | Unknown | Unknown | SD |
| LAMTOR3 | SNV | Missense_Mutation | novel | c.131N>A | p.Ala44Asp | p.A44D | Q9UHA4 | protein_coding | deleterious(0) | probably_damaging(0.999) | TCGA-AP-A0LM-01 | Endometrium | uterine corpus endometrioid carcinoma | Female | <65 | III/IV | Chemotherapy | cisplatin | SD |
| LAMTOR3 | SNV | Missense_Mutation | novel | c.32A>C | p.Lys11Thr | p.K11T | Q9UHA4 | protein_coding | tolerated(0.32) | benign(0.279) | TCGA-BS-A0UF-01 | Endometrium | uterine corpus endometrioid carcinoma | Female | >=65 | I/II | Unknown | Unknown | SD |
| LAMTOR3 | SNV | Missense_Mutation | rs780467121 | c.137G>A | p.Arg46Gln | p.R46Q | Q9UHA4 | protein_coding | deleterious(0.02) | probably_damaging(0.999) | TCGA-D1-A17Q-01 | Endometrium | uterine corpus endometrioid carcinoma | Female | <65 | I/II | Unknown | Unknown | SD |
| LAMTOR3 | SNV | Missense_Mutation | c.167N>T | p.Ala56Val | p.A56V | Q9UHA4 | protein_coding | deleterious(0) | probably_damaging(0.999) | TCGA-D1-A17R-01 | Endometrium | uterine corpus endometrioid carcinoma | Female | <65 | I/II | Unknown | Unknown | SD | |
| LAMTOR3 | SNV | Missense_Mutation | c.88N>T | p.Val30Leu | p.V30L | Q9UHA4 | protein_coding | deleterious(0.01) | benign(0.014) | TCGA-CC-A3M9-01 | Liver | liver hepatocellular carcinoma | Male | <65 | III/IV | Unknown | Unknown | PD | |
| LAMTOR3 | SNV | Missense_Mutation | c.112N>C | p.Asp38His | p.D38H | Q9UHA4 | protein_coding | deleterious(0) | possibly_damaging(0.881) | TCGA-86-8073-01 | Lung | lung adenocarcinoma | Male | <65 | I/II | Unknown | Unknown | SD | |
| LAMTOR3 | SNV | Missense_Mutation | novel | c.85N>A | p.Gly29Arg | p.G29R | Q9UHA4 | protein_coding | deleterious(0) | probably_damaging(0.998) | TCGA-BA-5558-01 | Oral cavity | head & neck squamous cell carcinoma | Male | >=65 | I/II | Unknown | Unknown | SD |
| Page: 1 |
Top |
Related drugs of malignant transformation related genes |
| Identification of chemicals and drugs interact with genes involved in malignant transfromation |
| (DGIdb 4.0) |
| Entrez ID | Symbol | Category | Interaction Types | Drug Claim Name | Drug Name | PMIDs |
| Page: 1 |

Copyright 2023-Present -The University of Texas Health Science Center at Houston |