
|
|||||
|
 | |
| |
| |
| |
| |
| |
|
Gene: LAMTOR2 |
Gene summary for LAMTOR2 |
| Gene information | Species | Human | Gene symbol | LAMTOR2 | Gene ID | 28956 |
| Gene name | late endosomal/lysosomal adaptor, MAPK and MTOR activator 2 | |
| Gene Alias | ENDAP | |
| Cytomap | 1q22 | |
| Gene Type | protein-coding | GO ID | GO:0000165 | UniProtAcc | Q9Y2Q5 |
Top |
Malignant transformation analysis |
| Identification of the aberrant gene expression in precancerous and cancerous lesions by comparing the gene expression of stem-like cells in diseased tissues with normal stem cells |
| Entrez ID | Symbol | Replicates | Species | Organ | Tissue | Adj P-value | Log2FC | Malignancy |
| 28956 | LAMTOR2 | GSM4909285 | Human | Breast | IDC | 3.63e-21 | 5.14e-01 | 0.21 |
| 28956 | LAMTOR2 | GSM4909287 | Human | Breast | IDC | 2.63e-06 | 3.96e-01 | 0.2057 |
| 28956 | LAMTOR2 | GSM4909291 | Human | Breast | IDC | 1.40e-05 | 4.20e-01 | 0.1753 |
| 28956 | LAMTOR2 | GSM4909293 | Human | Breast | IDC | 2.73e-11 | 4.16e-01 | 0.1581 |
| 28956 | LAMTOR2 | GSM4909294 | Human | Breast | IDC | 3.19e-08 | 4.02e-01 | 0.2022 |
| 28956 | LAMTOR2 | GSM4909296 | Human | Breast | IDC | 6.32e-12 | 3.49e-01 | 0.1524 |
| 28956 | LAMTOR2 | GSM4909297 | Human | Breast | IDC | 1.49e-04 | -1.01e-01 | 0.1517 |
| 28956 | LAMTOR2 | GSM4909302 | Human | Breast | IDC | 4.44e-09 | 4.07e-01 | 0.1545 |
| 28956 | LAMTOR2 | GSM4909304 | Human | Breast | IDC | 2.94e-07 | 3.95e-01 | 0.1636 |
| 28956 | LAMTOR2 | GSM4909306 | Human | Breast | IDC | 7.49e-12 | 4.96e-01 | 0.1564 |
| 28956 | LAMTOR2 | GSM4909307 | Human | Breast | IDC | 5.07e-10 | 4.63e-01 | 0.1569 |
| 28956 | LAMTOR2 | GSM4909308 | Human | Breast | IDC | 1.01e-28 | 6.53e-01 | 0.158 |
| 28956 | LAMTOR2 | GSM4909311 | Human | Breast | IDC | 8.61e-26 | 2.63e-02 | 0.1534 |
| 28956 | LAMTOR2 | GSM4909312 | Human | Breast | IDC | 3.57e-10 | 2.24e-01 | 0.1552 |
| 28956 | LAMTOR2 | GSM4909313 | Human | Breast | IDC | 4.83e-03 | 1.70e-01 | 0.0391 |
| 28956 | LAMTOR2 | GSM4909315 | Human | Breast | IDC | 8.04e-08 | 4.36e-01 | 0.21 |
| 28956 | LAMTOR2 | GSM4909316 | Human | Breast | IDC | 1.56e-05 | 3.77e-01 | 0.21 |
| 28956 | LAMTOR2 | GSM4909317 | Human | Breast | IDC | 2.69e-04 | 3.36e-01 | 0.1355 |
| 28956 | LAMTOR2 | GSM4909318 | Human | Breast | IDC | 4.48e-07 | 5.21e-01 | 0.2031 |
| 28956 | LAMTOR2 | GSM4909319 | Human | Breast | IDC | 5.04e-34 | -1.01e-01 | 0.1563 |
| Page: 1 2 3 4 5 6 7 8 9 10 11 12 |
| Tissue | Expression Dynamics | Abbreviation |
| Breast |  | IDC: Invasive ductal carcinoma |
| DCIS: Ductal carcinoma in situ | ||
| Precancer(BRCA1-mut): Precancerous lesion from BRCA1 mutation carriers | ||
| Cervix | 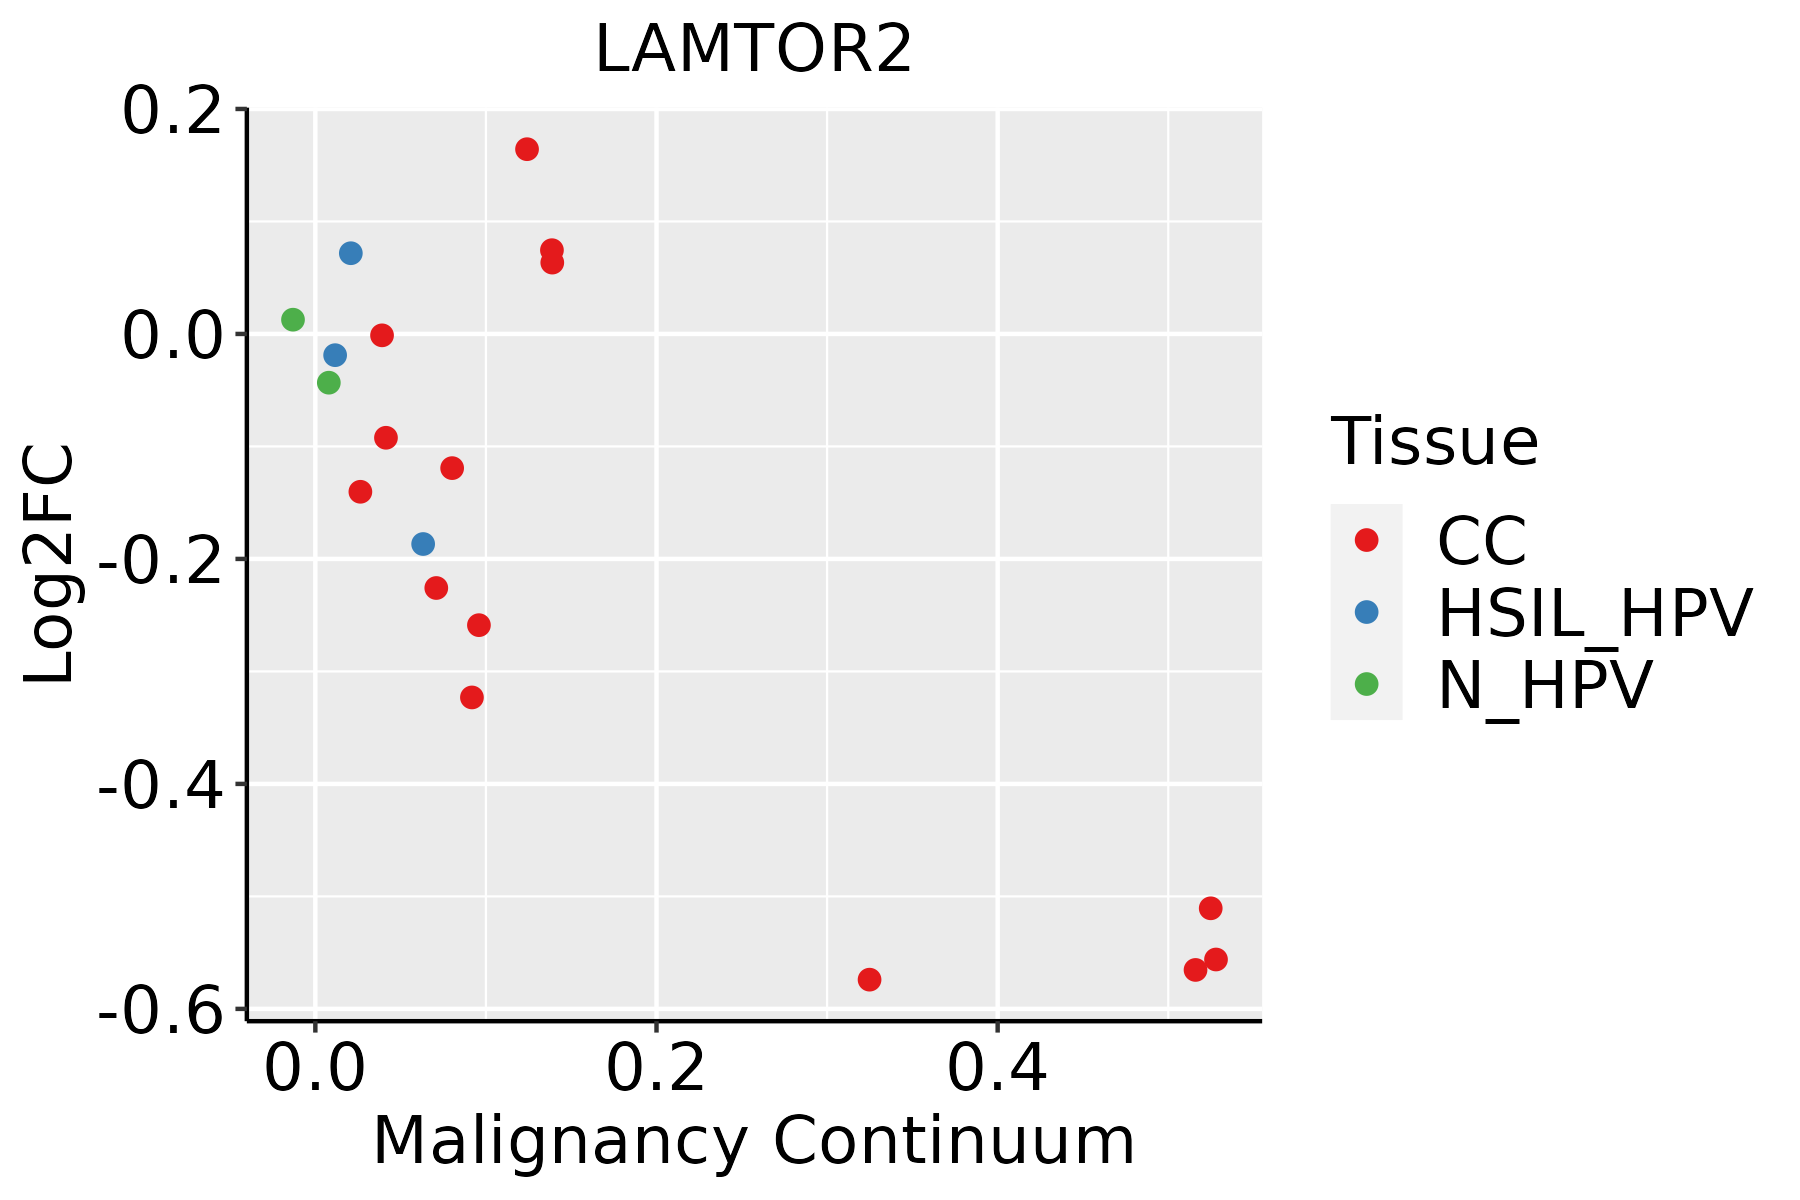 | CC: Cervix cancer |
| HSIL_HPV: HPV-infected high-grade squamous intraepithelial lesions | ||
| N_HPV: HPV-infected normal cervix | ||
| Colorectum (GSE201348) |  | FAP: Familial adenomatous polyposis |
| CRC: Colorectal cancer | ||
| Colorectum (HTA11) |  | AD: Adenomas |
| SER: Sessile serrated lesions | ||
| MSI-H: Microsatellite-high colorectal cancer | ||
| MSS: Microsatellite stable colorectal cancer | ||
| Endometrium | 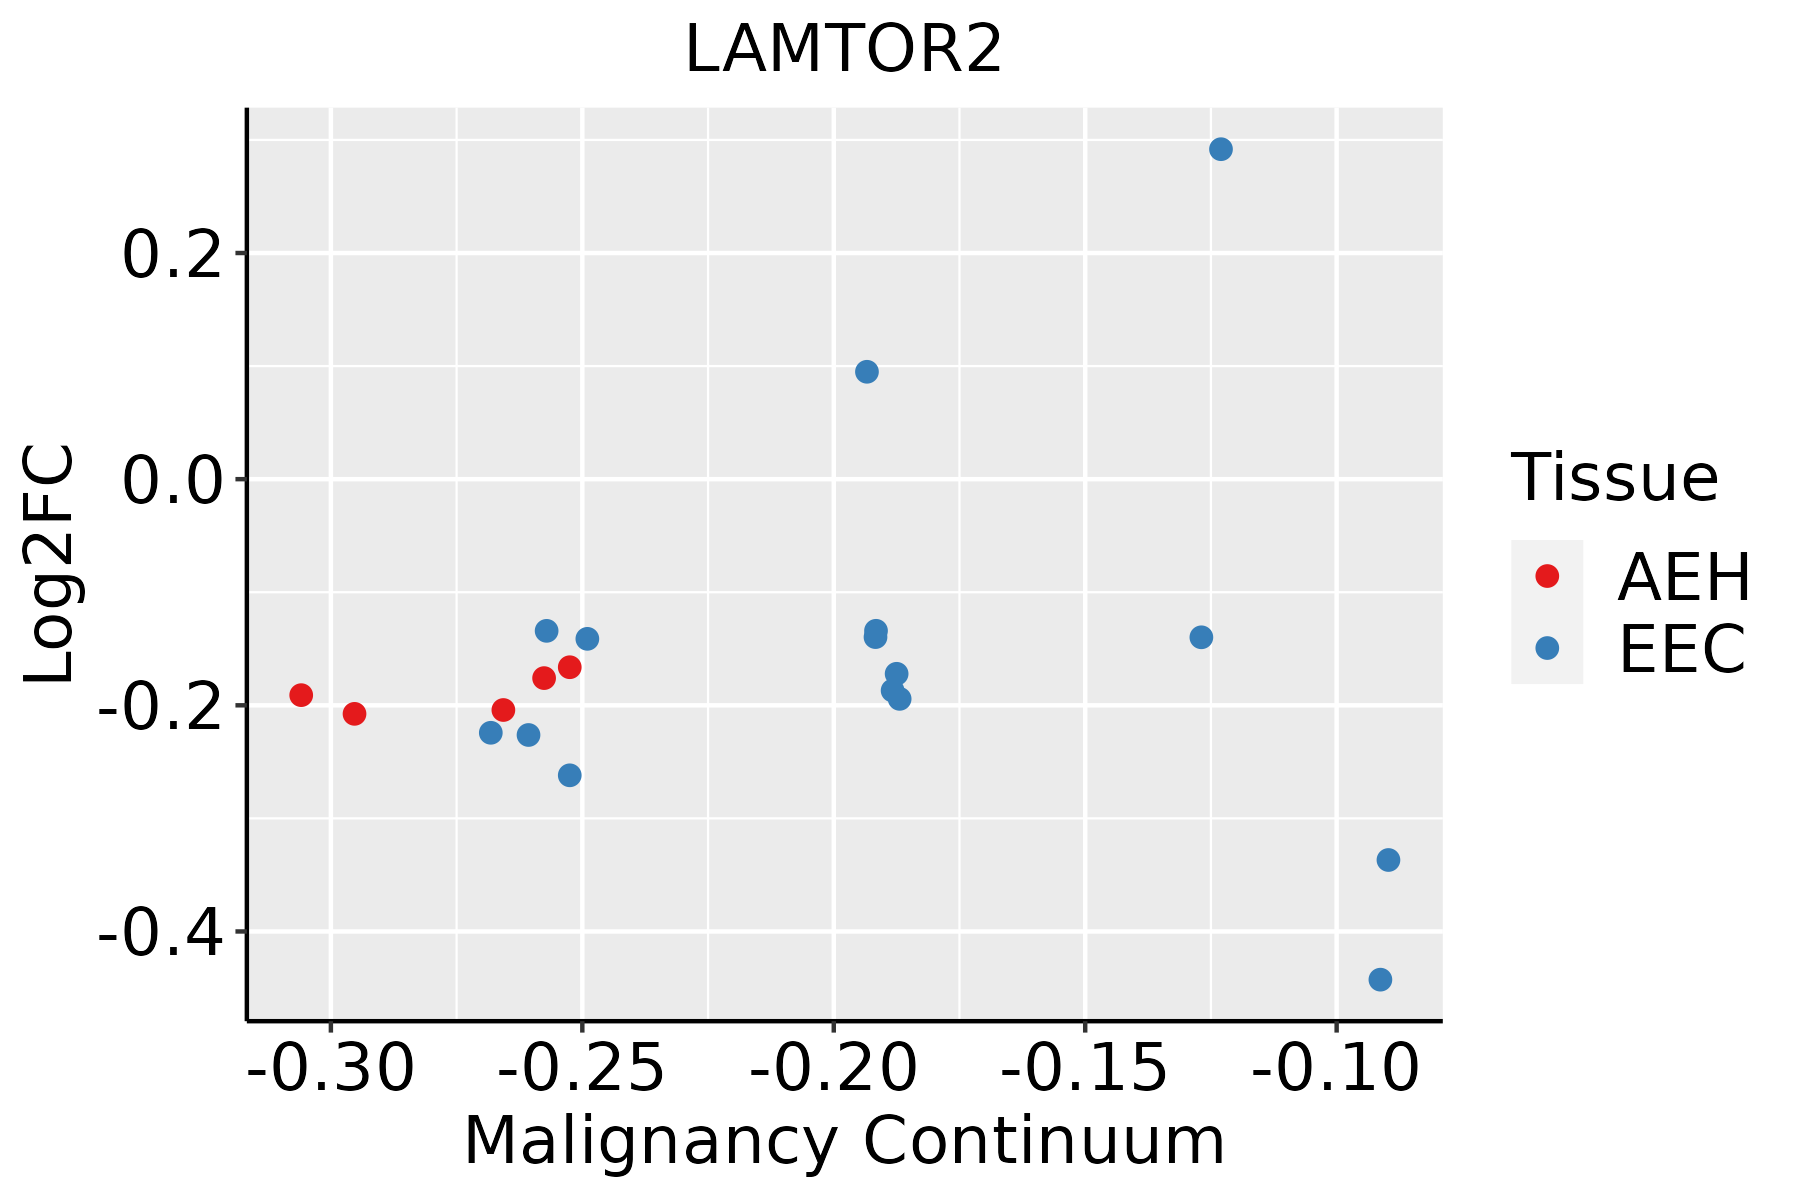 | AEH: Atypical endometrial hyperplasia |
| EEC: Endometrioid Cancer | ||
| Esophagus |  | ESCC: Esophageal squamous cell carcinoma |
| HGIN: High-grade intraepithelial neoplasias | ||
| LGIN: Low-grade intraepithelial neoplasias | ||
| Liver | 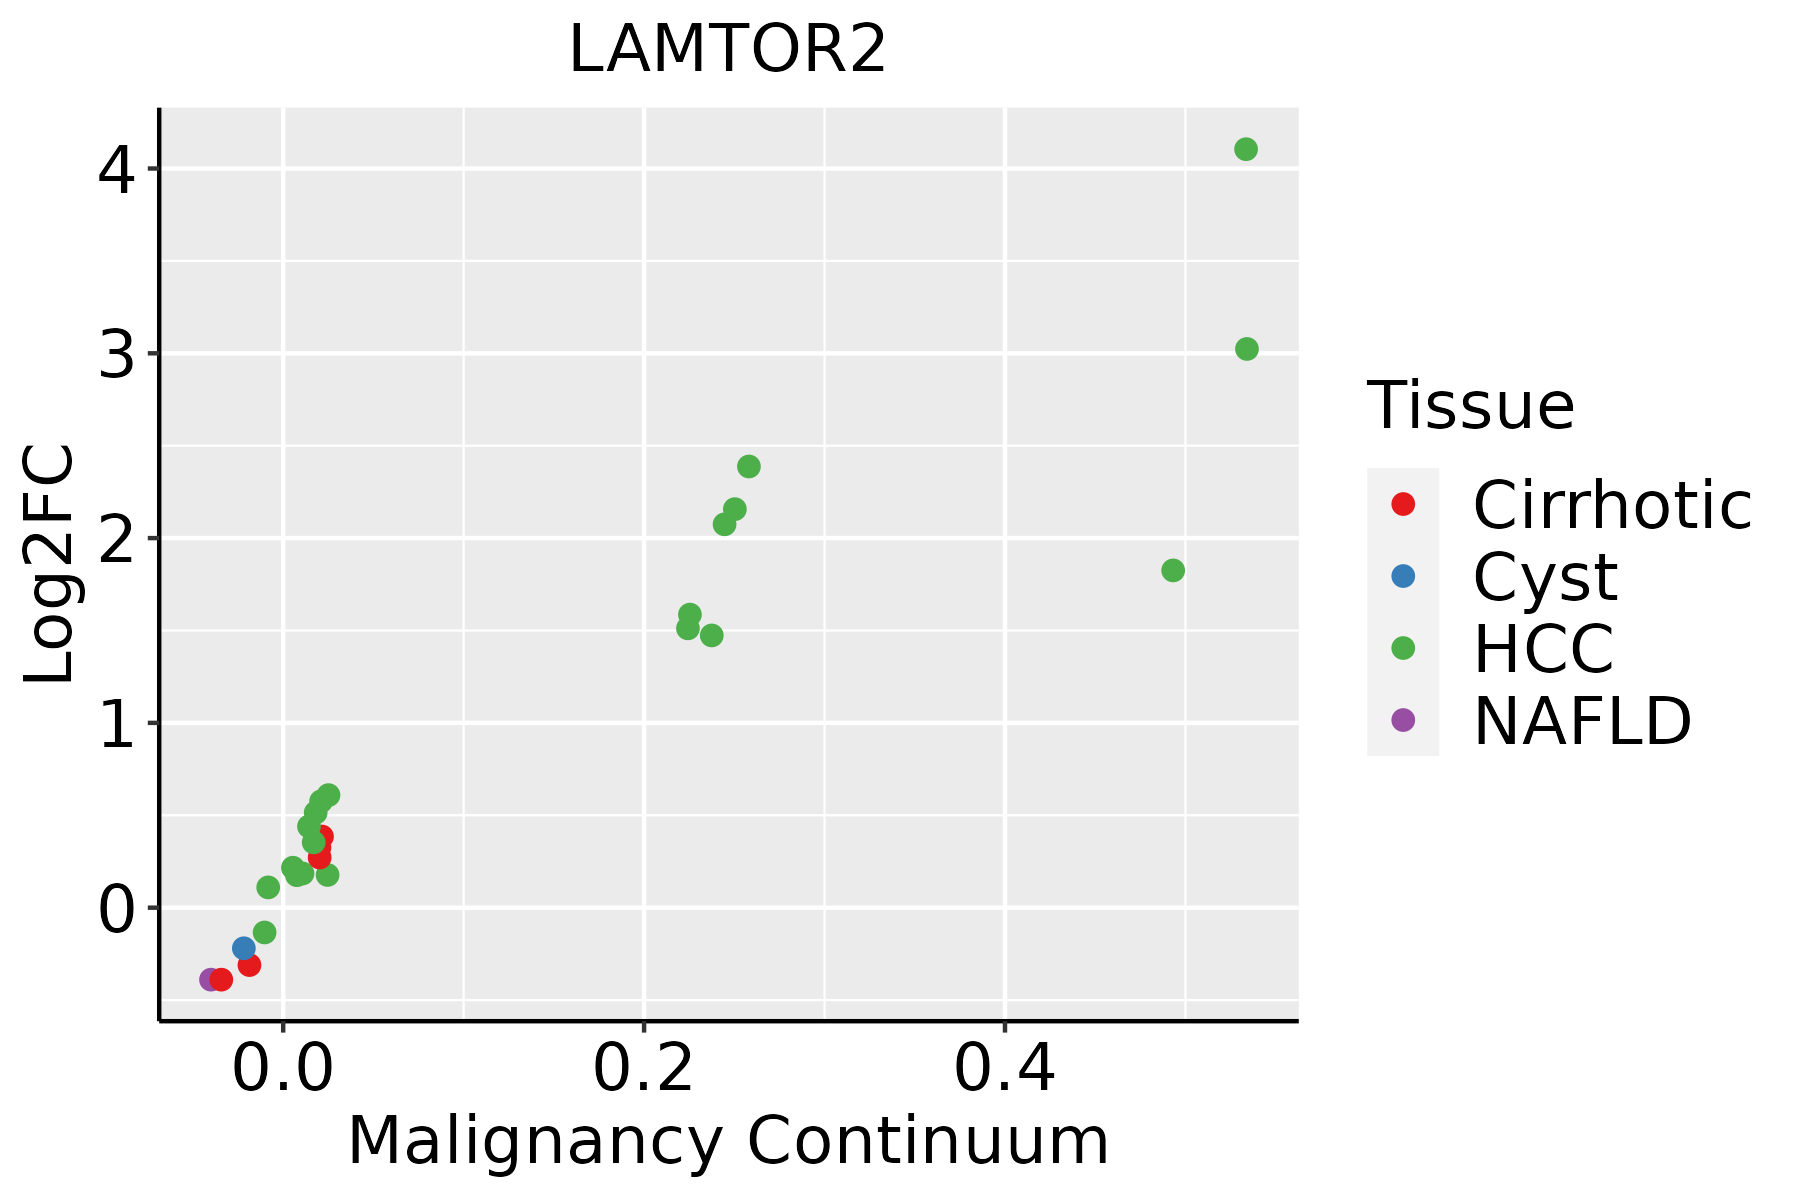 | HCC: Hepatocellular carcinoma |
| NAFLD: Non-alcoholic fatty liver disease | ||
| Oral Cavity | 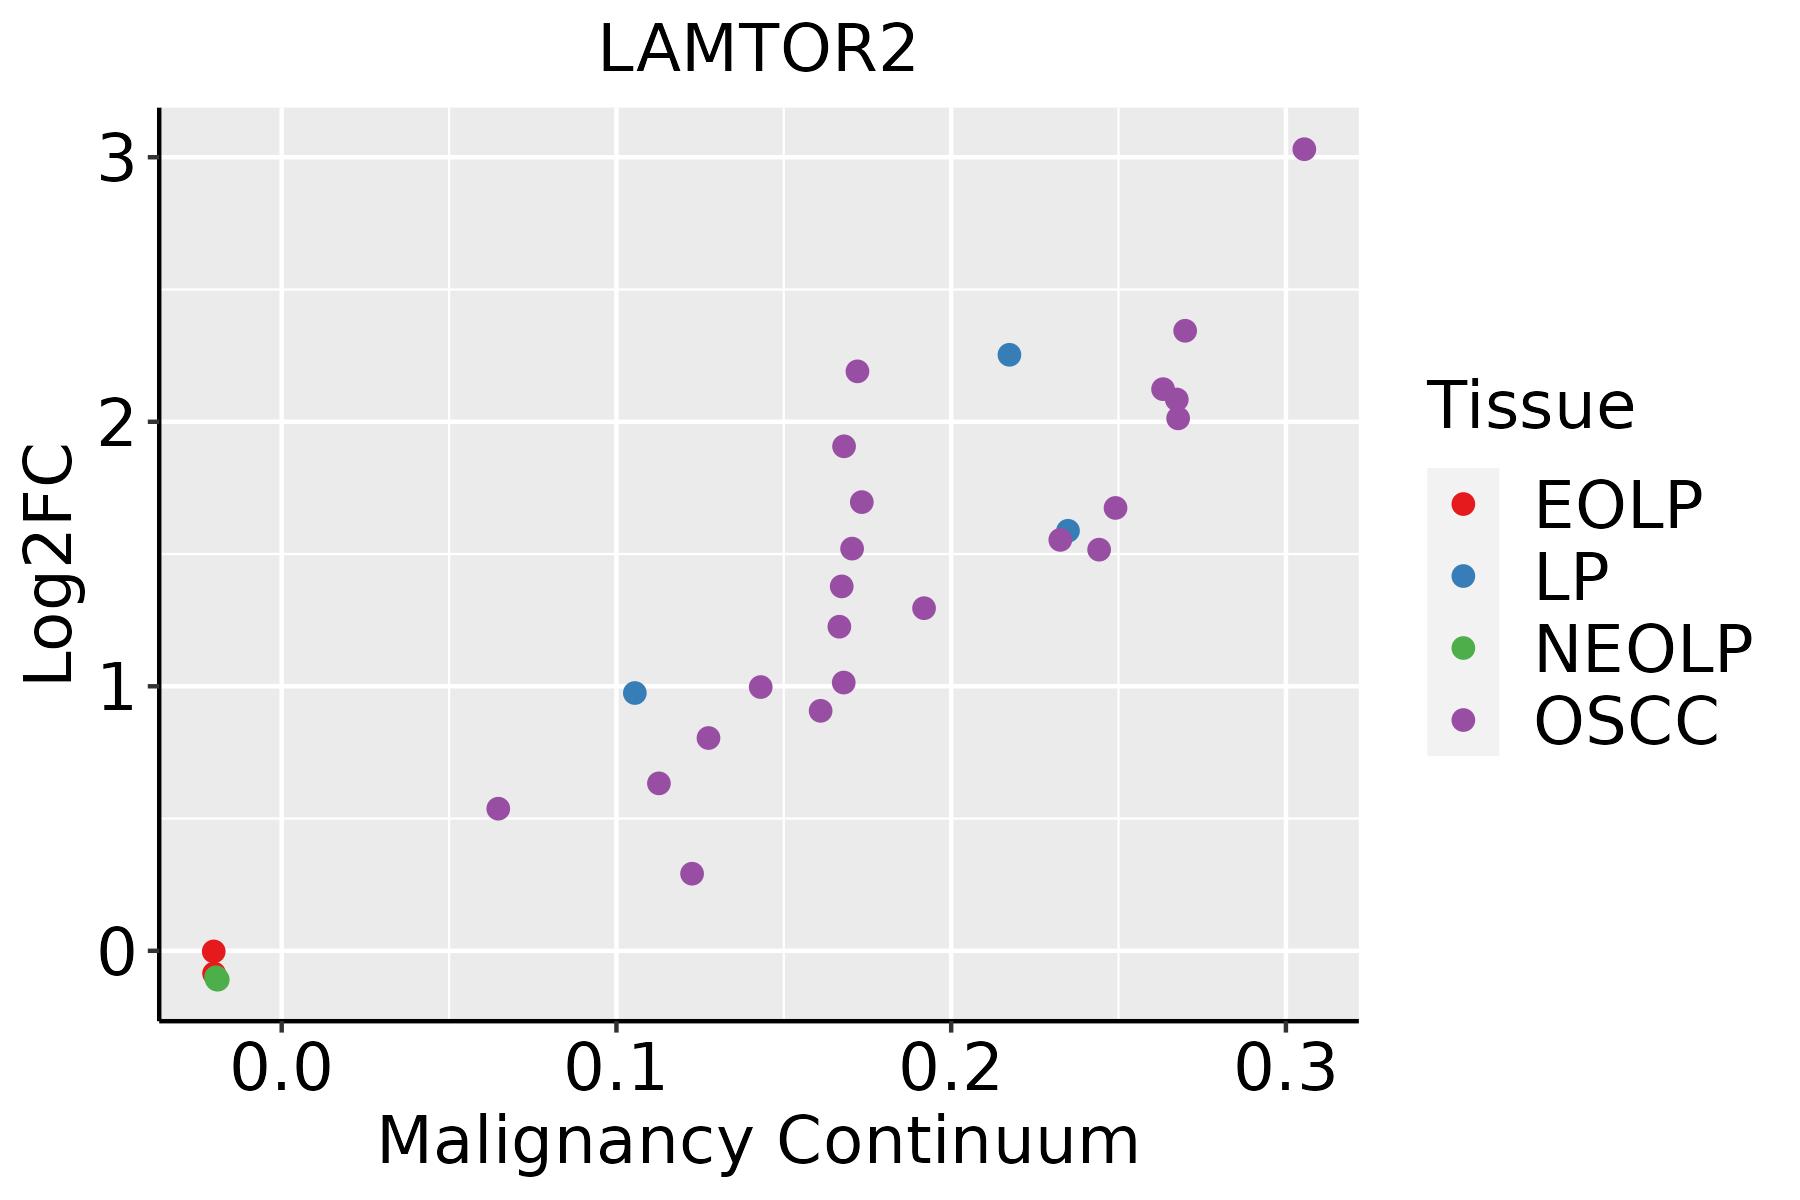 | EOLP: Erosive Oral lichen planus |
| LP: leukoplakia | ||
| NEOLP: Non-erosive oral lichen planus | ||
| OSCC: Oral squamous cell carcinoma | ||
| Prostate | 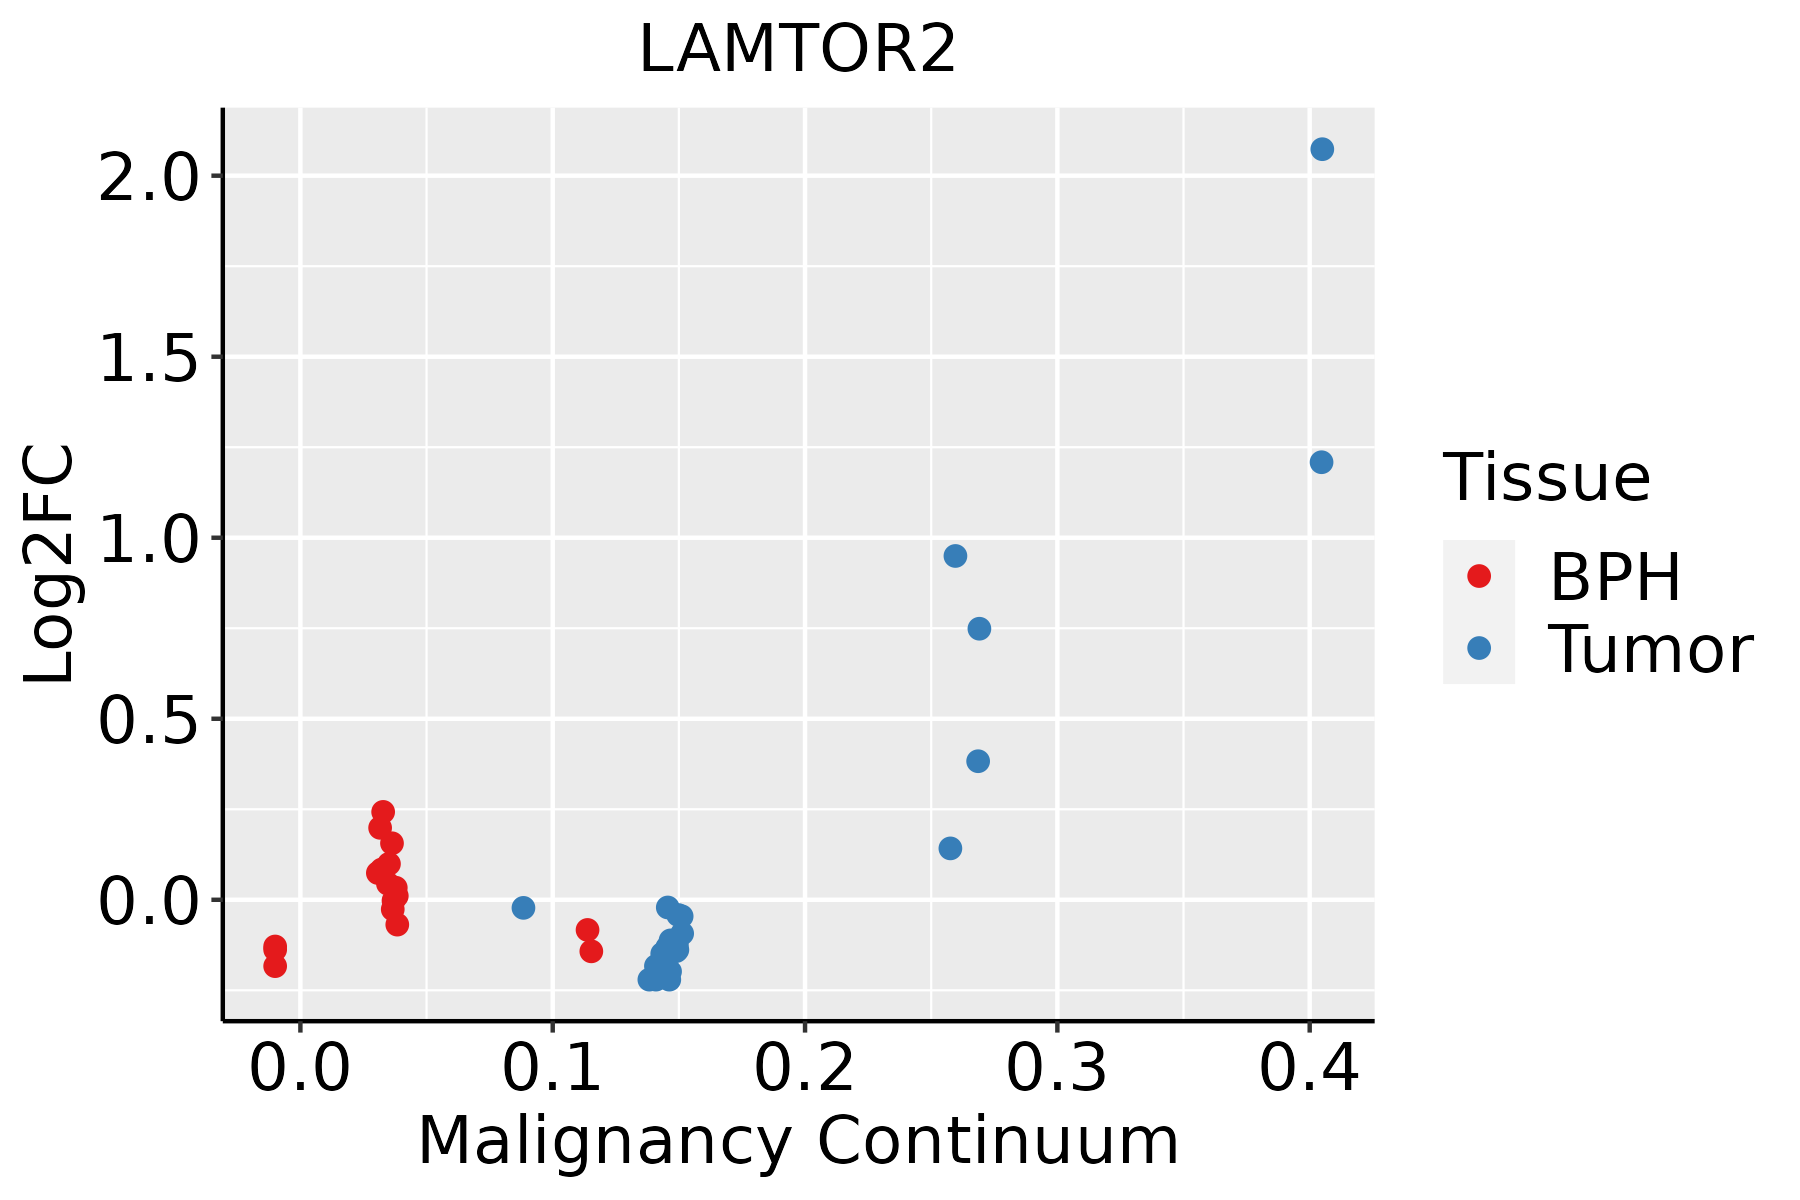 | BPH: Benign Prostatic Hyperplasia |
| Skin |  | AK: Actinic keratosis |
| cSCC: Cutaneous squamous cell carcinoma | ||
| SCCIS:squamous cell carcinoma in situ | ||
| Thyroid | 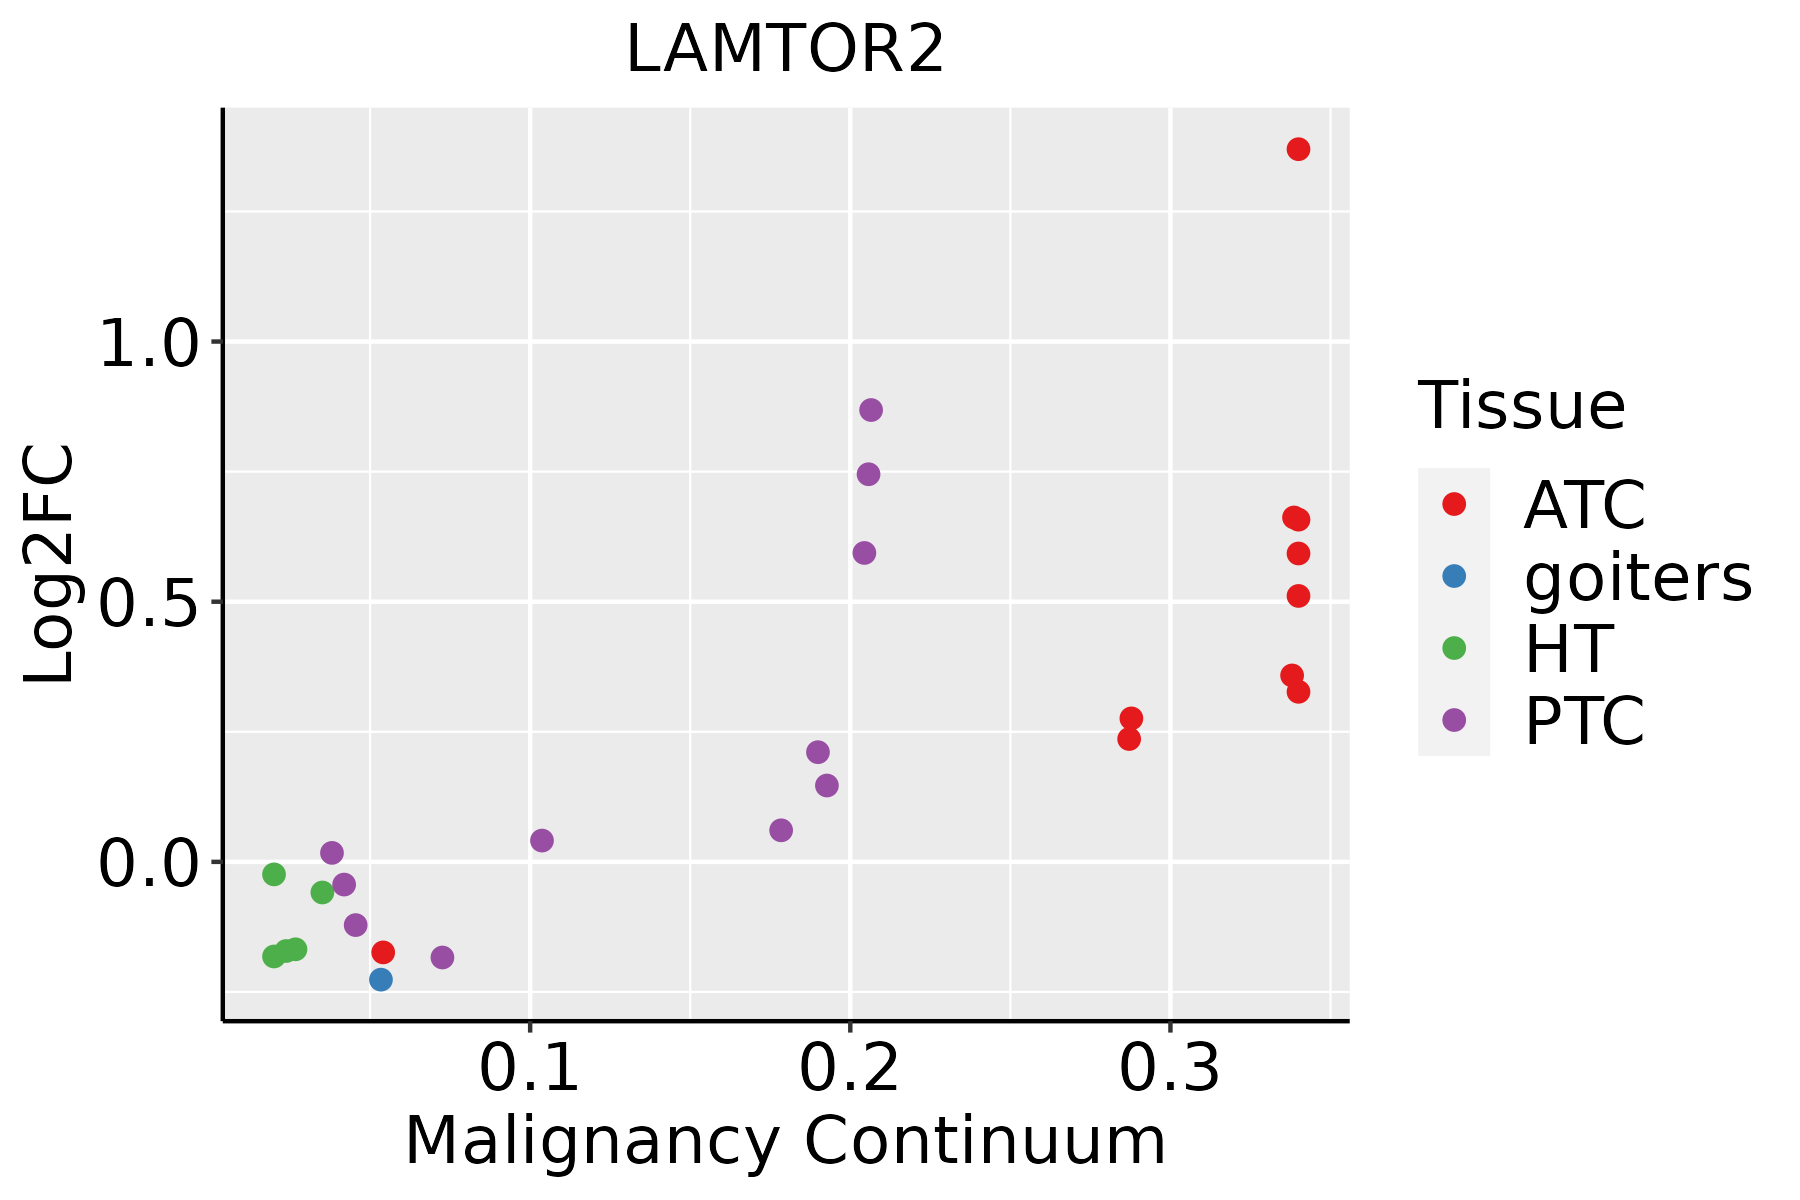 | ATC: Anaplastic thyroid cancer |
| HT: Hashimoto's thyroiditis | ||
| PTC: Papillary thyroid cancer |
| ∗log2FC in expression of this searched gene in stem-like cells from each diseased tissue sample relative to stem-like cells in normal samples in each tissue plotted against the malignancy continuum. Samples are colored based on if they are from different disease stage. |
Top |
Malignant transformation related pathway analysis |
| Find out the enriched GO biological processes and KEGG pathways involved in transition from healthy to precancer to cancer |
| Tissue | Disease Stage | Enriched GO biological Processes |
| Colorectum | AD |  |
| Colorectum | SER |  |
| Colorectum | MSS |  |
| Colorectum | MSI-H |  |
| Colorectum | FAP |  |
| ∗Top 15 enriched GO BP terms are showed in the bar plot of each disease state in each tissue. Each row represents a significant GO biological process which is colored according to the -log10(p.adjust). |
| Page: 1 2 3 4 5 6 7 8 9 |
| GO ID | Tissue | Disease Stage | Description | Gene Ratio | Bg Ratio | pvalue | p.adjust | Count |
| GO:00016678 | Breast | Precancer | ameboidal-type cell migration | 47/1080 | 475/18723 | 2.19e-04 | 3.35e-03 | 47 |
| GO:00160497 | Breast | Precancer | cell growth | 46/1080 | 482/18723 | 5.63e-04 | 7.16e-03 | 46 |
| GO:00015587 | Breast | Precancer | regulation of cell growth | 39/1080 | 414/18723 | 1.81e-03 | 1.78e-02 | 39 |
| GO:00011015 | Breast | Precancer | response to acid chemical | 16/1080 | 135/18723 | 4.85e-03 | 3.67e-02 | 16 |
| GO:01501158 | Breast | Precancer | cell-substrate junction organization | 13/1080 | 101/18723 | 5.30e-03 | 3.94e-02 | 13 |
| GO:01501168 | Breast | Precancer | regulation of cell-substrate junction organization | 10/1080 | 71/18723 | 7.33e-03 | 4.88e-02 | 10 |
| GO:000166714 | Breast | IDC | ameboidal-type cell migration | 64/1434 | 475/18723 | 6.65e-06 | 2.05e-04 | 64 |
| GO:001604913 | Breast | IDC | cell growth | 56/1434 | 482/18723 | 1.16e-03 | 1.26e-02 | 56 |
| GO:000155813 | Breast | IDC | regulation of cell growth | 49/1434 | 414/18723 | 1.55e-03 | 1.55e-02 | 49 |
| GO:000110112 | Breast | IDC | response to acid chemical | 20/1434 | 135/18723 | 3.28e-03 | 2.75e-02 | 20 |
| GO:00432003 | Breast | IDC | response to amino acid | 17/1434 | 116/18723 | 7.13e-03 | 4.92e-02 | 17 |
| GO:000166723 | Breast | DCIS | ameboidal-type cell migration | 62/1390 | 475/18723 | 9.60e-06 | 2.56e-04 | 62 |
| GO:001604923 | Breast | DCIS | cell growth | 54/1390 | 482/18723 | 1.60e-03 | 1.59e-02 | 54 |
| GO:000155822 | Breast | DCIS | regulation of cell growth | 47/1390 | 414/18723 | 2.39e-03 | 2.16e-02 | 47 |
| GO:000110121 | Breast | DCIS | response to acid chemical | 19/1390 | 135/18723 | 5.17e-03 | 3.81e-02 | 19 |
| GO:00016679 | Cervix | CC | ameboidal-type cell migration | 110/2311 | 475/18723 | 2.66e-11 | 6.36e-09 | 110 |
| GO:01501159 | Cervix | CC | cell-substrate junction organization | 37/2311 | 101/18723 | 3.20e-10 | 4.46e-08 | 37 |
| GO:01501169 | Cervix | CC | regulation of cell-substrate junction organization | 25/2311 | 71/18723 | 5.58e-07 | 2.06e-05 | 25 |
| GO:00160498 | Cervix | CC | cell growth | 92/2311 | 482/18723 | 1.16e-05 | 2.49e-04 | 92 |
| GO:00434104 | Cervix | CC | positive regulation of MAPK cascade | 90/2311 | 480/18723 | 2.92e-05 | 4.83e-04 | 90 |
| Page: 1 2 3 4 5 6 7 8 9 |
| Pathway ID | Tissue | Disease Stage | Description | Gene Ratio | Bg Ratio | pvalue | p.adjust | qvalue | Count |
| hsa04150 | Colorectum | MSS | mTOR signaling pathway | 47/1875 | 156/8465 | 1.19e-02 | 3.99e-02 | 2.44e-02 | 47 |
| hsa041501 | Colorectum | MSS | mTOR signaling pathway | 47/1875 | 156/8465 | 1.19e-02 | 3.99e-02 | 2.44e-02 | 47 |
| hsa041505 | Esophagus | ESCC | mTOR signaling pathway | 98/4205 | 156/8465 | 5.81e-04 | 1.95e-03 | 9.97e-04 | 98 |
| hsa0415013 | Esophagus | ESCC | mTOR signaling pathway | 98/4205 | 156/8465 | 5.81e-04 | 1.95e-03 | 9.97e-04 | 98 |
| hsa041502 | Liver | HCC | mTOR signaling pathway | 95/4020 | 156/8465 | 4.70e-04 | 1.99e-03 | 1.11e-03 | 95 |
| hsa0415011 | Liver | HCC | mTOR signaling pathway | 95/4020 | 156/8465 | 4.70e-04 | 1.99e-03 | 1.11e-03 | 95 |
| hsa041504 | Oral cavity | OSCC | mTOR signaling pathway | 90/3704 | 156/8465 | 2.87e-04 | 9.15e-04 | 4.66e-04 | 90 |
| hsa0415012 | Oral cavity | OSCC | mTOR signaling pathway | 90/3704 | 156/8465 | 2.87e-04 | 9.15e-04 | 4.66e-04 | 90 |
| Page: 1 |
Top |
Cell-cell communication analysis |
| Identification of potential cell-cell interactions between two cell types and their ligand-receptor pairs for different disease states |
| Ligand | Receptor | LRpair | Pathway | Tissue | Disease Stage |
| Page: 1 |
Top |
Single-cell gene regulatory network inference analysis |
| Find out the significant the regulons (TFs) and the target genes of each regulon across cell types for different disease states |
| TF | Cell Type | Tissue | Disease Stage | Target Gene | RSS | Regulon Activity |
| ∗The dot plots of a searched regulon are shown for all cell subpopulations in each disease state of each tissue based on the regulon specific score inferred using pySCENIC and by calculating the average expression. |
| Page: 1 |
Top |
Somatic mutation of malignant transformation related genes |
| Annotation of somatic variants for genes involved in malignant transformation |
| Hugo Symbol | Variant Class | Variant Classification | dbSNP RS | HGVSc | HGVSp | HGVSp Short | SWISSPROT | BIOTYPE | SIFT | PolyPhen | Tumor Sample Barcode | Tissue | Histology | Sex | Age | Stage | Therapy Types | Drugs | Outcome |
| LAMTOR2 | SNV | Missense_Mutation | c.46N>G | p.Thr16Ala | p.T16A | Q9Y2Q5 | protein_coding | deleterious(0) | possibly_damaging(0.449) | TCGA-BH-A0B5-01 | Breast | breast invasive carcinoma | Female | <65 | III/IV | Chemotherapy | adriamycin | CR | |
| LAMTOR2 | insertion | Nonsense_Mutation | novel | c.297_298insAATAACATCACTCATTTGGACAACTGTTGGCAGATATGAAATTTCAT | p.Gly100AsnfsTer13 | p.G100Nfs*13 | Q9Y2Q5 | protein_coding | TCGA-A2-A0CM-01 | Breast | breast invasive carcinoma | Female | <65 | I/II | Chemotherapy | adriamycin | PD | ||
| LAMTOR2 | SNV | Missense_Mutation | c.177C>G | p.Asn59Lys | p.N59K | Q9Y2Q5 | protein_coding | deleterious(0.03) | possibly_damaging(0.51) | TCGA-CM-4747-01 | Colorectum | colon adenocarcinoma | Male | <65 | I/II | Chemotherapy | fluorouracil | SD | |
| LAMTOR2 | SNV | Missense_Mutation | c.97G>T | p.Ala33Ser | p.A33S | Q9Y2Q5 | protein_coding | deleterious(0.03) | benign(0.39) | TCGA-AG-A002-01 | Colorectum | rectum adenocarcinoma | Male | <65 | I/II | Unknown | Unknown | SD | |
| LAMTOR2 | SNV | Missense_Mutation | novel | c.215T>C | p.Ile72Thr | p.I72T | Q9Y2Q5 | protein_coding | deleterious(0.01) | possibly_damaging(0.873) | TCGA-AG-A014-01 | Colorectum | rectum adenocarcinoma | Male | >=65 | I/II | Unknown | Unknown | SD |
| LAMTOR2 | SNV | Missense_Mutation | novel | c.178G>T | p.Gly60Trp | p.G60W | Q9Y2Q5 | protein_coding | deleterious(0) | probably_damaging(0.998) | TCGA-05-4396-01 | Lung | lung adenocarcinoma | Male | >=65 | III/IV | Unknown | Unknown | SD |
| LAMTOR2 | SNV | Missense_Mutation | c.298G>T | p.Gly100Cys | p.G100C | Q9Y2Q5 | protein_coding | tolerated(0.06) | benign(0.088) | TCGA-86-8358-01 | Lung | lung adenocarcinoma | Male | <65 | I/II | Unknown | Unknown | SD | |
| LAMTOR2 | SNV | Missense_Mutation | c.284C>A | p.Ala95Asp | p.A95D | Q9Y2Q5 | protein_coding | deleterious(0) | probably_damaging(0.997) | TCGA-33-4583-01 | Lung | lung squamous cell carcinoma | Male | >=65 | I/II | Unknown | Unknown | SD | |
| LAMTOR2 | SNV | Missense_Mutation | c.152A>C | p.Asn51Thr | p.N51T | Q9Y2Q5 | protein_coding | deleterious(0) | possibly_damaging(0.749) | TCGA-66-2785-01 | Lung | lung squamous cell carcinoma | Male | >=65 | I/II | Unknown | Unknown | SD | |
| LAMTOR2 | insertion | Frame_Shift_Ins | novel | c.308_309insA | p.Met103IlefsTer37 | p.M103Ifs*37 | Q9Y2Q5 | protein_coding | TCGA-66-2763-01 | Lung | lung squamous cell carcinoma | Female | <65 | I/II | Unknown | Unknown | SD |
| Page: 1 |
Top |
Related drugs of malignant transformation related genes |
| Identification of chemicals and drugs interact with genes involved in malignant transfromation |
| (DGIdb 4.0) |
| Entrez ID | Symbol | Category | Interaction Types | Drug Claim Name | Drug Name | PMIDs |
| Page: 1 |

Copyright 2023-Present -The University of Texas Health Science Center at Houston |