
|
|||||
|
 | |
| |
| |
| |
| |
| |
|
Gene: LAMP3 |
Gene summary for LAMP3 |
| Gene information | Species | Human | Gene symbol | LAMP3 | Gene ID | 27074 |
| Gene name | lysosomal associated membrane protein 3 | |
| Gene Alias | CD208 | |
| Cytomap | 3q27.1 | |
| Gene Type | protein-coding | GO ID | GO:0002250 | UniProtAcc | Q9UQV4 |
Top |
Malignant transformation analysis |
| Identification of the aberrant gene expression in precancerous and cancerous lesions by comparing the gene expression of stem-like cells in diseased tissues with normal stem cells |
| Entrez ID | Symbol | Replicates | Species | Organ | Tissue | Adj P-value | Log2FC | Malignancy |
| 27074 | LAMP3 | LZE20T | Human | Esophagus | ESCC | 5.40e-04 | 1.97e-01 | 0.0662 |
| 27074 | LAMP3 | LZE24T | Human | Esophagus | ESCC | 6.37e-14 | 4.29e-01 | 0.0596 |
| 27074 | LAMP3 | LZE21T | Human | Esophagus | ESCC | 4.70e-04 | 3.44e-01 | 0.0655 |
| 27074 | LAMP3 | P1T-E | Human | Esophagus | ESCC | 3.89e-04 | 5.34e-01 | 0.0875 |
| 27074 | LAMP3 | P2T-E | Human | Esophagus | ESCC | 1.85e-56 | 1.29e+00 | 0.1177 |
| 27074 | LAMP3 | P4T-E | Human | Esophagus | ESCC | 2.71e-20 | 7.11e-01 | 0.1323 |
| 27074 | LAMP3 | P5T-E | Human | Esophagus | ESCC | 9.62e-08 | 2.22e-01 | 0.1327 |
| 27074 | LAMP3 | P8T-E | Human | Esophagus | ESCC | 1.95e-04 | 2.44e-01 | 0.0889 |
| 27074 | LAMP3 | P9T-E | Human | Esophagus | ESCC | 2.63e-16 | 5.76e-01 | 0.1131 |
| 27074 | LAMP3 | P11T-E | Human | Esophagus | ESCC | 3.53e-09 | 7.36e-01 | 0.1426 |
| 27074 | LAMP3 | P12T-E | Human | Esophagus | ESCC | 3.24e-71 | 1.74e+00 | 0.1122 |
| 27074 | LAMP3 | P15T-E | Human | Esophagus | ESCC | 2.28e-20 | 6.44e-01 | 0.1149 |
| 27074 | LAMP3 | P16T-E | Human | Esophagus | ESCC | 5.00e-03 | 9.91e-02 | 0.1153 |
| 27074 | LAMP3 | P17T-E | Human | Esophagus | ESCC | 1.24e-02 | 3.65e-01 | 0.1278 |
| 27074 | LAMP3 | P20T-E | Human | Esophagus | ESCC | 1.51e-05 | 2.75e-01 | 0.1124 |
| 27074 | LAMP3 | P21T-E | Human | Esophagus | ESCC | 1.11e-02 | 1.85e-01 | 0.1617 |
| 27074 | LAMP3 | P23T-E | Human | Esophagus | ESCC | 8.95e-28 | 9.70e-01 | 0.108 |
| 27074 | LAMP3 | P24T-E | Human | Esophagus | ESCC | 1.54e-21 | 6.49e-01 | 0.1287 |
| 27074 | LAMP3 | P26T-E | Human | Esophagus | ESCC | 1.94e-97 | 2.30e+00 | 0.1276 |
| 27074 | LAMP3 | P27T-E | Human | Esophagus | ESCC | 9.41e-19 | 4.71e-01 | 0.1055 |
| Page: 1 2 3 4 |
| Tissue | Expression Dynamics | Abbreviation |
| Esophagus |  | ESCC: Esophageal squamous cell carcinoma |
| HGIN: High-grade intraepithelial neoplasias | ||
| LGIN: Low-grade intraepithelial neoplasias | ||
| Lung | 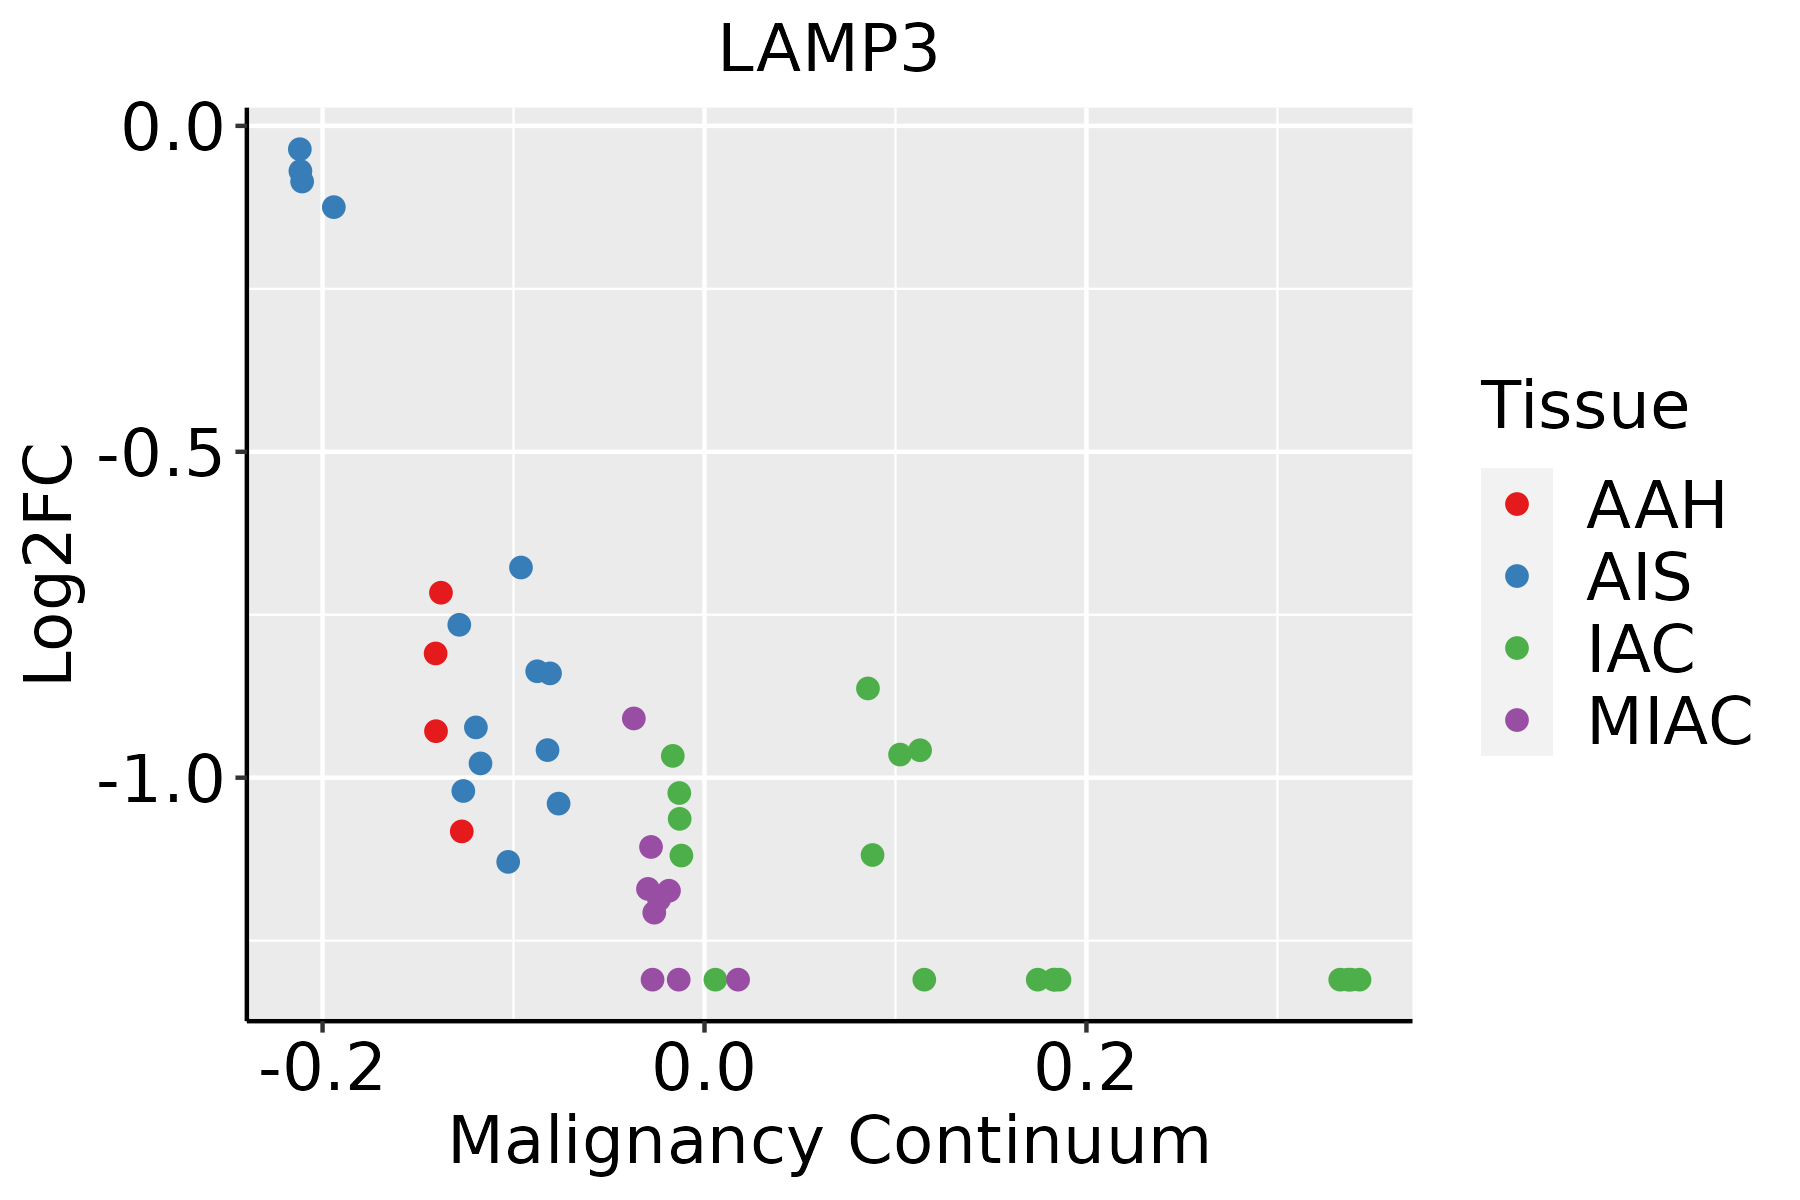 | AAH: Atypical adenomatous hyperplasia |
| AIS: Adenocarcinoma in situ | ||
| IAC: Invasive lung adenocarcinoma | ||
| MIA: Minimally invasive adenocarcinoma | ||
| Oral Cavity |  | EOLP: Erosive Oral lichen planus |
| LP: leukoplakia | ||
| NEOLP: Non-erosive oral lichen planus | ||
| OSCC: Oral squamous cell carcinoma |
| ∗log2FC in expression of this searched gene in stem-like cells from each diseased tissue sample relative to stem-like cells in normal samples in each tissue plotted against the malignancy continuum. Samples are colored based on if they are from different disease stage. |
Top |
Malignant transformation related pathway analysis |
| Find out the enriched GO biological processes and KEGG pathways involved in transition from healthy to precancer to cancer |
| Tissue | Disease Stage | Enriched GO biological Processes |
| Colorectum | AD |  |
| Colorectum | SER |  |
| Colorectum | MSS |  |
| Colorectum | MSI-H |  |
| Colorectum | FAP |  |
| ∗Top 15 enriched GO BP terms are showed in the bar plot of each disease state in each tissue. Each row represents a significant GO biological process which is colored according to the -log10(p.adjust). |
| Page: 1 2 3 4 5 6 7 8 9 |
| GO ID | Tissue | Disease Stage | Description | Gene Ratio | Bg Ratio | pvalue | p.adjust | Count |
| GO:0010498111 | Esophagus | ESCC | proteasomal protein catabolic process | 369/8552 | 490/18723 | 1.13e-41 | 1.80e-38 | 369 |
| GO:0072594110 | Esophagus | ESCC | establishment of protein localization to organelle | 311/8552 | 422/18723 | 3.02e-32 | 2.13e-29 | 311 |
| GO:0016032111 | Esophagus | ESCC | viral process | 301/8552 | 415/18723 | 3.34e-29 | 1.32e-26 | 301 |
| GO:0042176111 | Esophagus | ESCC | regulation of protein catabolic process | 280/8552 | 391/18723 | 8.65e-26 | 2.39e-23 | 280 |
| GO:0019058111 | Esophagus | ESCC | viral life cycle | 226/8552 | 317/18723 | 1.17e-20 | 1.76e-18 | 226 |
| GO:1903362111 | Esophagus | ESCC | regulation of cellular protein catabolic process | 188/8552 | 255/18723 | 5.12e-20 | 6.62e-18 | 188 |
| GO:001050617 | Esophagus | ESCC | regulation of autophagy | 220/8552 | 317/18723 | 6.72e-18 | 6.36e-16 | 220 |
| GO:1903050111 | Esophagus | ESCC | regulation of proteolysis involved in cellular protein catabolic process | 163/8552 | 221/18723 | 1.44e-17 | 1.27e-15 | 163 |
| GO:0061136111 | Esophagus | ESCC | regulation of proteasomal protein catabolic process | 142/8552 | 187/18723 | 2.40e-17 | 2.00e-15 | 142 |
| GO:0050792111 | Esophagus | ESCC | regulation of viral process | 119/8552 | 164/18723 | 2.19e-12 | 9.03e-11 | 119 |
| GO:2000116111 | Esophagus | ESCC | regulation of cysteine-type endopeptidase activity | 158/8552 | 235/18723 | 1.67e-11 | 5.90e-10 | 158 |
| GO:0043281111 | Esophagus | ESCC | regulation of cysteine-type endopeptidase activity involved in apoptotic process | 143/8552 | 209/18723 | 2.12e-11 | 7.31e-10 | 143 |
| GO:1903900111 | Esophagus | ESCC | regulation of viral life cycle | 106/8552 | 148/18723 | 1.26e-10 | 3.72e-09 | 106 |
| GO:0009895111 | Esophagus | ESCC | negative regulation of catabolic process | 201/8552 | 320/18723 | 3.88e-10 | 1.05e-08 | 201 |
| GO:0052547111 | Esophagus | ESCC | regulation of peptidase activity | 275/8552 | 461/18723 | 7.54e-10 | 1.88e-08 | 275 |
| GO:0031330111 | Esophagus | ESCC | negative regulation of cellular catabolic process | 166/8552 | 262/18723 | 5.17e-09 | 1.08e-07 | 166 |
| GO:0052548111 | Esophagus | ESCC | regulation of endopeptidase activity | 253/8552 | 432/18723 | 3.68e-08 | 6.78e-07 | 253 |
| GO:0042177111 | Esophagus | ESCC | negative regulation of protein catabolic process | 84/8552 | 121/18723 | 1.03e-07 | 1.69e-06 | 84 |
| GO:2000117110 | Esophagus | ESCC | negative regulation of cysteine-type endopeptidase activity | 63/8552 | 86/18723 | 1.84e-07 | 2.88e-06 | 63 |
| GO:0043154110 | Esophagus | ESCC | negative regulation of cysteine-type endopeptidase activity involved in apoptotic process | 58/8552 | 78/18723 | 2.38e-07 | 3.61e-06 | 58 |
| Page: 1 2 3 4 5 6 |
| Pathway ID | Tissue | Disease Stage | Description | Gene Ratio | Bg Ratio | pvalue | p.adjust | qvalue | Count |
| hsa0414222 | Esophagus | ESCC | Lysosome | 102/4205 | 132/8465 | 5.11e-11 | 7.13e-10 | 3.65e-10 | 102 |
| hsa0414232 | Esophagus | ESCC | Lysosome | 102/4205 | 132/8465 | 5.11e-11 | 7.13e-10 | 3.65e-10 | 102 |
| hsa041425 | Oral cavity | OSCC | Lysosome | 87/3704 | 132/8465 | 1.97e-07 | 1.35e-06 | 6.86e-07 | 87 |
| hsa0414212 | Oral cavity | OSCC | Lysosome | 87/3704 | 132/8465 | 1.97e-07 | 1.35e-06 | 6.86e-07 | 87 |
| Page: 1 |
Top |
Cell-cell communication analysis |
| Identification of potential cell-cell interactions between two cell types and their ligand-receptor pairs for different disease states |
| Ligand | Receptor | LRpair | Pathway | Tissue | Disease Stage |
| Page: 1 |
Top |
Single-cell gene regulatory network inference analysis |
| Find out the significant the regulons (TFs) and the target genes of each regulon across cell types for different disease states |
| TF | Cell Type | Tissue | Disease Stage | Target Gene | RSS | Regulon Activity |
| ∗The dot plots of a searched regulon are shown for all cell subpopulations in each disease state of each tissue based on the regulon specific score inferred using pySCENIC and by calculating the average expression. |
| Page: 1 |
Top |
Somatic mutation of malignant transformation related genes |
| Annotation of somatic variants for genes involved in malignant transformation |
| Hugo Symbol | Variant Class | Variant Classification | dbSNP RS | HGVSc | HGVSp | HGVSp Short | SWISSPROT | BIOTYPE | SIFT | PolyPhen | Tumor Sample Barcode | Tissue | Histology | Sex | Age | Stage | Therapy Types | Drugs | Outcome |
| LAMP3 | SNV | Missense_Mutation | novel | c.419N>A | p.Pro140Gln | p.P140Q | Q9UQV4 | protein_coding | deleterious(0.03) | benign(0.273) | TCGA-A7-A0DB-01 | Breast | breast invasive carcinoma | Female | <65 | I/II | Hormone Therapy | arimidex | SD |
| LAMP3 | SNV | Missense_Mutation | c.721N>C | p.Glu241Gln | p.E241Q | Q9UQV4 | protein_coding | tolerated(0.08) | probably_damaging(0.941) | TCGA-AC-A23H-01 | Breast | breast invasive carcinoma | Female | >=65 | I/II | Unknown | Unknown | PD | |
| LAMP3 | SNV | Missense_Mutation | rs570150710 | c.584N>T | p.Thr195Met | p.T195M | Q9UQV4 | protein_coding | deleterious(0.03) | benign(0.029) | TCGA-AO-A128-01 | Breast | breast invasive carcinoma | Female | <65 | I/II | Chemotherapy | doxorubicin | SD |
| LAMP3 | SNV | Missense_Mutation | c.1225N>G | p.Gln409Glu | p.Q409E | Q9UQV4 | protein_coding | tolerated(1) | benign(0) | TCGA-DR-A0ZM-01 | Cervix | cervical & endocervical cancer | Female | <65 | III/IV | Unspecific | Cisplatin | SD | |
| LAMP3 | SNV | Missense_Mutation | c.901T>C | p.Tyr301His | p.Y301H | Q9UQV4 | protein_coding | deleterious(0) | probably_damaging(0.993) | TCGA-A6-5660-01 | Colorectum | colon adenocarcinoma | Male | >=65 | III/IV | Ancillary | leucovorin | SD | |
| LAMP3 | SNV | Missense_Mutation | rs774368709 | c.544N>A | p.Gly182Ser | p.G182S | Q9UQV4 | protein_coding | tolerated(1) | benign(0.003) | TCGA-AA-3663-01 | Colorectum | colon adenocarcinoma | Male | <65 | I/II | Unknown | Unknown | SD |
| LAMP3 | SNV | Missense_Mutation | c.1069N>A | p.Asp357Asn | p.D357N | Q9UQV4 | protein_coding | tolerated(1) | benign(0) | TCGA-AA-A00N-01 | Colorectum | colon adenocarcinoma | Male | >=65 | I/II | Unknown | Unknown | PD | |
| LAMP3 | SNV | Missense_Mutation | c.398N>T | p.Ser133Leu | p.S133L | Q9UQV4 | protein_coding | deleterious(0.05) | benign(0.231) | TCGA-AD-6895-01 | Colorectum | colon adenocarcinoma | Male | >=65 | III/IV | Unknown | Unknown | SD | |
| LAMP3 | SNV | Missense_Mutation | novel | c.749N>G | p.Asp250Gly | p.D250G | Q9UQV4 | protein_coding | deleterious(0.01) | benign(0.412) | TCGA-A5-A0G1-01 | Endometrium | uterine corpus endometrioid carcinoma | Female | >=65 | I/II | Unknown | Unknown | SD |
| LAMP3 | SNV | Missense_Mutation | novel | c.723N>T | p.Glu241Asp | p.E241D | Q9UQV4 | protein_coding | tolerated(0.12) | benign(0.218) | TCGA-A5-A1OF-01 | Endometrium | uterine corpus endometrioid carcinoma | Female | <65 | I/II | Unknown | Unknown | SD |
| Page: 1 2 3 4 5 |
Top |
Related drugs of malignant transformation related genes |
| Identification of chemicals and drugs interact with genes involved in malignant transfromation |
| (DGIdb 4.0) |
| Entrez ID | Symbol | Category | Interaction Types | Drug Claim Name | Drug Name | PMIDs |
| Page: 1 |

Copyright 2023-Present -The University of Texas Health Science Center at Houston |