
|
|||||
|
 | |
| |
| |
| |
| |
| |
|
Gene: LAMC2 |
Gene summary for LAMC2 |
| Gene information | Species | Human | Gene symbol | LAMC2 | Gene ID | 3918 |
| Gene name | laminin subunit gamma 2 | |
| Gene Alias | B2T | |
| Cytomap | 1q25.3 | |
| Gene Type | protein-coding | GO ID | GO:0000902 | UniProtAcc | Q13753 |
Top |
Malignant transformation analysis |
| Identification of the aberrant gene expression in precancerous and cancerous lesions by comparing the gene expression of stem-like cells in diseased tissues with normal stem cells |
| Entrez ID | Symbol | Replicates | Species | Organ | Tissue | Adj P-value | Log2FC | Malignancy |
| 3918 | LAMC2 | CA_HPV_1 | Human | Cervix | CC | 8.11e-04 | -1.47e-01 | 0.0264 |
| 3918 | LAMC2 | CCI_3 | Human | Cervix | CC | 2.62e-05 | 7.63e-01 | 0.516 |
| 3918 | LAMC2 | Tumor | Human | Cervix | CC | 3.07e-06 | 2.87e-01 | 0.1241 |
| 3918 | LAMC2 | sample1 | Human | Cervix | CC | 1.73e-02 | 3.93e-01 | 0.0959 |
| 3918 | LAMC2 | sample3 | Human | Cervix | CC | 1.26e-19 | 5.10e-01 | 0.1387 |
| 3918 | LAMC2 | T3 | Human | Cervix | CC | 3.24e-15 | 4.70e-01 | 0.1389 |
| 3918 | LAMC2 | AEH-subject1 | Human | Endometrium | AEH | 9.34e-09 | 4.57e-01 | -0.3059 |
| 3918 | LAMC2 | AEH-subject2 | Human | Endometrium | AEH | 2.58e-05 | 3.31e-01 | -0.2525 |
| 3918 | LAMC2 | AEH-subject3 | Human | Endometrium | AEH | 1.04e-02 | 3.15e-01 | -0.2576 |
| 3918 | LAMC2 | AEH-subject4 | Human | Endometrium | AEH | 2.94e-05 | 3.66e-01 | -0.2657 |
| 3918 | LAMC2 | EEC-subject1 | Human | Endometrium | EEC | 2.32e-07 | 4.32e-01 | -0.2682 |
| 3918 | LAMC2 | EEC-subject2 | Human | Endometrium | EEC | 2.43e-06 | 4.55e-01 | -0.2607 |
| 3918 | LAMC2 | EEC-subject3 | Human | Endometrium | EEC | 2.25e-28 | 9.60e-01 | -0.2525 |
| 3918 | LAMC2 | GSM5276934 | Human | Endometrium | EEC | 1.59e-05 | 2.74e-01 | -0.0913 |
| 3918 | LAMC2 | GSM6177620_NYU_UCEC1_lib1_lib1 | Human | Endometrium | EEC | 4.10e-02 | 1.90e-01 | -0.1869 |
| 3918 | LAMC2 | GSM6177620_NYU_UCEC1_lib3_lib3 | Human | Endometrium | EEC | 5.43e-05 | 1.97e-01 | -0.1883 |
| 3918 | LAMC2 | GSM6177621_NYU_UCEC2_lib1_lib1 | Human | Endometrium | EEC | 3.13e-05 | 3.40e-01 | -0.1934 |
| 3918 | LAMC2 | GSM6177622_NYU_UCEC3_lib1_lib1 | Human | Endometrium | EEC | 2.60e-08 | 3.39e-02 | -0.1917 |
| 3918 | LAMC2 | GSM6177622_NYU_UCEC3_lib2_lib2 | Human | Endometrium | EEC | 2.87e-02 | 8.21e-02 | -0.1916 |
| 3918 | LAMC2 | LZE4T | Human | Esophagus | ESCC | 1.45e-03 | 7.50e-01 | 0.0811 |
| Page: 1 2 3 4 5 6 7 |
| Tissue | Expression Dynamics | Abbreviation |
| Cervix |  | CC: Cervix cancer |
| HSIL_HPV: HPV-infected high-grade squamous intraepithelial lesions | ||
| N_HPV: HPV-infected normal cervix | ||
| Endometrium |  | AEH: Atypical endometrial hyperplasia |
| EEC: Endometrioid Cancer | ||
| Esophagus | 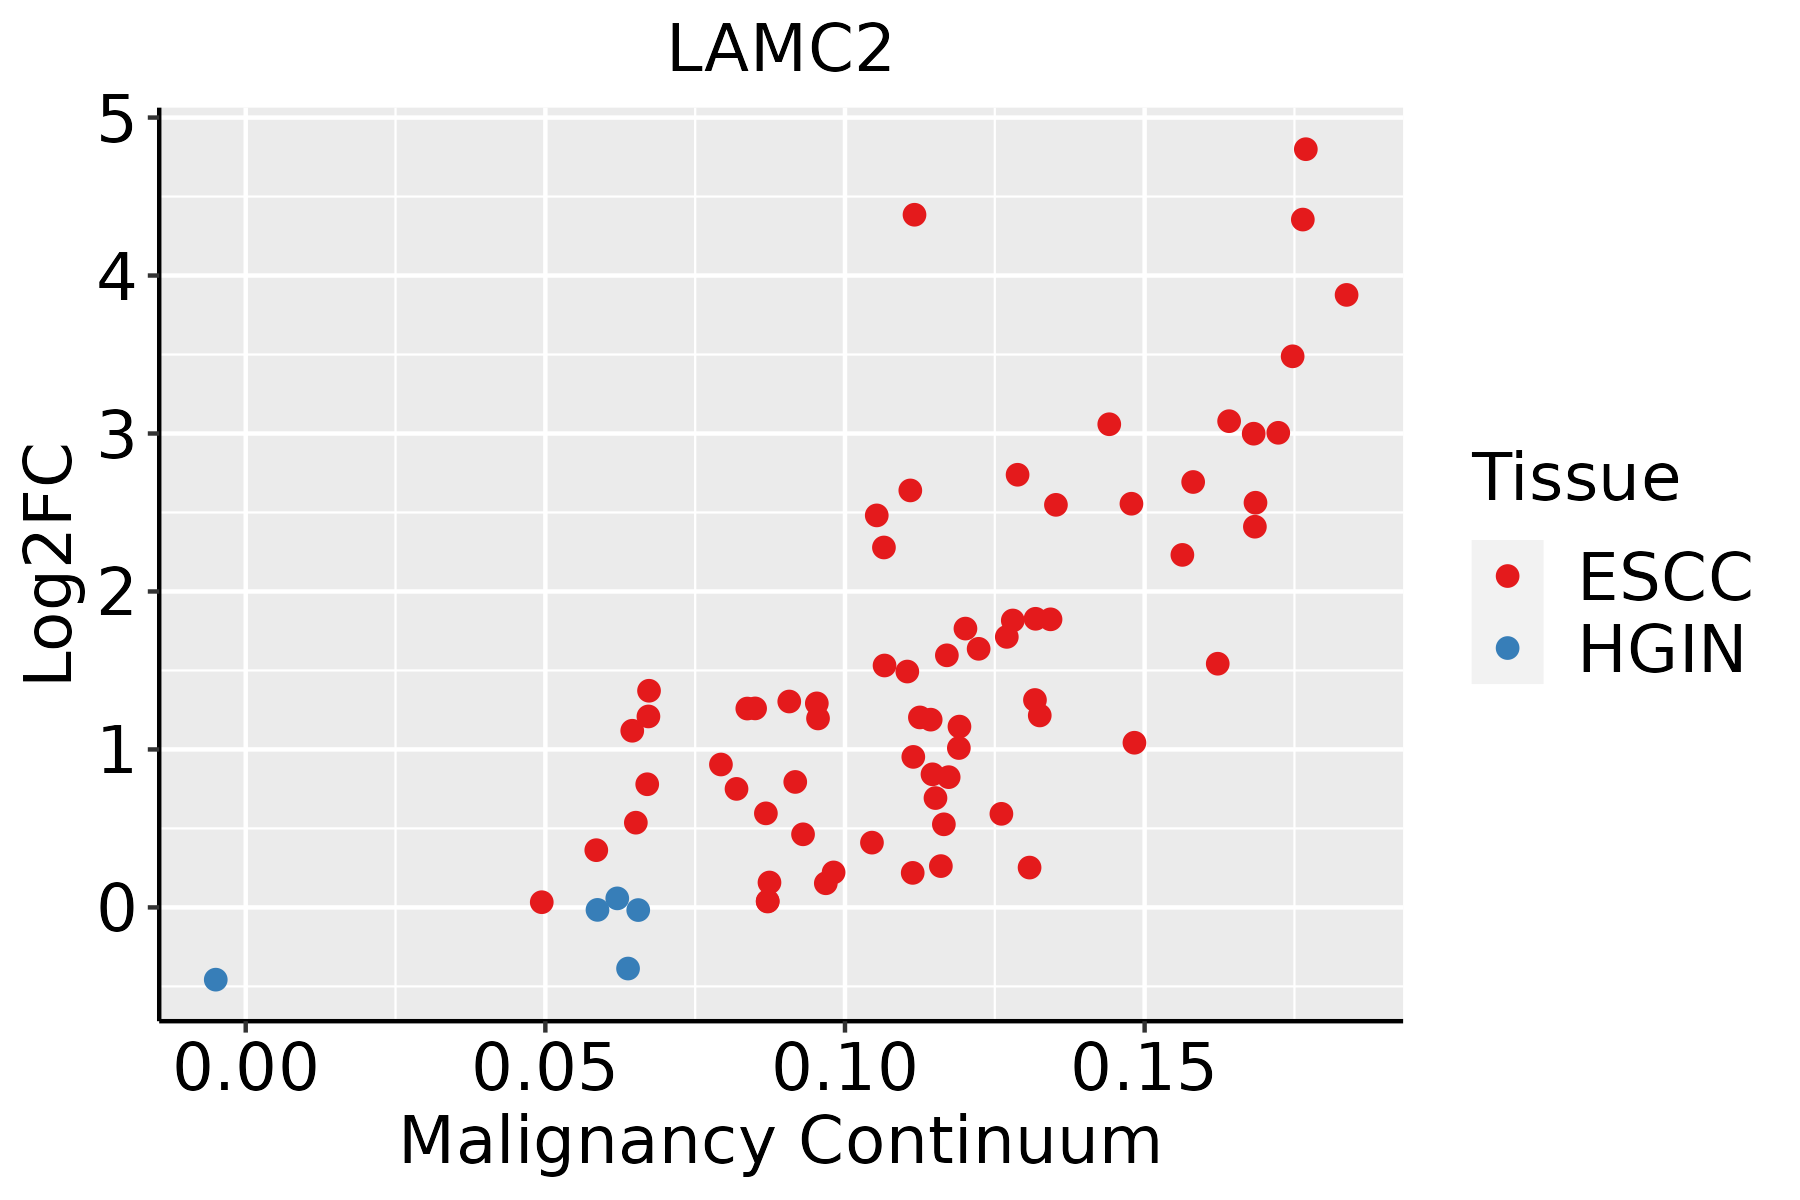 | ESCC: Esophageal squamous cell carcinoma |
| HGIN: High-grade intraepithelial neoplasias | ||
| LGIN: Low-grade intraepithelial neoplasias | ||
| Liver | 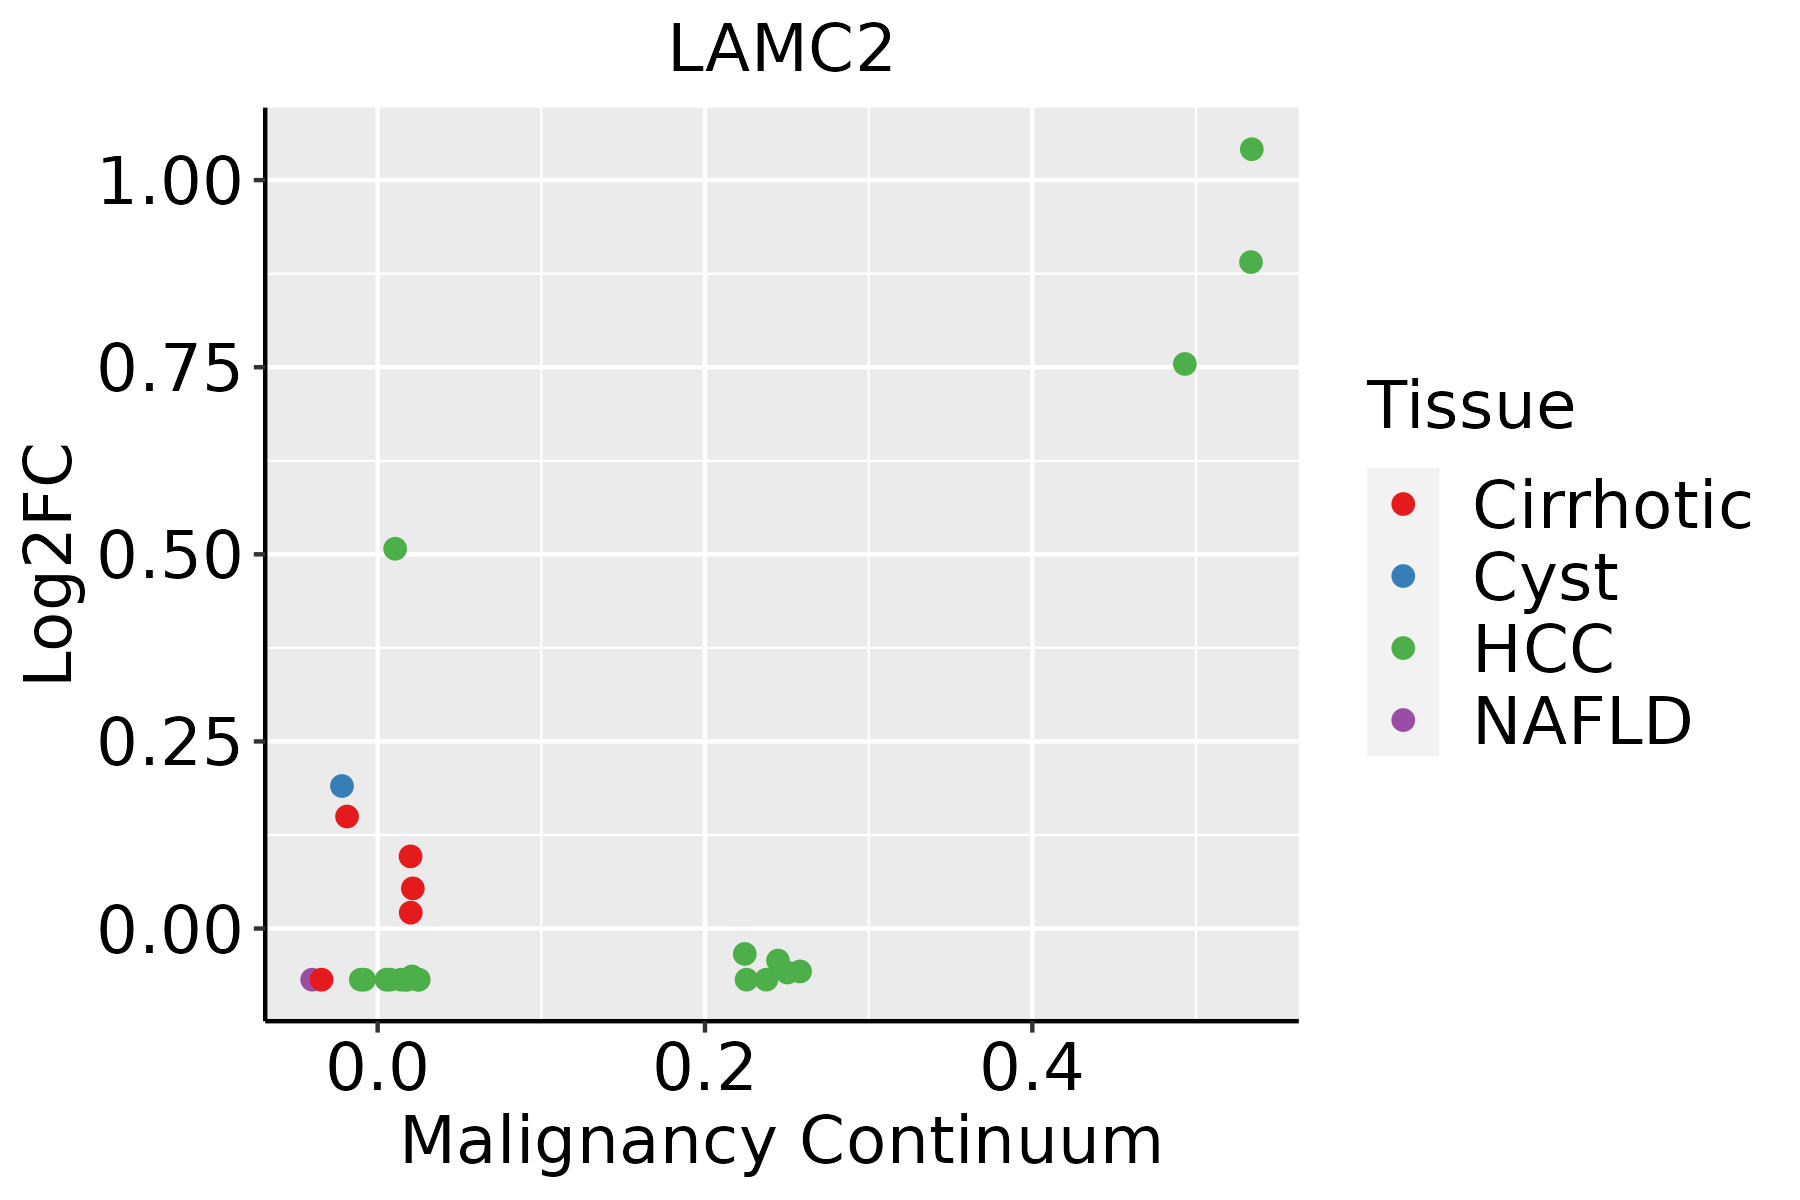 | HCC: Hepatocellular carcinoma |
| NAFLD: Non-alcoholic fatty liver disease | ||
| Oral Cavity |  | EOLP: Erosive Oral lichen planus |
| LP: leukoplakia | ||
| NEOLP: Non-erosive oral lichen planus | ||
| OSCC: Oral squamous cell carcinoma | ||
| Prostate | 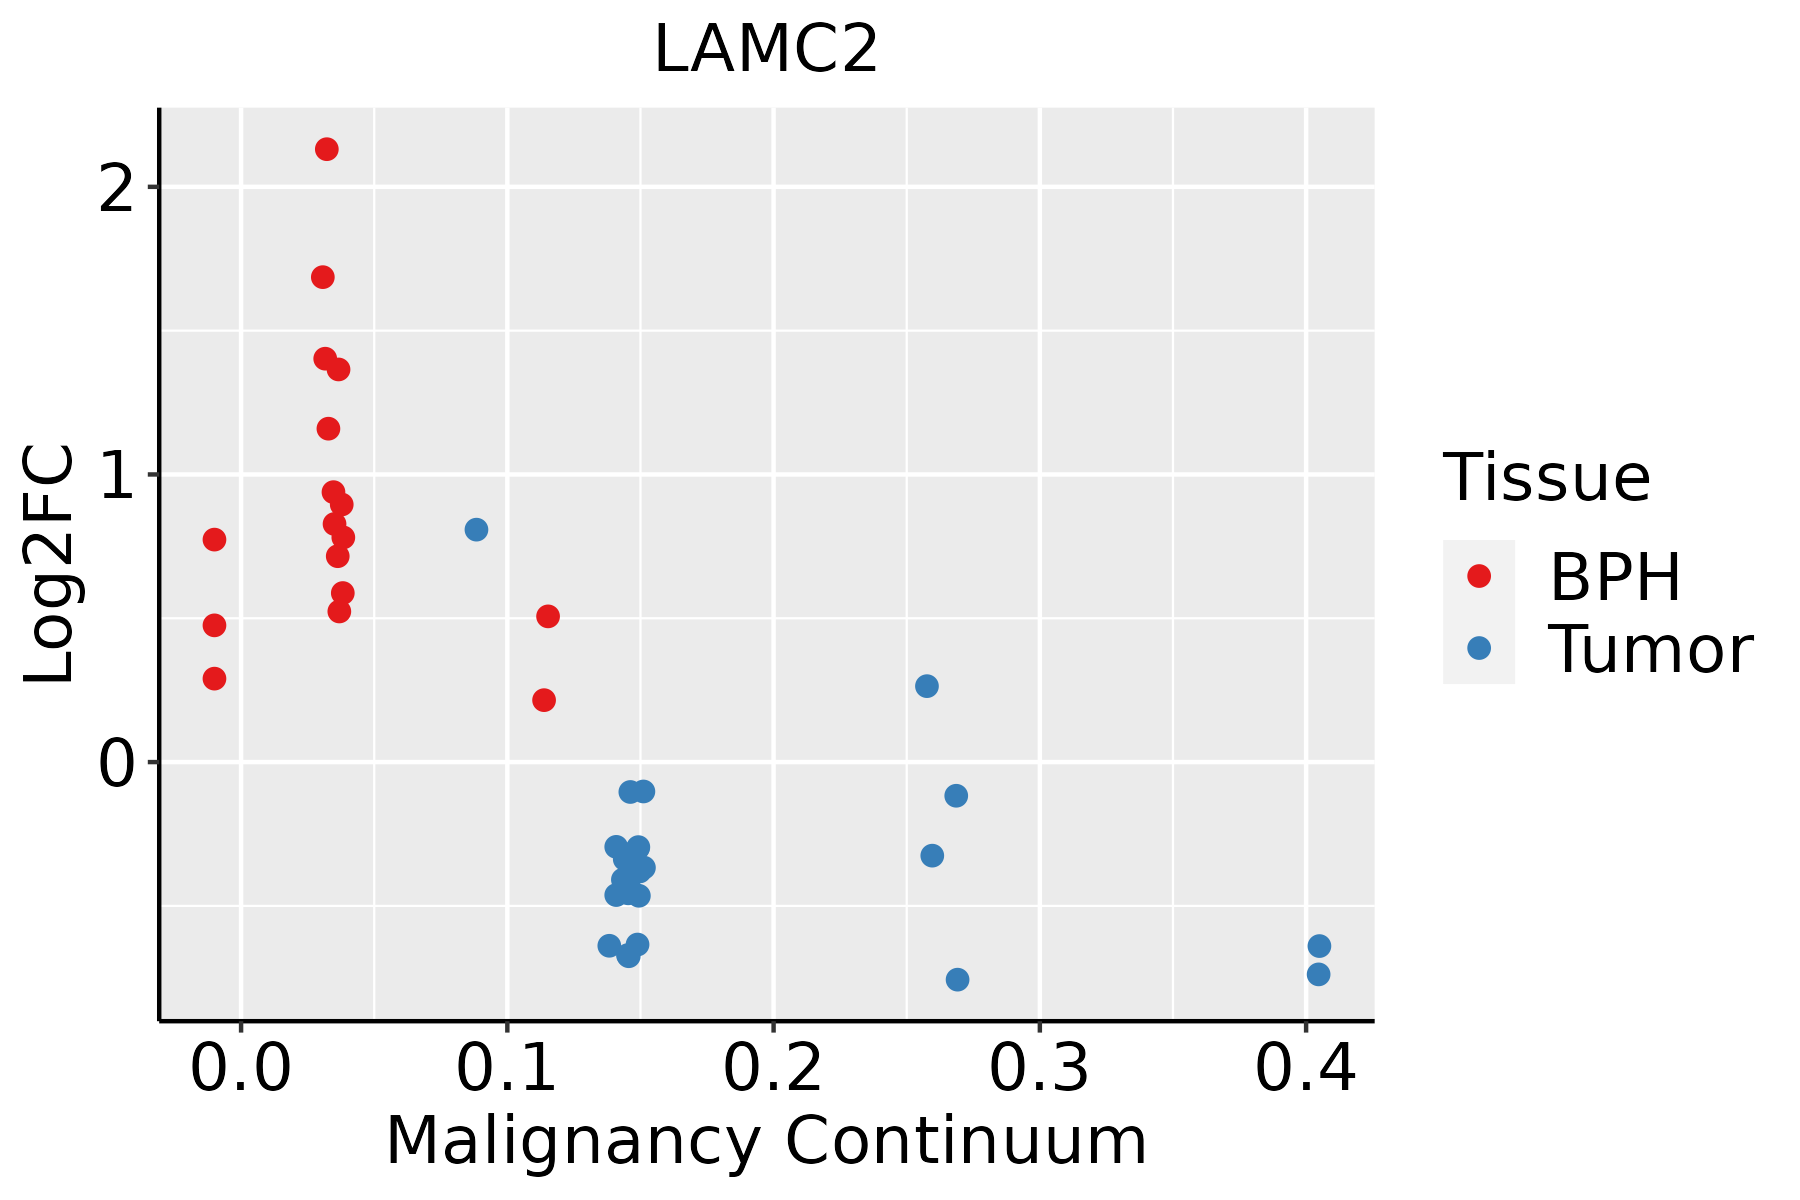 | BPH: Benign Prostatic Hyperplasia |
| Skin | 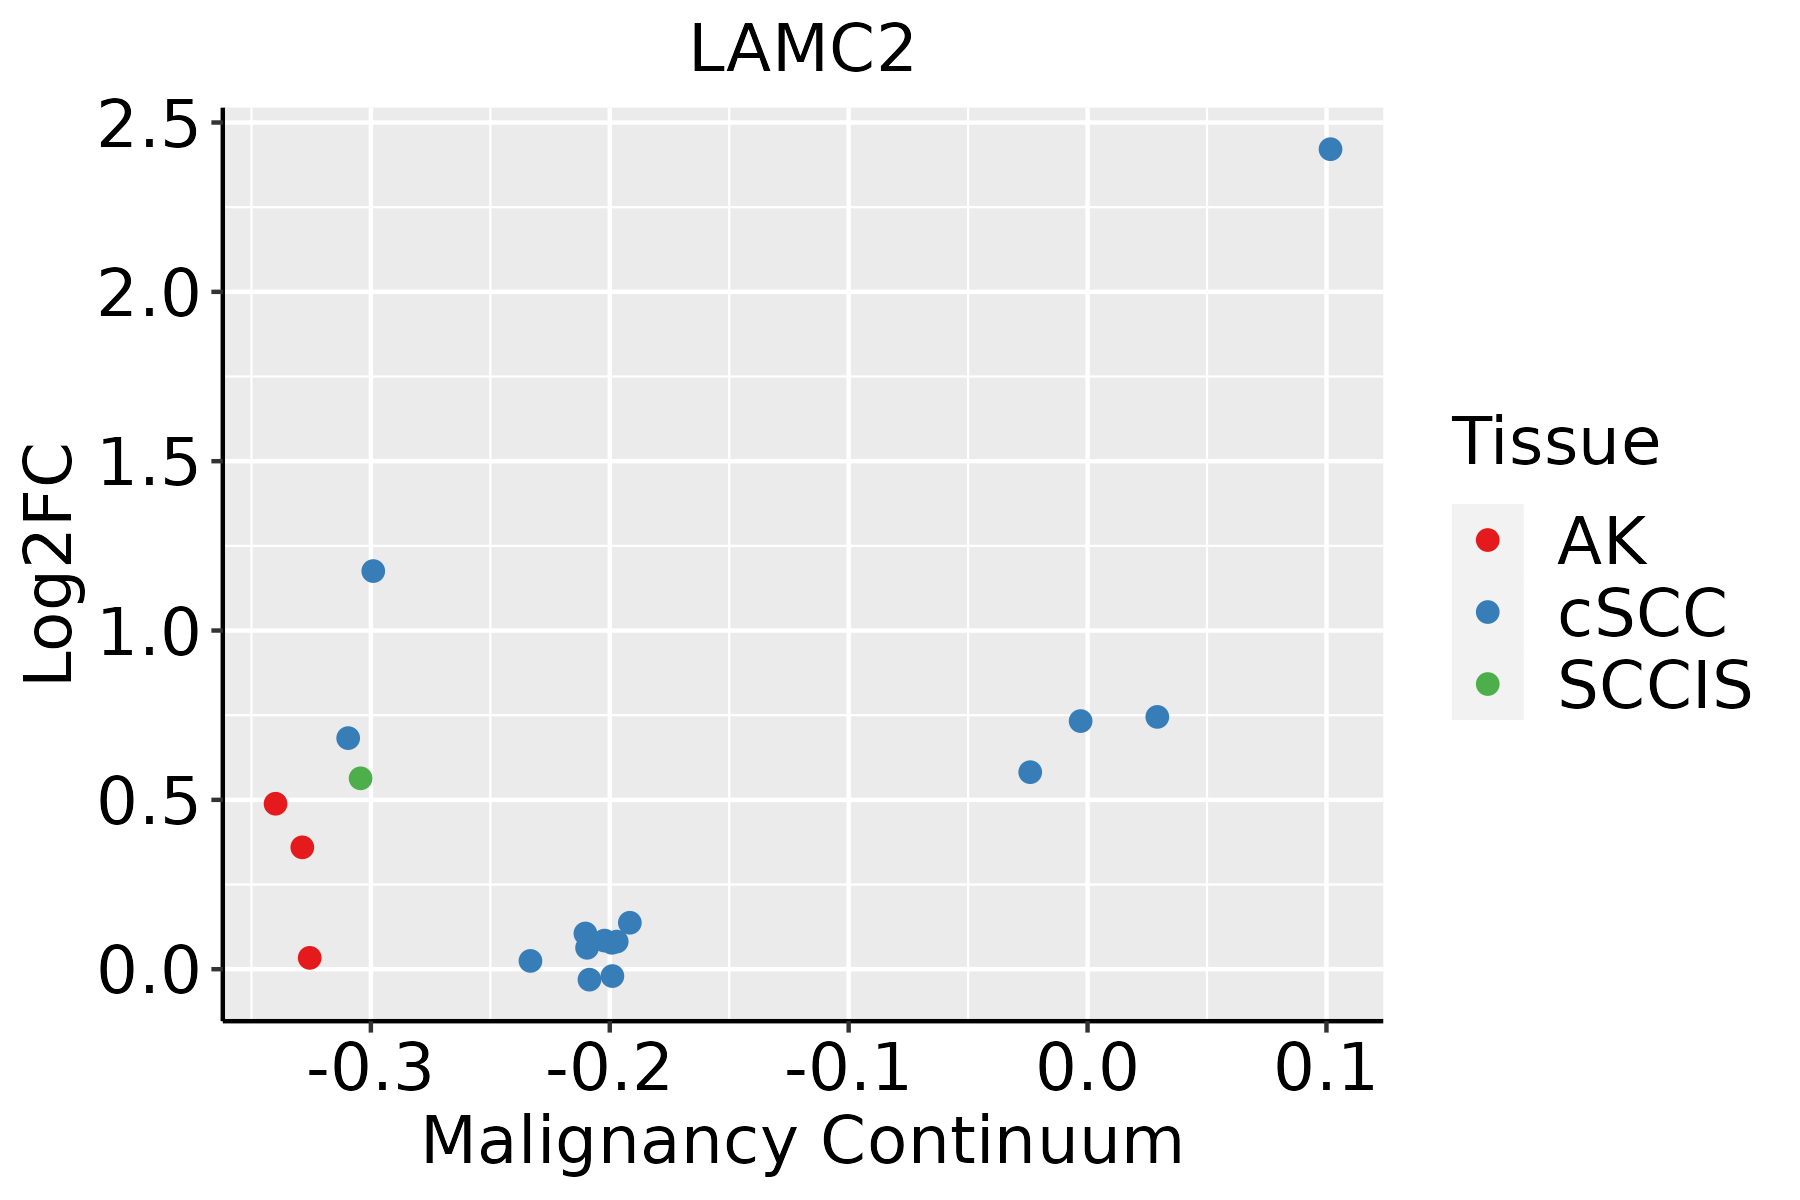 | AK: Actinic keratosis |
| cSCC: Cutaneous squamous cell carcinoma | ||
| SCCIS:squamous cell carcinoma in situ | ||
| Thyroid |  | ATC: Anaplastic thyroid cancer |
| HT: Hashimoto's thyroiditis | ||
| PTC: Papillary thyroid cancer |
| ∗log2FC in expression of this searched gene in stem-like cells from each diseased tissue sample relative to stem-like cells in normal samples in each tissue plotted against the malignancy continuum. Samples are colored based on if they are from different disease stage. |
Top |
Malignant transformation related pathway analysis |
| Find out the enriched GO biological processes and KEGG pathways involved in transition from healthy to precancer to cancer |
| Tissue | Disease Stage | Enriched GO biological Processes |
| Colorectum | AD |  |
| Colorectum | SER |  |
| Colorectum | MSS |  |
| Colorectum | MSI-H |  |
| Colorectum | FAP |  |
| ∗Top 15 enriched GO BP terms are showed in the bar plot of each disease state in each tissue. Each row represents a significant GO biological process which is colored according to the -log10(p.adjust). |
| Page: 1 2 3 4 5 6 7 8 9 |
| GO ID | Tissue | Disease Stage | Description | Gene Ratio | Bg Ratio | pvalue | p.adjust | Count |
| GO:00085446 | Cervix | CC | epidermis development | 83/2311 | 324/18723 | 3.91e-11 | 8.54e-09 | 83 |
| GO:00163587 | Cervix | CC | dendrite development | 58/2311 | 243/18723 | 4.52e-07 | 1.76e-05 | 58 |
| GO:00615647 | Cervix | CC | axon development | 89/2311 | 467/18723 | 1.71e-05 | 3.27e-04 | 89 |
| GO:00074097 | Cervix | CC | axonogenesis | 78/2311 | 418/18723 | 1.14e-04 | 1.43e-03 | 78 |
| GO:00074098 | Endometrium | AEH | axonogenesis | 81/2100 | 418/18723 | 5.54e-07 | 2.12e-05 | 81 |
| GO:00615648 | Endometrium | AEH | axon development | 88/2100 | 467/18723 | 6.39e-07 | 2.38e-05 | 88 |
| GO:00163588 | Endometrium | AEH | dendrite development | 46/2100 | 243/18723 | 2.56e-04 | 3.03e-03 | 46 |
| GO:00085447 | Endometrium | AEH | epidermis development | 52/2100 | 324/18723 | 5.00e-03 | 3.14e-02 | 52 |
| GO:006156412 | Endometrium | EEC | axon development | 93/2168 | 467/18723 | 9.60e-08 | 4.69e-06 | 93 |
| GO:000740912 | Endometrium | EEC | axonogenesis | 82/2168 | 418/18723 | 1.03e-06 | 3.49e-05 | 82 |
| GO:001635813 | Endometrium | EEC | dendrite development | 44/2168 | 243/18723 | 1.72e-03 | 1.34e-02 | 44 |
| GO:000854414 | Endometrium | EEC | epidermis development | 53/2168 | 324/18723 | 5.92e-03 | 3.54e-02 | 53 |
| GO:000854410 | Esophagus | ESCC | epidermis development | 193/8552 | 324/18723 | 2.87e-07 | 4.19e-06 | 193 |
| GO:006156415 | Esophagus | ESCC | axon development | 251/8552 | 467/18723 | 2.41e-04 | 1.49e-03 | 251 |
| GO:000740915 | Esophagus | ESCC | axonogenesis | 219/8552 | 418/18723 | 3.14e-03 | 1.31e-02 | 219 |
| GO:001635816 | Esophagus | ESCC | dendrite development | 130/8552 | 243/18723 | 8.33e-03 | 2.95e-02 | 130 |
| GO:001635811 | Liver | HCC | dendrite development | 121/7958 | 243/18723 | 1.26e-02 | 4.56e-02 | 121 |
| GO:00085449 | Oral cavity | OSCC | epidermis development | 171/7305 | 324/18723 | 2.89e-07 | 4.43e-06 | 171 |
| GO:001635810 | Oral cavity | OSCC | dendrite development | 113/7305 | 243/18723 | 1.00e-02 | 3.49e-02 | 113 |
| GO:006156410 | Oral cavity | OSCC | axon development | 207/7305 | 467/18723 | 1.01e-02 | 3.51e-02 | 207 |
| Page: 1 2 3 |
| Pathway ID | Tissue | Disease Stage | Description | Gene Ratio | Bg Ratio | pvalue | p.adjust | qvalue | Count |
| hsa0451010 | Cervix | CC | Focal adhesion | 59/1267 | 203/8465 | 1.53e-07 | 1.84e-06 | 1.09e-06 | 59 |
| hsa0514514 | Cervix | CC | Toxoplasmosis | 34/1267 | 112/8465 | 2.42e-05 | 1.82e-04 | 1.08e-04 | 34 |
| hsa052226 | Cervix | CC | Small cell lung cancer | 29/1267 | 92/8465 | 4.38e-05 | 3.09e-04 | 1.83e-04 | 29 |
| hsa051657 | Cervix | CC | Human papillomavirus infection | 74/1267 | 331/8465 | 1.70e-04 | 1.02e-03 | 6.03e-04 | 74 |
| hsa051465 | Cervix | CC | Amoebiasis | 29/1267 | 102/8465 | 3.31e-04 | 1.70e-03 | 1.01e-03 | 29 |
| hsa0451014 | Cervix | CC | Focal adhesion | 59/1267 | 203/8465 | 1.53e-07 | 1.84e-06 | 1.09e-06 | 59 |
| hsa0514515 | Cervix | CC | Toxoplasmosis | 34/1267 | 112/8465 | 2.42e-05 | 1.82e-04 | 1.08e-04 | 34 |
| hsa0522213 | Cervix | CC | Small cell lung cancer | 29/1267 | 92/8465 | 4.38e-05 | 3.09e-04 | 1.83e-04 | 29 |
| hsa0516512 | Cervix | CC | Human papillomavirus infection | 74/1267 | 331/8465 | 1.70e-04 | 1.02e-03 | 6.03e-04 | 74 |
| hsa0514612 | Cervix | CC | Amoebiasis | 29/1267 | 102/8465 | 3.31e-04 | 1.70e-03 | 1.01e-03 | 29 |
| hsa0451015 | Endometrium | AEH | Focal adhesion | 58/1197 | 203/8465 | 4.99e-08 | 7.37e-07 | 5.39e-07 | 58 |
| hsa051466 | Endometrium | AEH | Amoebiasis | 29/1197 | 102/8465 | 1.22e-04 | 1.10e-03 | 8.06e-04 | 29 |
| hsa0451016 | Endometrium | AEH | Focal adhesion | 58/1197 | 203/8465 | 4.99e-08 | 7.37e-07 | 5.39e-07 | 58 |
| hsa0514613 | Endometrium | AEH | Amoebiasis | 29/1197 | 102/8465 | 1.22e-04 | 1.10e-03 | 8.06e-04 | 29 |
| hsa0451024 | Endometrium | EEC | Focal adhesion | 58/1237 | 203/8465 | 1.61e-07 | 2.30e-06 | 1.71e-06 | 58 |
| hsa0514622 | Endometrium | EEC | Amoebiasis | 28/1237 | 102/8465 | 5.23e-04 | 3.83e-03 | 2.85e-03 | 28 |
| hsa0514516 | Endometrium | EEC | Toxoplasmosis | 28/1237 | 112/8465 | 2.48e-03 | 1.48e-02 | 1.11e-02 | 28 |
| hsa0451034 | Endometrium | EEC | Focal adhesion | 58/1237 | 203/8465 | 1.61e-07 | 2.30e-06 | 1.71e-06 | 58 |
| hsa0514632 | Endometrium | EEC | Amoebiasis | 28/1237 | 102/8465 | 5.23e-04 | 3.83e-03 | 2.85e-03 | 28 |
| hsa0514517 | Endometrium | EEC | Toxoplasmosis | 28/1237 | 112/8465 | 2.48e-03 | 1.48e-02 | 1.11e-02 | 28 |
| Page: 1 2 3 4 5 |
Top |
Cell-cell communication analysis |
| Identification of potential cell-cell interactions between two cell types and their ligand-receptor pairs for different disease states |
| Ligand | Receptor | LRpair | Pathway | Tissue | Disease Stage |
| LAMC2 | ITGA1_ITGB1 | LAMC2_ITGA1_ITGB1 | LAMININ | Breast | ADJ |
| LAMC2 | ITGA2_ITGB1 | LAMC2_ITGA2_ITGB1 | LAMININ | Breast | ADJ |
| LAMC2 | CD44 | LAMC2_CD44 | LAMININ | Breast | ADJ |
| LAMC2 | ITGA1_ITGB1 | LAMC2_ITGA1_ITGB1 | LAMININ | Breast | Healthy |
| LAMC2 | ITGA2_ITGB1 | LAMC2_ITGA2_ITGB1 | LAMININ | Breast | Healthy |
| LAMC2 | ITGA6_ITGB1 | LAMC2_ITGA6_ITGB1 | LAMININ | Breast | Healthy |
| LAMC2 | ITGA7_ITGB1 | LAMC2_ITGA7_ITGB1 | LAMININ | Breast | Healthy |
| LAMC2 | ITGAV_ITGB8 | LAMC2_ITGAV_ITGB8 | LAMININ | Breast | Healthy |
| LAMC2 | CD44 | LAMC2_CD44 | LAMININ | Breast | Healthy |
| LAMC2 | ITGA1_ITGB1 | LAMC2_ITGA1_ITGB1 | LAMININ | Breast | Precancer |
| LAMC2 | ITGA2_ITGB1 | LAMC2_ITGA2_ITGB1 | LAMININ | Breast | Precancer |
| LAMC2 | CD44 | LAMC2_CD44 | LAMININ | Breast | Precancer |
| LAMC2 | ITGA1_ITGB1 | LAMC2_ITGA1_ITGB1 | LAMININ | Cervix | ADJ |
| LAMC2 | ITGA2_ITGB1 | LAMC2_ITGA2_ITGB1 | LAMININ | Cervix | ADJ |
| LAMC2 | ITGA3_ITGB1 | LAMC2_ITGA3_ITGB1 | LAMININ | Cervix | ADJ |
| LAMC2 | ITGA6_ITGB1 | LAMC2_ITGA6_ITGB1 | LAMININ | Cervix | ADJ |
| LAMC2 | ITGA7_ITGB1 | LAMC2_ITGA7_ITGB1 | LAMININ | Cervix | ADJ |
| LAMC2 | ITGAV_ITGB8 | LAMC2_ITGAV_ITGB8 | LAMININ | Cervix | ADJ |
| LAMC2 | ITGA6_ITGB4 | LAMC2_ITGA6_ITGB4 | LAMININ | Cervix | ADJ |
| LAMC2 | CD44 | LAMC2_CD44 | LAMININ | Cervix | ADJ |
| Page: 1 2 3 4 5 6 7 8 9 10 11 |
Top |
Single-cell gene regulatory network inference analysis |
| Find out the significant the regulons (TFs) and the target genes of each regulon across cell types for different disease states |
| TF | Cell Type | Tissue | Disease Stage | Target Gene | RSS | Regulon Activity |
| ∗The dot plots of a searched regulon are shown for all cell subpopulations in each disease state of each tissue based on the regulon specific score inferred using pySCENIC and by calculating the average expression. |
| Page: 1 |
Top |
Somatic mutation of malignant transformation related genes |
| Annotation of somatic variants for genes involved in malignant transformation |
| Hugo Symbol | Variant Class | Variant Classification | dbSNP RS | HGVSc | HGVSp | HGVSp Short | SWISSPROT | BIOTYPE | SIFT | PolyPhen | Tumor Sample Barcode | Tissue | Histology | Sex | Age | Stage | Therapy Types | Drugs | Outcome |
| LAMC2 | SNV | Missense_Mutation | rs564730705 | c.1741N>C | p.Glu581Gln | p.E581Q | Q13753 | protein_coding | tolerated(0.23) | benign(0.029) | TCGA-5L-AAT1-01 | Breast | breast invasive carcinoma | Female | <65 | III/IV | Hormone Therapy | letrozol | SD |
| LAMC2 | SNV | Missense_Mutation | novel | c.2351N>C | p.Asp784Ala | p.D784A | Q13753 | protein_coding | deleterious(0.05) | benign(0.073) | TCGA-A2-A0ST-01 | Breast | breast invasive carcinoma | Female | <65 | I/II | Chemotherapy | adriamycin | SD |
| LAMC2 | SNV | Missense_Mutation | novel | c.2351A>C | p.Asp784Ala | p.D784A | Q13753 | protein_coding | deleterious(0.05) | benign(0.073) | TCGA-A8-A097-01 | Breast | breast invasive carcinoma | Female | >=65 | I/II | Hormone Therapy | tamoxiphen | SD |
| LAMC2 | SNV | Missense_Mutation | c.1666N>C | p.Gly556Arg | p.G556R | Q13753 | protein_coding | deleterious(0) | probably_damaging(0.999) | TCGA-AN-A0FL-01 | Breast | breast invasive carcinoma | Female | <65 | I/II | Unknown | Unknown | SD | |
| LAMC2 | SNV | Missense_Mutation | novel | c.238N>T | p.Arg80Cys | p.R80C | Q13753 | protein_coding | tolerated(0.16) | benign(0.018) | TCGA-BH-A0C0-01 | Breast | breast invasive carcinoma | Female | <65 | I/II | Chemotherapy | carboplatin | SD |
| LAMC2 | SNV | Missense_Mutation | novel | c.655A>G | p.Lys219Glu | p.K219E | Q13753 | protein_coding | deleterious(0.02) | benign(0.038) | TCGA-C8-A26Y-01 | Breast | breast invasive carcinoma | Female | >=65 | I/II | Unknown | Unknown | SD |
| LAMC2 | SNV | Missense_Mutation | c.488N>C | p.Gly163Ala | p.G163A | Q13753 | protein_coding | deleterious(0) | probably_damaging(1) | TCGA-E2-A1LG-01 | Breast | breast invasive carcinoma | Female | <65 | I/II | Chemotherapy | doxorubicin | SD | |
| LAMC2 | SNV | Missense_Mutation | c.396N>C | p.Gln132His | p.Q132H | Q13753 | protein_coding | tolerated(0.14) | benign(0.109) | TCGA-GM-A2D9-01 | Breast | breast invasive carcinoma | Female | >=65 | I/II | Hormone Therapy | arimidex | SD | |
| LAMC2 | insertion | Frame_Shift_Ins | novel | c.1785_1786insCATTTCTTCACTCAACCATCCTTTATCAAGCACATACCAT | p.Gly596HisfsTer21 | p.G596Hfs*21 | Q13753 | protein_coding | TCGA-A7-A0CJ-01 | Breast | breast invasive carcinoma | Female | <65 | I/II | Chemotherapy | cytoxan | SD | ||
| LAMC2 | insertion | Frame_Shift_Ins | novel | c.2209_2210insCACCCAGGCGCTCA | p.Leu737SerfsTer33 | p.L737Sfs*33 | Q13753 | protein_coding | TCGA-A7-A0CJ-01 | Breast | breast invasive carcinoma | Female | <65 | I/II | Chemotherapy | cytoxan | SD |
| Page: 1 2 3 4 5 6 7 8 9 10 11 12 13 |
Top |
Related drugs of malignant transformation related genes |
| Identification of chemicals and drugs interact with genes involved in malignant transfromation |
| (DGIdb 4.0) |
| Entrez ID | Symbol | Category | Interaction Types | Drug Claim Name | Drug Name | PMIDs |
| 3918 | LAMC2 | DRUGGABLE GENOME | CHEMBL2095222 | OCRIPLASMIN | ||
| 3918 | LAMC2 | DRUGGABLE GENOME | BST-1005 |
| Page: 1 |

Copyright 2023-Present -The University of Texas Health Science Center at Houston |