
|
|||||
|
 | |
| |
| |
| |
| |
| |
|
Gene: LAMB2 |
Gene summary for LAMB2 |
| Gene information | Species | Human | Gene symbol | LAMB2 | Gene ID | 3913 |
| Gene name | laminin subunit beta 2 | |
| Gene Alias | LAMS | |
| Cytomap | 3p21.31 | |
| Gene Type | protein-coding | GO ID | GO:0000902 | UniProtAcc | A0A024R319 |
Top |
Malignant transformation analysis |
| Identification of the aberrant gene expression in precancerous and cancerous lesions by comparing the gene expression of stem-like cells in diseased tissues with normal stem cells |
| Entrez ID | Symbol | Replicates | Species | Organ | Tissue | Adj P-value | Log2FC | Malignancy |
| 3913 | LAMB2 | S43 | Human | Liver | Cirrhotic | 5.59e-05 | 3.31e-01 | -0.0187 |
| 3913 | LAMB2 | HCC1_Meng | Human | Liver | HCC | 2.18e-44 | 3.50e-02 | 0.0246 |
| 3913 | LAMB2 | HCC2_Meng | Human | Liver | HCC | 6.46e-14 | -1.60e-02 | 0.0107 |
| 3913 | LAMB2 | cirrhotic2 | Human | Liver | Cirrhotic | 1.74e-13 | 2.56e-01 | 0.0201 |
| 3913 | LAMB2 | cirrhotic3 | Human | Liver | Cirrhotic | 1.16e-09 | 2.49e-01 | 0.0215 |
| 3913 | LAMB2 | HCC1 | Human | Liver | HCC | 5.52e-04 | 3.75e+00 | 0.5336 |
| 3913 | LAMB2 | HCC2 | Human | Liver | HCC | 1.51e-08 | 3.52e+00 | 0.5341 |
| 3913 | LAMB2 | Pt13.b | Human | Liver | HCC | 4.34e-05 | 1.14e-01 | 0.0251 |
| 3913 | LAMB2 | Pt14.b | Human | Liver | HCC | 2.72e-03 | 2.76e-01 | 0.018 |
| 3913 | LAMB2 | S014 | Human | Liver | HCC | 1.47e-06 | 4.29e-01 | 0.2254 |
| 3913 | LAMB2 | S015 | Human | Liver | HCC | 2.63e-08 | 6.80e-01 | 0.2375 |
| 3913 | LAMB2 | S016 | Human | Liver | HCC | 1.58e-07 | 4.37e-01 | 0.2243 |
| 3913 | LAMB2 | S027 | Human | Liver | HCC | 2.99e-10 | 8.22e-01 | 0.2446 |
| 3913 | LAMB2 | S028 | Human | Liver | HCC | 2.00e-18 | 8.76e-01 | 0.2503 |
| 3913 | LAMB2 | S029 | Human | Liver | HCC | 7.15e-24 | 9.42e-01 | 0.2581 |
| 3913 | LAMB2 | C21 | Human | Oral cavity | OSCC | 2.79e-03 | 9.93e-02 | 0.2678 |
| 3913 | LAMB2 | C30 | Human | Oral cavity | OSCC | 3.19e-05 | 4.85e-01 | 0.3055 |
| 3913 | LAMB2 | C46 | Human | Oral cavity | OSCC | 1.74e-04 | 1.54e-01 | 0.1673 |
| 3913 | LAMB2 | C08 | Human | Oral cavity | OSCC | 1.75e-02 | 7.90e-02 | 0.1919 |
| 3913 | LAMB2 | C09 | Human | Oral cavity | OSCC | 1.32e-06 | 4.06e-01 | 0.1431 |
| Page: 1 2 3 |
| Tissue | Expression Dynamics | Abbreviation |
| Liver |  | HCC: Hepatocellular carcinoma |
| NAFLD: Non-alcoholic fatty liver disease | ||
| Oral Cavity | 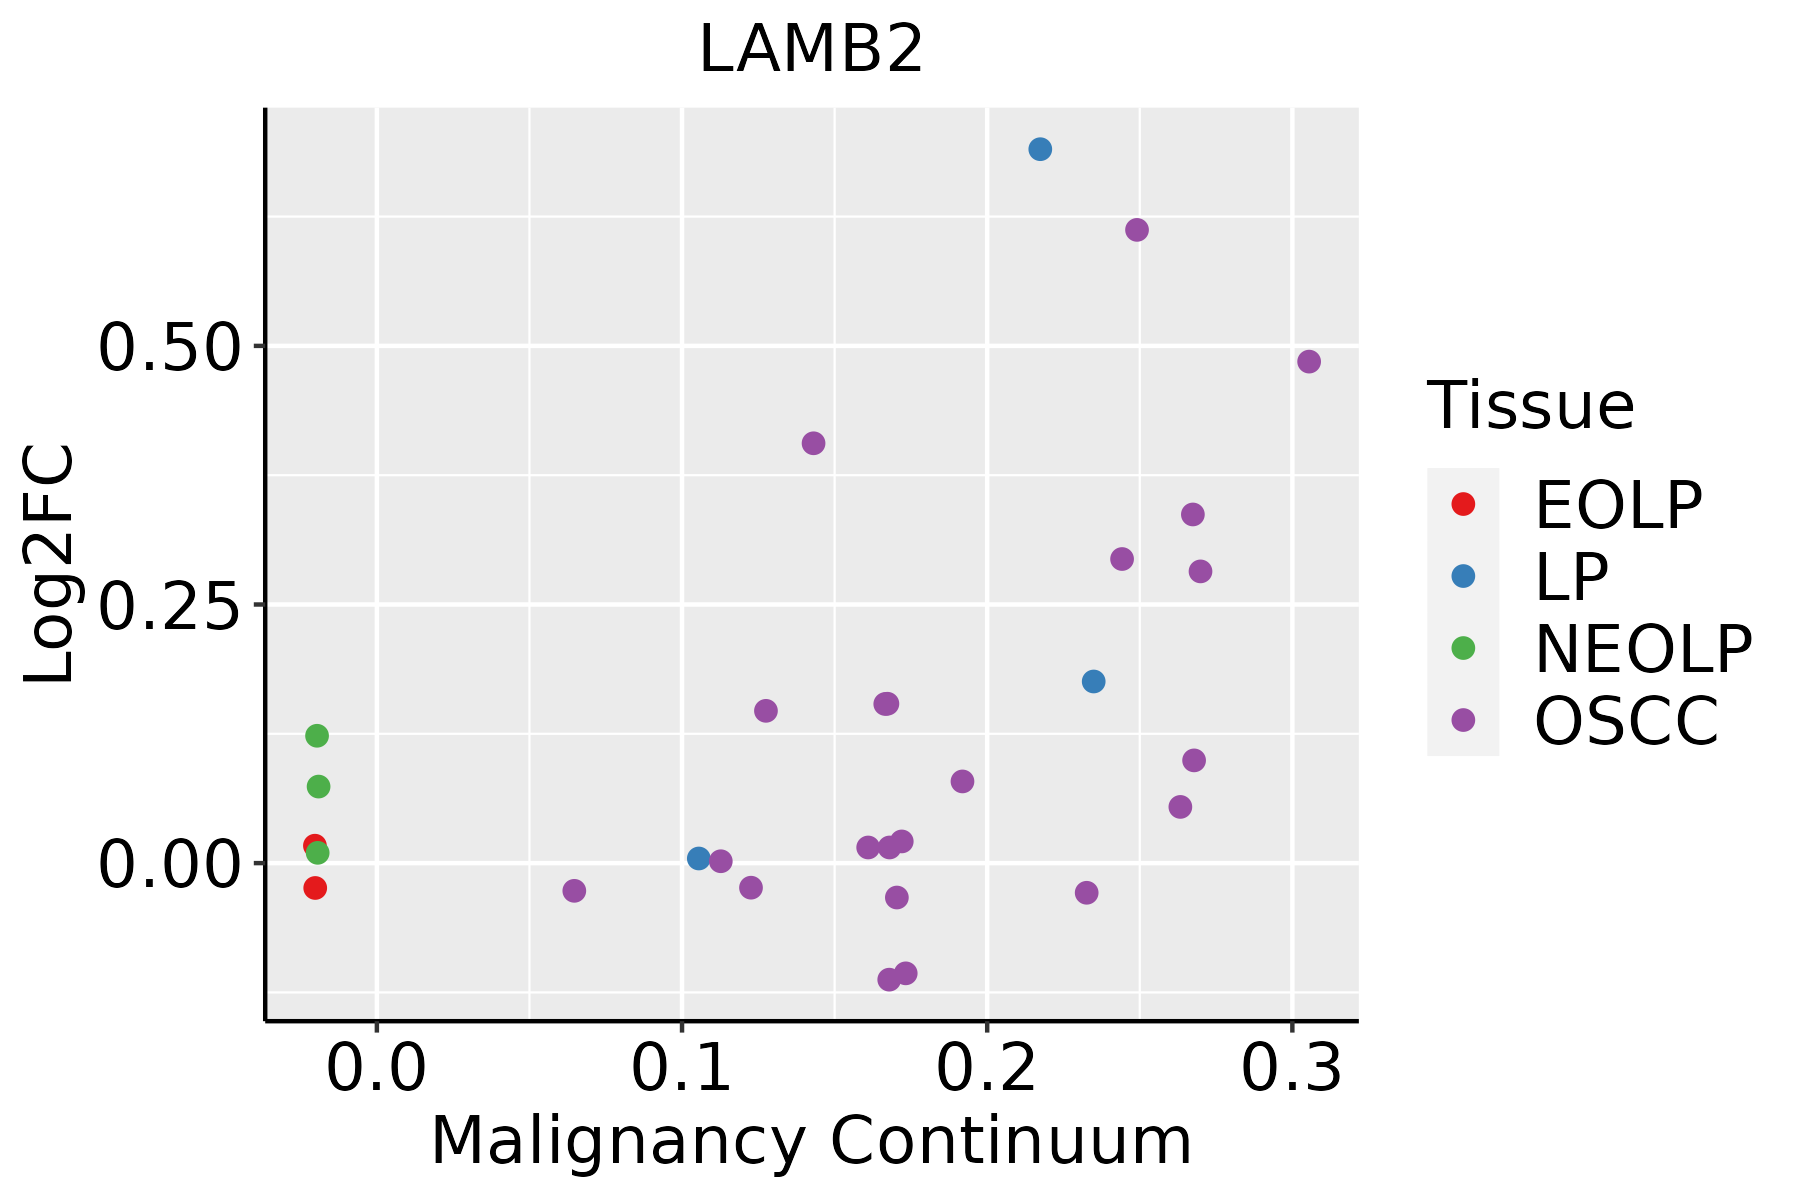 | EOLP: Erosive Oral lichen planus |
| LP: leukoplakia | ||
| NEOLP: Non-erosive oral lichen planus | ||
| OSCC: Oral squamous cell carcinoma | ||
| Prostate | 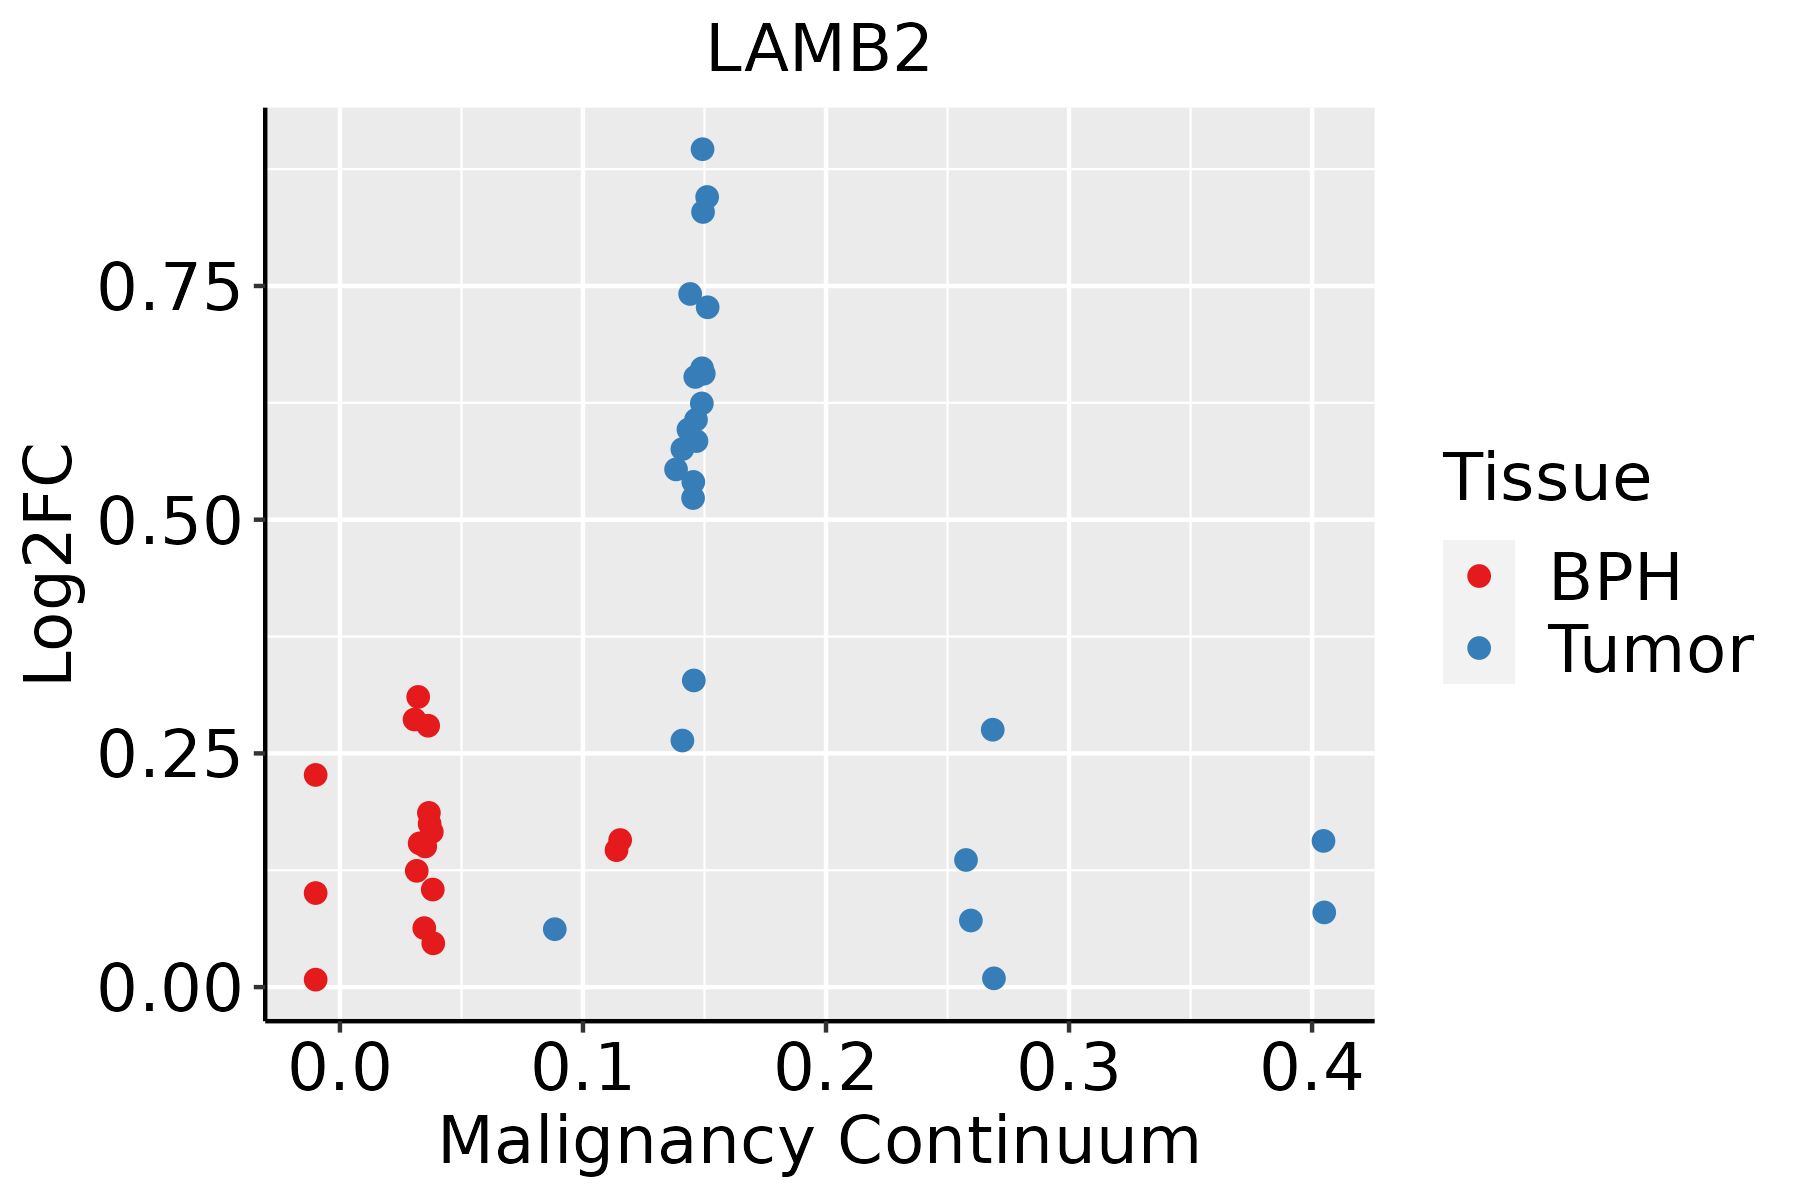 | BPH: Benign Prostatic Hyperplasia |
| Thyroid | 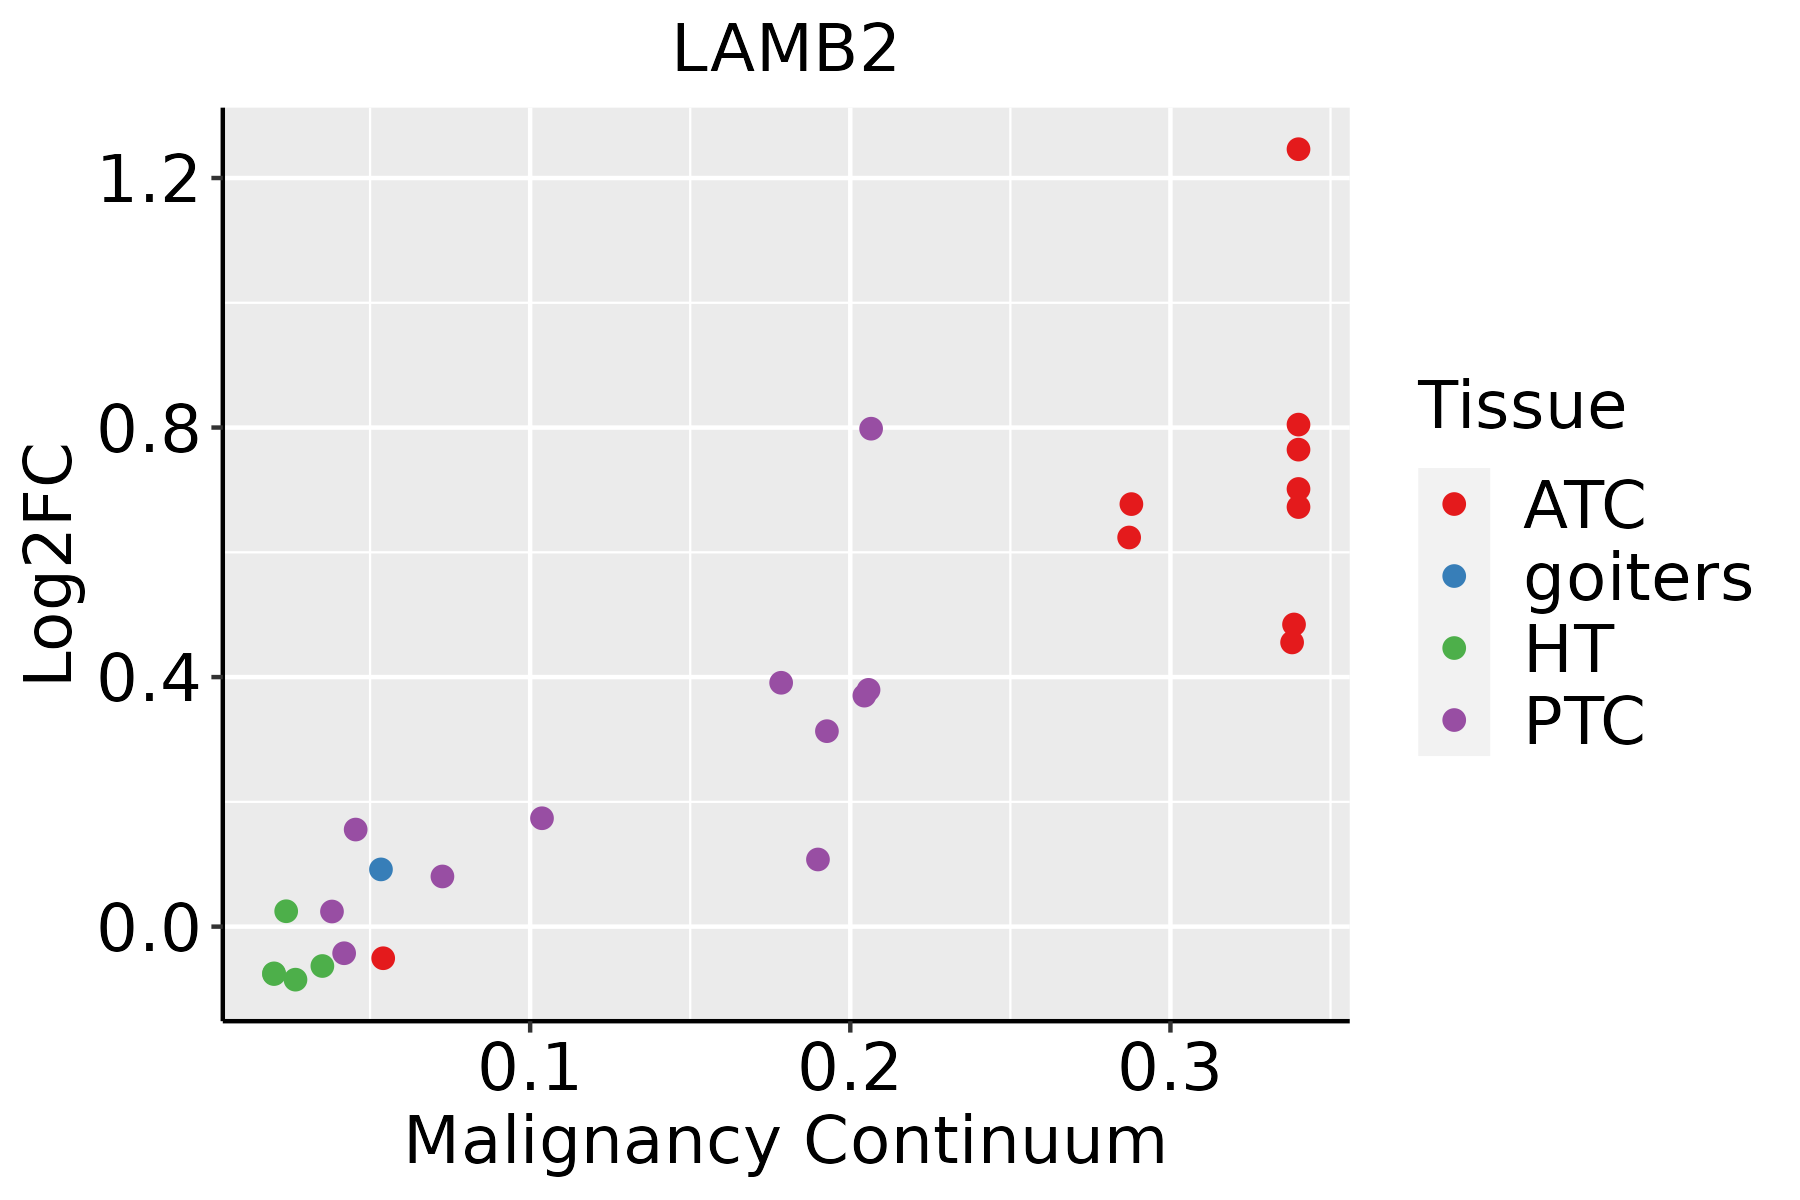 | ATC: Anaplastic thyroid cancer |
| HT: Hashimoto's thyroiditis | ||
| PTC: Papillary thyroid cancer |
| ∗log2FC in expression of this searched gene in stem-like cells from each diseased tissue sample relative to stem-like cells in normal samples in each tissue plotted against the malignancy continuum. Samples are colored based on if they are from different disease stage. |
Top |
Malignant transformation related pathway analysis |
| Find out the enriched GO biological processes and KEGG pathways involved in transition from healthy to precancer to cancer |
| Tissue | Disease Stage | Enriched GO biological Processes |
| Colorectum | AD |  |
| Colorectum | SER |  |
| Colorectum | MSS |  |
| Colorectum | MSI-H |  |
| Colorectum | FAP |  |
| ∗Top 15 enriched GO BP terms are showed in the bar plot of each disease state in each tissue. Each row represents a significant GO biological process which is colored according to the -log10(p.adjust). |
| Page: 1 2 3 4 5 6 7 8 9 |
| GO ID | Tissue | Disease Stage | Description | Gene Ratio | Bg Ratio | pvalue | p.adjust | Count |
| GO:003158912 | Liver | Cirrhotic | cell-substrate adhesion | 128/4634 | 363/18723 | 4.10e-06 | 6.90e-05 | 128 |
| GO:003444612 | Liver | Cirrhotic | substrate adhesion-dependent cell spreading | 47/4634 | 108/18723 | 1.48e-05 | 2.05e-04 | 47 |
| GO:001604911 | Liver | Cirrhotic | cell growth | 160/4634 | 482/18723 | 1.50e-05 | 2.07e-04 | 160 |
| GO:000206412 | Liver | Cirrhotic | epithelial cell development | 80/4634 | 220/18723 | 7.63e-05 | 8.44e-04 | 80 |
| GO:003109911 | Liver | Cirrhotic | regeneration | 71/4634 | 198/18723 | 3.02e-04 | 2.65e-03 | 71 |
| GO:0071711 | Liver | Cirrhotic | basement membrane organization | 17/4634 | 31/18723 | 3.19e-04 | 2.77e-03 | 17 |
| GO:0042063 | Liver | Cirrhotic | gliogenesis | 98/4634 | 301/18723 | 1.28e-03 | 8.60e-03 | 98 |
| GO:0010001 | Liver | Cirrhotic | glial cell differentiation | 75/4634 | 225/18723 | 2.24e-03 | 1.36e-02 | 75 |
| GO:0072015 | Liver | Cirrhotic | glomerular visceral epithelial cell development | 8/4634 | 12/18723 | 2.59e-03 | 1.53e-02 | 8 |
| GO:0072310 | Liver | Cirrhotic | glomerular epithelial cell development | 8/4634 | 13/18723 | 5.27e-03 | 2.70e-02 | 8 |
| GO:001604921 | Liver | HCC | cell growth | 269/7958 | 482/18723 | 1.84e-09 | 5.35e-08 | 269 |
| GO:003444622 | Liver | HCC | substrate adhesion-dependent cell spreading | 67/7958 | 108/18723 | 3.24e-05 | 3.28e-04 | 67 |
| GO:003158922 | Liver | HCC | cell-substrate adhesion | 188/7958 | 363/18723 | 2.00e-04 | 1.55e-03 | 188 |
| GO:00310992 | Liver | HCC | regeneration | 107/7958 | 198/18723 | 6.67e-04 | 4.12e-03 | 107 |
| GO:006056011 | Liver | HCC | developmental growth involved in morphogenesis | 124/7958 | 234/18723 | 7.37e-04 | 4.47e-03 | 124 |
| GO:00016553 | Liver | HCC | urogenital system development | 170/7958 | 338/18723 | 2.15e-03 | 1.08e-02 | 170 |
| GO:004867511 | Liver | HCC | axon extension | 67/7958 | 120/18723 | 2.17e-03 | 1.09e-02 | 67 |
| GO:199013811 | Liver | HCC | neuron projection extension | 92/7958 | 172/18723 | 2.31e-03 | 1.14e-02 | 92 |
| GO:00723101 | Liver | HCC | glomerular epithelial cell development | 11/7958 | 13/18723 | 2.38e-03 | 1.16e-02 | 11 |
| GO:004858811 | Liver | HCC | developmental cell growth | 121/7958 | 234/18723 | 2.68e-03 | 1.28e-02 | 121 |
| Page: 1 2 3 4 5 6 7 8 9 10 11 |
| Pathway ID | Tissue | Disease Stage | Description | Gene Ratio | Bg Ratio | pvalue | p.adjust | qvalue | Count |
| hsa0451021 | Liver | Cirrhotic | Focal adhesion | 93/2530 | 203/8465 | 9.27e-07 | 1.10e-05 | 6.80e-06 | 93 |
| hsa05165 | Liver | Cirrhotic | Human papillomavirus infection | 124/2530 | 331/8465 | 1.55e-03 | 7.83e-03 | 4.83e-03 | 124 |
| hsa0514512 | Liver | Cirrhotic | Toxoplasmosis | 47/2530 | 112/8465 | 4.16e-03 | 1.63e-02 | 1.00e-02 | 47 |
| hsa0451031 | Liver | Cirrhotic | Focal adhesion | 93/2530 | 203/8465 | 9.27e-07 | 1.10e-05 | 6.80e-06 | 93 |
| hsa051651 | Liver | Cirrhotic | Human papillomavirus infection | 124/2530 | 331/8465 | 1.55e-03 | 7.83e-03 | 4.83e-03 | 124 |
| hsa0514513 | Liver | Cirrhotic | Toxoplasmosis | 47/2530 | 112/8465 | 4.16e-03 | 1.63e-02 | 1.00e-02 | 47 |
| hsa0451041 | Liver | HCC | Focal adhesion | 125/4020 | 203/8465 | 3.12e-05 | 1.88e-04 | 1.04e-04 | 125 |
| hsa051652 | Liver | HCC | Human papillomavirus infection | 188/4020 | 331/8465 | 3.34e-04 | 1.49e-03 | 8.29e-04 | 188 |
| hsa0514521 | Liver | HCC | Toxoplasmosis | 70/4020 | 112/8465 | 9.25e-04 | 3.52e-03 | 1.96e-03 | 70 |
| hsa052224 | Liver | HCC | Small cell lung cancer | 57/4020 | 92/8465 | 3.54e-03 | 1.12e-02 | 6.22e-03 | 57 |
| hsa0451051 | Liver | HCC | Focal adhesion | 125/4020 | 203/8465 | 3.12e-05 | 1.88e-04 | 1.04e-04 | 125 |
| hsa051653 | Liver | HCC | Human papillomavirus infection | 188/4020 | 331/8465 | 3.34e-04 | 1.49e-03 | 8.29e-04 | 188 |
| hsa0514531 | Liver | HCC | Toxoplasmosis | 70/4020 | 112/8465 | 9.25e-04 | 3.52e-03 | 1.96e-03 | 70 |
| hsa0522211 | Liver | HCC | Small cell lung cancer | 57/4020 | 92/8465 | 3.54e-03 | 1.12e-02 | 6.22e-03 | 57 |
| hsa051659 | Oral cavity | OSCC | Human papillomavirus infection | 200/3704 | 331/8465 | 3.83e-10 | 4.93e-09 | 2.51e-09 | 200 |
| hsa0451019 | Oral cavity | OSCC | Focal adhesion | 128/3704 | 203/8465 | 1.71e-08 | 1.63e-07 | 8.31e-08 | 128 |
| hsa052228 | Oral cavity | OSCC | Small cell lung cancer | 66/3704 | 92/8465 | 4.43e-08 | 3.38e-07 | 1.72e-07 | 66 |
| hsa0514520 | Oral cavity | OSCC | Toxoplasmosis | 75/3704 | 112/8465 | 5.28e-07 | 3.16e-06 | 1.61e-06 | 75 |
| hsa041516 | Oral cavity | OSCC | PI3K-Akt signaling pathway | 185/3704 | 354/8465 | 6.26e-04 | 1.86e-03 | 9.49e-04 | 185 |
| hsa051468 | Oral cavity | OSCC | Amoebiasis | 59/3704 | 102/8465 | 2.78e-03 | 7.17e-03 | 3.65e-03 | 59 |
| Page: 1 2 3 4 |
Top |
Cell-cell communication analysis |
| Identification of potential cell-cell interactions between two cell types and their ligand-receptor pairs for different disease states |
| Ligand | Receptor | LRpair | Pathway | Tissue | Disease Stage |
| LAMB2 | ITGA1_ITGB1 | LAMB2_ITGA1_ITGB1 | LAMININ | Breast | ADJ |
| LAMB2 | ITGA2_ITGB1 | LAMB2_ITGA2_ITGB1 | LAMININ | Breast | ADJ |
| LAMB2 | CD44 | LAMB2_CD44 | LAMININ | Breast | ADJ |
| LAMB2 | ITGA1_ITGB1 | LAMB2_ITGA1_ITGB1 | LAMININ | Breast | DCIS |
| LAMB2 | ITGA2_ITGB1 | LAMB2_ITGA2_ITGB1 | LAMININ | Breast | DCIS |
| LAMB2 | ITGA6_ITGB1 | LAMB2_ITGA6_ITGB1 | LAMININ | Breast | DCIS |
| LAMB2 | ITGA7_ITGB1 | LAMB2_ITGA7_ITGB1 | LAMININ | Breast | DCIS |
| LAMB2 | ITGA6_ITGB4 | LAMB2_ITGA6_ITGB4 | LAMININ | Breast | DCIS |
| LAMB2 | CD44 | LAMB2_CD44 | LAMININ | Breast | DCIS |
| LAMB2 | DAG1 | LAMB2_DAG1 | LAMININ | Breast | DCIS |
| LAMB2 | ITGA1_ITGB1 | LAMB2_ITGA1_ITGB1 | LAMININ | Breast | Healthy |
| LAMB2 | ITGA2_ITGB1 | LAMB2_ITGA2_ITGB1 | LAMININ | Breast | Healthy |
| LAMB2 | ITGA6_ITGB1 | LAMB2_ITGA6_ITGB1 | LAMININ | Breast | Healthy |
| LAMB2 | ITGA7_ITGB1 | LAMB2_ITGA7_ITGB1 | LAMININ | Breast | Healthy |
| LAMB2 | ITGAV_ITGB8 | LAMB2_ITGAV_ITGB8 | LAMININ | Breast | Healthy |
| LAMB2 | CD44 | LAMB2_CD44 | LAMININ | Breast | Healthy |
| LAMB2 | ITGA1_ITGB1 | LAMB2_ITGA1_ITGB1 | LAMININ | Breast | IDC |
| LAMB2 | ITGA6_ITGB1 | LAMB2_ITGA6_ITGB1 | LAMININ | Breast | IDC |
| LAMB2 | CD44 | LAMB2_CD44 | LAMININ | Breast | IDC |
| LAMB2 | ITGA1_ITGB1 | LAMB2_ITGA1_ITGB1 | LAMININ | Breast | Precancer |
| Page: 1 2 3 4 5 6 7 8 9 10 11 12 13 14 15 |
Top |
Single-cell gene regulatory network inference analysis |
| Find out the significant the regulons (TFs) and the target genes of each regulon across cell types for different disease states |
| TF | Cell Type | Tissue | Disease Stage | Target Gene | RSS | Regulon Activity |
| ∗The dot plots of a searched regulon are shown for all cell subpopulations in each disease state of each tissue based on the regulon specific score inferred using pySCENIC and by calculating the average expression. |
| Page: 1 |
Top |
Somatic mutation of malignant transformation related genes |
| Annotation of somatic variants for genes involved in malignant transformation |
| Hugo Symbol | Variant Class | Variant Classification | dbSNP RS | HGVSc | HGVSp | HGVSp Short | SWISSPROT | BIOTYPE | SIFT | PolyPhen | Tumor Sample Barcode | Tissue | Histology | Sex | Age | Stage | Therapy Types | Drugs | Outcome |
| LAMB2 | SNV | Missense_Mutation | c.5393N>T | p.Gln1798Leu | p.Q1798L | P55268 | protein_coding | deleterious(0) | probably_damaging(0.991) | TCGA-A8-A06P-01 | Breast | breast invasive carcinoma | Female | <65 | III/IV | Unspecific | SD | ||
| LAMB2 | SNV | Missense_Mutation | rs762984990 | c.3442N>T | p.Arg1148Cys | p.R1148C | P55268 | protein_coding | deleterious(0.01) | possibly_damaging(0.524) | TCGA-AC-A3W6-01 | Breast | breast invasive carcinoma | Female | >=65 | III/IV | Unknown | Unknown | SD |
| LAMB2 | SNV | Missense_Mutation | c.1000C>T | p.Arg334Cys | p.R334C | P55268 | protein_coding | deleterious(0) | possibly_damaging(0.837) | TCGA-D8-A1X5-01 | Breast | breast invasive carcinoma | Female | >=65 | III/IV | Hormone Therapy | tamoxiphen | SD | |
| LAMB2 | SNV | Missense_Mutation | c.931N>G | p.Ile311Val | p.I311V | P55268 | protein_coding | tolerated(1) | benign(0) | TCGA-D8-A1XK-01 | Breast | breast invasive carcinoma | Female | <65 | I/II | Chemotherapy | doxorubicine+cyclophosphamide | SD | |
| LAMB2 | SNV | Missense_Mutation | rs777003946 | c.1264N>T | p.Arg422Cys | p.R422C | P55268 | protein_coding | deleterious(0.03) | possibly_damaging(0.576) | TCGA-E2-A14Q-01 | Breast | breast invasive carcinoma | Female | <65 | I/II | Hormone Therapy | tamoxiphen | SD |
| LAMB2 | SNV | Missense_Mutation | c.4868N>A | p.Gly1623Asp | p.G1623D | P55268 | protein_coding | tolerated(0.44) | possibly_damaging(0.738) | TCGA-E2-A14Y-01 | Breast | breast invasive carcinoma | Female | <65 | I/II | Chemotherapy | carboplatin | SD | |
| LAMB2 | SNV | Missense_Mutation | c.2260N>A | p.Leu754Met | p.L754M | P55268 | protein_coding | tolerated(0.46) | benign(0.09) | TCGA-E9-A1R4-01 | Breast | breast invasive carcinoma | Female | >=65 | I/II | Chemotherapy | 5-fluorouracil | SD | |
| LAMB2 | SNV | Missense_Mutation | c.3107N>G | p.His1036Arg | p.H1036R | P55268 | protein_coding | tolerated(1) | benign(0) | TCGA-EW-A1IZ-01 | Breast | breast invasive carcinoma | Female | <65 | III/IV | Chemotherapy | taxotere | SD | |
| LAMB2 | SNV | Missense_Mutation | c.311N>G | p.His104Arg | p.H104R | P55268 | protein_coding | tolerated(0.37) | benign(0.02) | TCGA-GM-A2DD-01 | Breast | breast invasive carcinoma | Female | <65 | I/II | Chemotherapy | fluorouracil | CR | |
| LAMB2 | insertion | Nonsense_Mutation | novel | c.5165_5166insGTAGTATGTTTGAATCTTCTGATATCTCCT | p.Gln1722_Gly1723insTer | p.Q1722_G1723ins* | P55268 | protein_coding | TCGA-A2-A0EY-01 | Breast | breast invasive carcinoma | Female | <65 | I/II | Chemotherapy | adriamycin | SD |
| Page: 1 2 3 4 5 6 7 8 9 10 11 12 13 14 15 16 17 |
Top |
Related drugs of malignant transformation related genes |
| Identification of chemicals and drugs interact with genes involved in malignant transfromation |
| (DGIdb 4.0) |
| Entrez ID | Symbol | Category | Interaction Types | Drug Claim Name | Drug Name | PMIDs |
| 3913 | LAMB2 | DRUGGABLE GENOME | CHEMBL2095222 | OCRIPLASMIN | ||
| 3913 | LAMB2 | DRUGGABLE GENOME | CHEMBL2095222 | OCRIPLASMIN |
| Page: 1 |

Copyright 2023-Present -The University of Texas Health Science Center at Houston |