
|
|||||
|
 | |
| |
| |
| |
| |
| |
|
Gene: LAMA5 |
Gene summary for LAMA5 |
| Gene information | Species | Human | Gene symbol | LAMA5 | Gene ID | 3911 |
| Gene name | laminin subunit alpha 5 | |
| Gene Alias | LAMA5 | |
| Cytomap | 20q13.33 | |
| Gene Type | protein-coding | GO ID | GO:0000902 | UniProtAcc | O15230 |
Top |
Malignant transformation analysis |
| Identification of the aberrant gene expression in precancerous and cancerous lesions by comparing the gene expression of stem-like cells in diseased tissues with normal stem cells |
| Entrez ID | Symbol | Replicates | Species | Organ | Tissue | Adj P-value | Log2FC | Malignancy |
| 3911 | LAMA5 | AEH-subject1 | Human | Endometrium | AEH | 2.80e-03 | 3.35e-01 | -0.3059 |
| 3911 | LAMA5 | AEH-subject2 | Human | Endometrium | AEH | 2.49e-06 | 3.93e-01 | -0.2525 |
| 3911 | LAMA5 | AEH-subject3 | Human | Endometrium | AEH | 2.54e-03 | 3.29e-01 | -0.2576 |
| 3911 | LAMA5 | EEC-subject2 | Human | Endometrium | EEC | 8.69e-12 | 5.34e-01 | -0.2607 |
| 3911 | LAMA5 | GSM5276934 | Human | Endometrium | EEC | 5.48e-03 | -1.50e-01 | -0.0913 |
| 3911 | LAMA5 | GSM6177620_NYU_UCEC1_lib1_lib1 | Human | Endometrium | EEC | 9.91e-10 | 1.19e-01 | -0.1869 |
| 3911 | LAMA5 | GSM6177620_NYU_UCEC1_lib2_lib2 | Human | Endometrium | EEC | 1.30e-08 | 1.42e-01 | -0.1875 |
| 3911 | LAMA5 | GSM6177620_NYU_UCEC1_lib3_lib3 | Human | Endometrium | EEC | 9.95e-11 | 1.92e-01 | -0.1883 |
| 3911 | LAMA5 | GSM6177621_NYU_UCEC2_lib1_lib1 | Human | Endometrium | EEC | 1.77e-02 | 2.60e-01 | -0.1934 |
| 3911 | LAMA5 | GSM6177622_NYU_UCEC3_lib1_lib1 | Human | Endometrium | EEC | 5.71e-14 | 1.97e-01 | -0.1917 |
| 3911 | LAMA5 | GSM6177622_NYU_UCEC3_lib2_lib2 | Human | Endometrium | EEC | 2.37e-12 | 2.27e-01 | -0.1916 |
| 3911 | LAMA5 | GSM6177623_NYU_UCEC3_Vis | Human | Endometrium | EEC | 2.45e-33 | 8.49e-01 | -0.1269 |
| 3911 | LAMA5 | LZE4T | Human | Esophagus | ESCC | 3.63e-11 | 4.82e-02 | 0.0811 |
| 3911 | LAMA5 | LZE5T | Human | Esophagus | ESCC | 4.18e-02 | 3.74e-01 | 0.0514 |
| 3911 | LAMA5 | LZE7T | Human | Esophagus | ESCC | 8.82e-05 | 2.97e-01 | 0.0667 |
| 3911 | LAMA5 | LZE8T | Human | Esophagus | ESCC | 9.69e-09 | 2.02e-01 | 0.067 |
| 3911 | LAMA5 | LZE20T | Human | Esophagus | ESCC | 2.55e-07 | 4.12e-01 | 0.0662 |
| 3911 | LAMA5 | LZE22D1 | Human | Esophagus | HGIN | 7.31e-03 | 9.15e-02 | 0.0595 |
| 3911 | LAMA5 | LZE24D1 | Human | Esophagus | HGIN | 3.98e-02 | 3.21e-01 | 0.054 |
| 3911 | LAMA5 | LZE24T | Human | Esophagus | ESCC | 8.98e-11 | 3.64e-01 | 0.0596 |
| Page: 1 2 3 4 5 6 7 8 |
| Tissue | Expression Dynamics | Abbreviation |
| Endometrium |  | AEH: Atypical endometrial hyperplasia |
| EEC: Endometrioid Cancer | ||
| Esophagus |  | ESCC: Esophageal squamous cell carcinoma |
| HGIN: High-grade intraepithelial neoplasias | ||
| LGIN: Low-grade intraepithelial neoplasias | ||
| Liver | 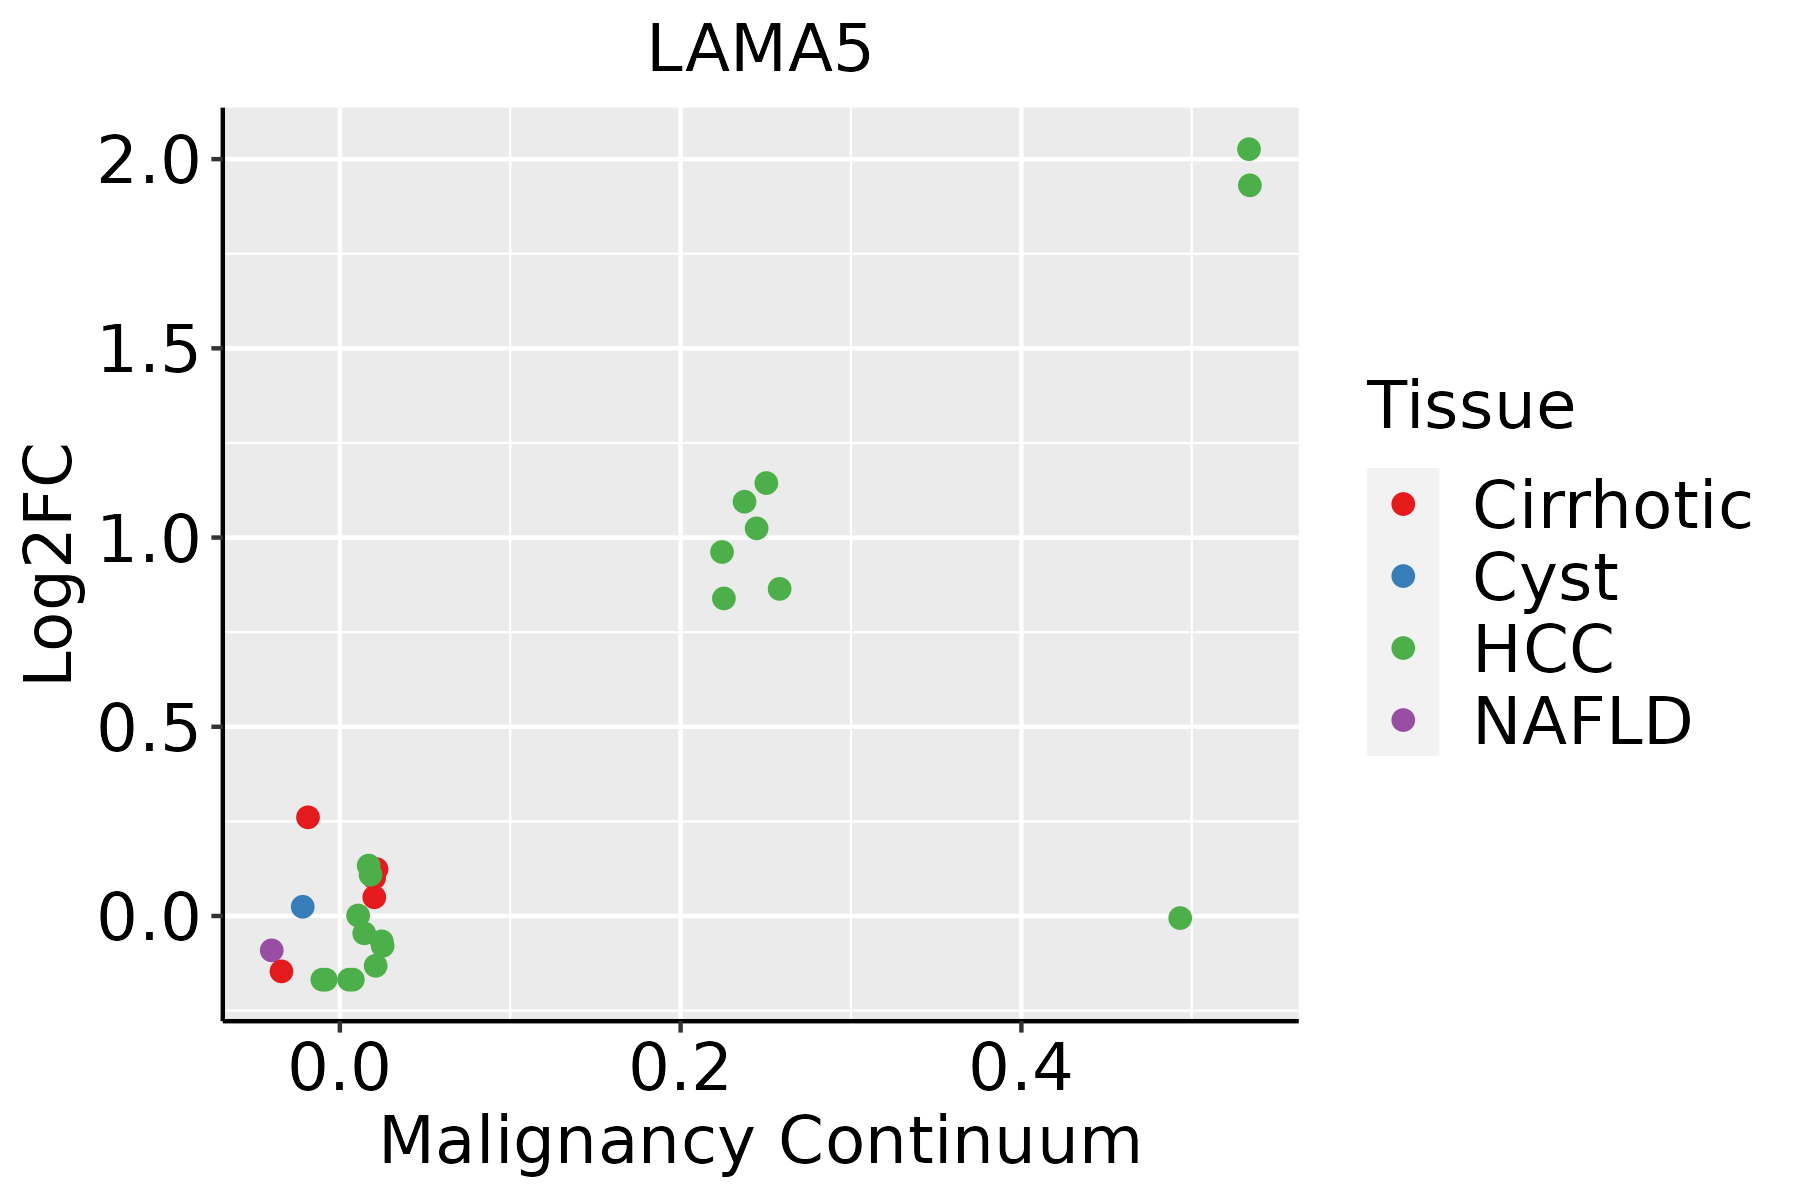 | HCC: Hepatocellular carcinoma |
| NAFLD: Non-alcoholic fatty liver disease | ||
| Oral Cavity |  | EOLP: Erosive Oral lichen planus |
| LP: leukoplakia | ||
| NEOLP: Non-erosive oral lichen planus | ||
| OSCC: Oral squamous cell carcinoma | ||
| Prostate |  | BPH: Benign Prostatic Hyperplasia |
| Skin | 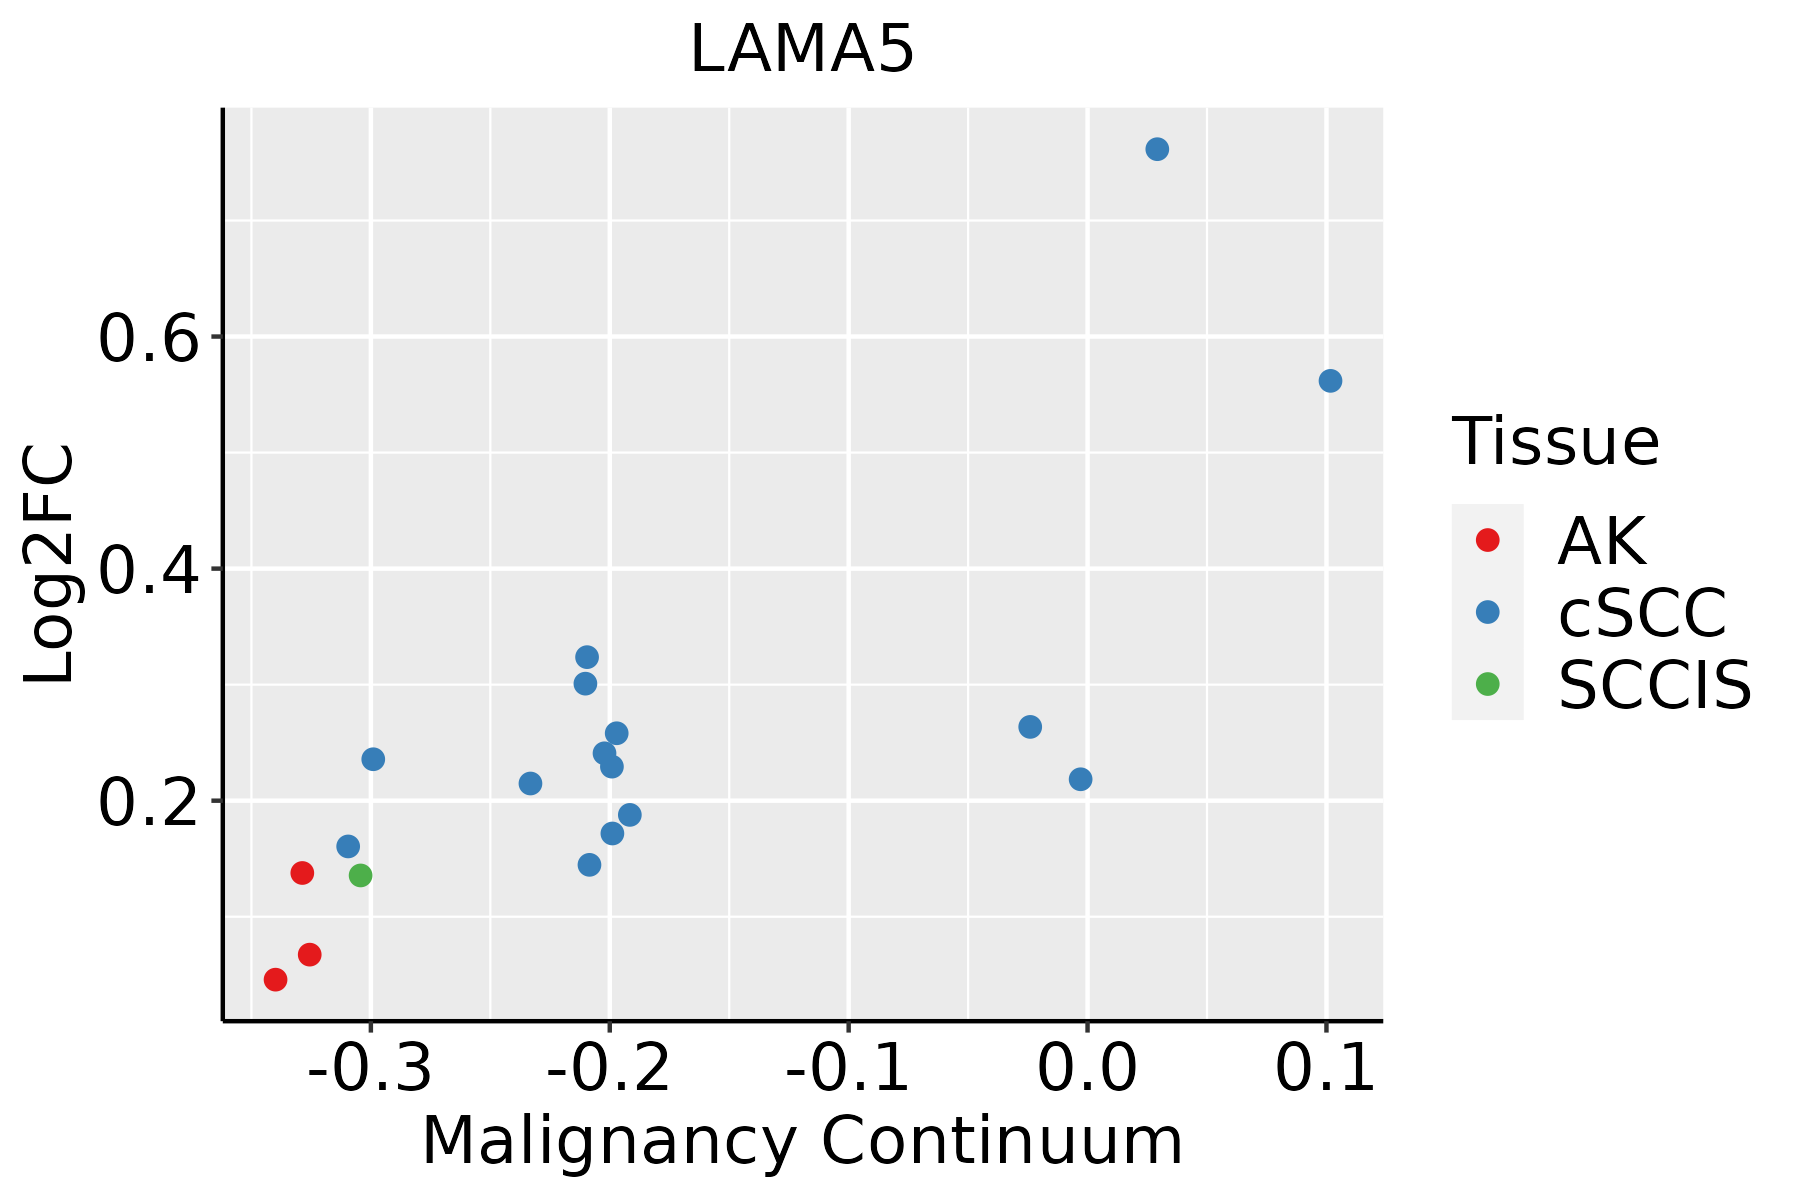 | AK: Actinic keratosis |
| cSCC: Cutaneous squamous cell carcinoma | ||
| SCCIS:squamous cell carcinoma in situ | ||
| Thyroid | 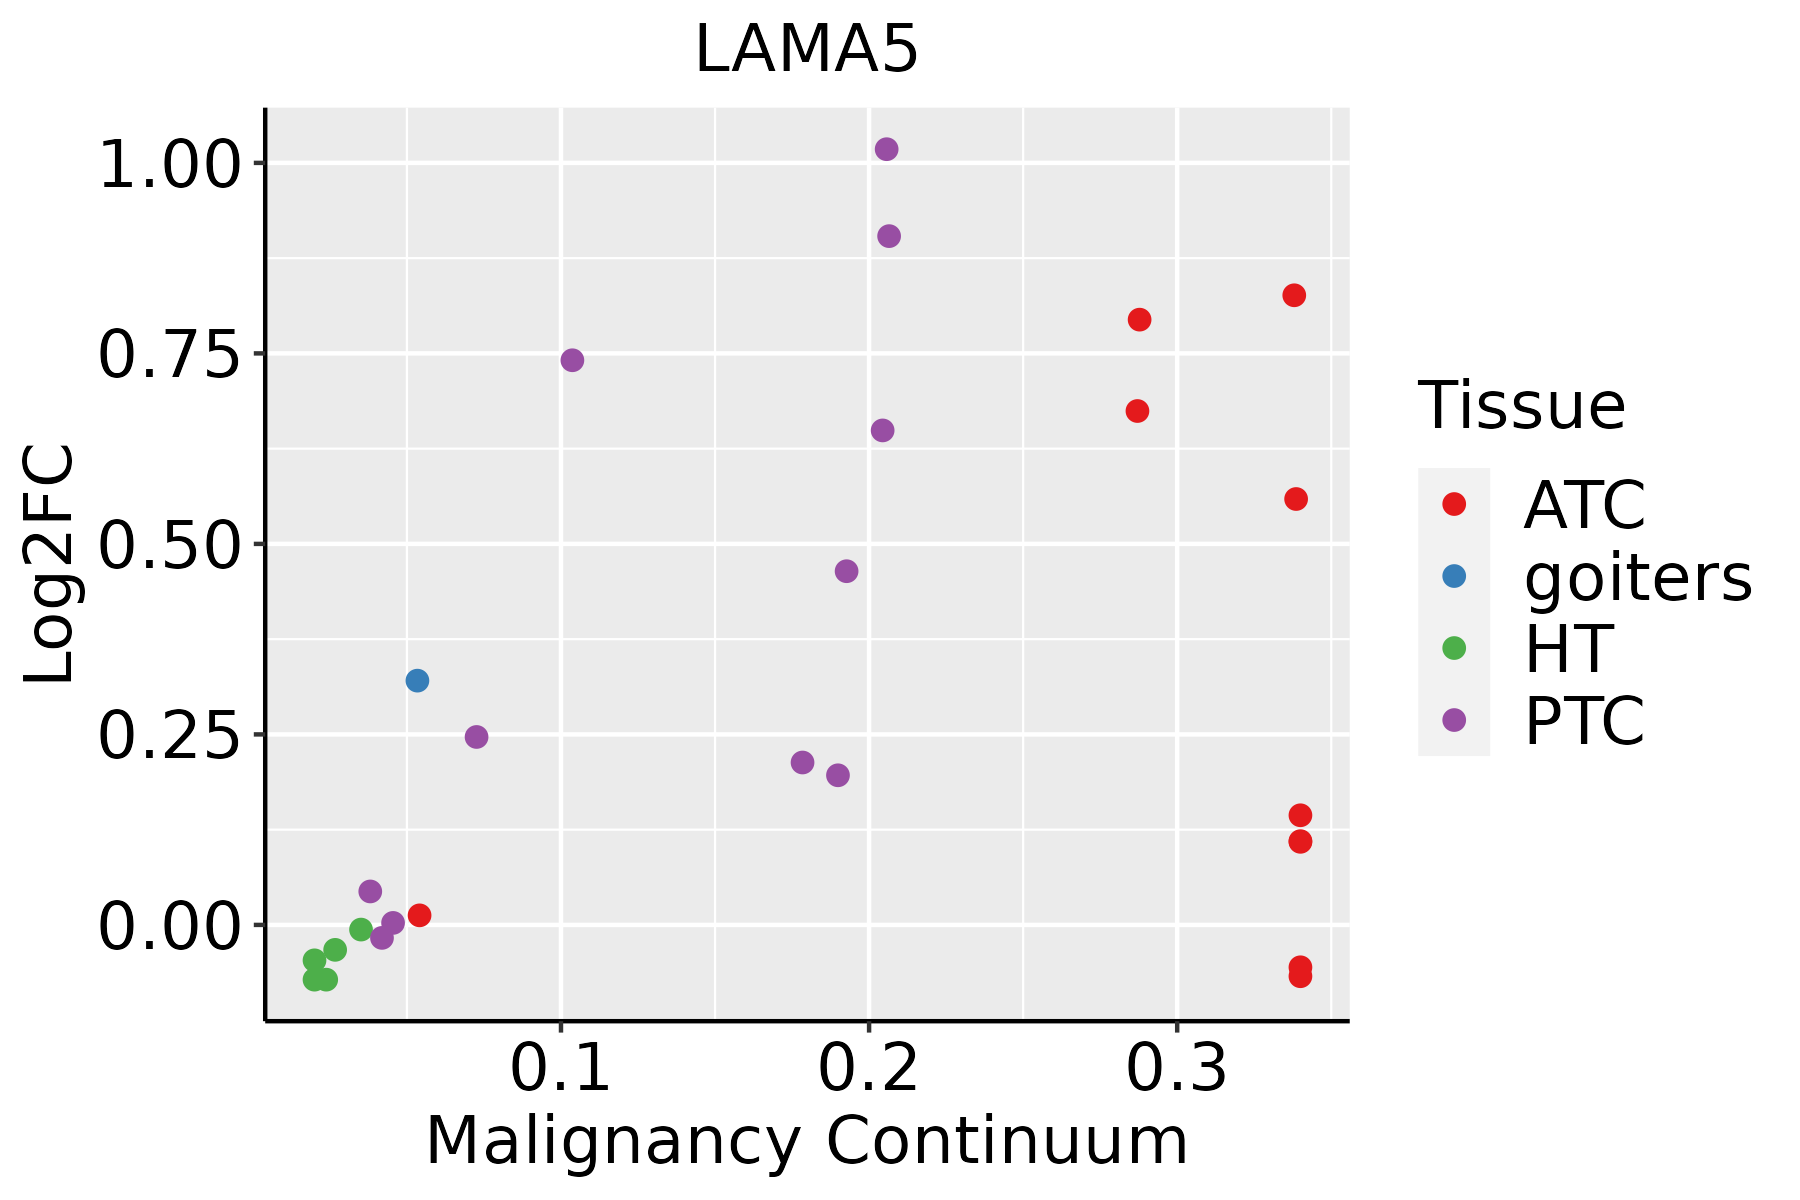 | ATC: Anaplastic thyroid cancer |
| HT: Hashimoto's thyroiditis | ||
| PTC: Papillary thyroid cancer |
| ∗log2FC in expression of this searched gene in stem-like cells from each diseased tissue sample relative to stem-like cells in normal samples in each tissue plotted against the malignancy continuum. Samples are colored based on if they are from different disease stage. |
Top |
Malignant transformation related pathway analysis |
| Find out the enriched GO biological processes and KEGG pathways involved in transition from healthy to precancer to cancer |
| Tissue | Disease Stage | Enriched GO biological Processes |
| Colorectum | AD |  |
| Colorectum | SER |  |
| Colorectum | MSS |  |
| Colorectum | MSI-H |  |
| Colorectum | FAP |  |
| ∗Top 15 enriched GO BP terms are showed in the bar plot of each disease state in each tissue. Each row represents a significant GO biological process which is colored according to the -log10(p.adjust). |
| Page: 1 2 3 4 5 6 7 8 9 |
| GO ID | Tissue | Disease Stage | Description | Gene Ratio | Bg Ratio | pvalue | p.adjust | Count |
| GO:00315899 | Endometrium | AEH | cell-substrate adhesion | 87/2100 | 363/18723 | 3.51e-12 | 5.70e-10 | 87 |
| GO:003444610 | Endometrium | AEH | substrate adhesion-dependent cell spreading | 33/2100 | 108/18723 | 4.45e-08 | 2.43e-06 | 33 |
| GO:007265914 | Endometrium | AEH | protein localization to plasma membrane | 63/2100 | 284/18723 | 7.58e-08 | 3.92e-06 | 63 |
| GO:00072296 | Endometrium | AEH | integrin-mediated signaling pathway | 32/2100 | 107/18723 | 1.24e-07 | 5.80e-06 | 32 |
| GO:000166710 | Endometrium | AEH | ameboidal-type cell migration | 90/2100 | 475/18723 | 3.73e-07 | 1.57e-05 | 90 |
| GO:00074098 | Endometrium | AEH | axonogenesis | 81/2100 | 418/18723 | 5.54e-07 | 2.12e-05 | 81 |
| GO:19907789 | Endometrium | AEH | protein localization to cell periphery | 68/2100 | 333/18723 | 6.38e-07 | 2.38e-05 | 68 |
| GO:00615648 | Endometrium | AEH | axon development | 88/2100 | 467/18723 | 6.39e-07 | 2.38e-05 | 88 |
| GO:004873216 | Endometrium | AEH | gland development | 83/2100 | 436/18723 | 8.62e-07 | 3.11e-05 | 83 |
| GO:00016556 | Endometrium | AEH | urogenital system development | 67/2100 | 338/18723 | 2.30e-06 | 6.76e-05 | 67 |
| GO:00720015 | Endometrium | AEH | renal system development | 61/2100 | 302/18723 | 3.43e-06 | 9.24e-05 | 61 |
| GO:00605627 | Endometrium | AEH | epithelial tube morphogenesis | 63/2100 | 325/18723 | 9.63e-06 | 2.23e-04 | 63 |
| GO:00226129 | Endometrium | AEH | gland morphogenesis | 30/2100 | 118/18723 | 1.21e-05 | 2.68e-04 | 30 |
| GO:00611384 | Endometrium | AEH | morphogenesis of a branching epithelium | 40/2100 | 182/18723 | 2.16e-05 | 4.20e-04 | 40 |
| GO:00018224 | Endometrium | AEH | kidney development | 57/2100 | 293/18723 | 2.25e-05 | 4.35e-04 | 57 |
| GO:00017637 | Endometrium | AEH | morphogenesis of a branching structure | 42/2100 | 196/18723 | 2.58e-05 | 4.86e-04 | 42 |
| GO:00609932 | Endometrium | AEH | kidney morphogenesis | 24/2100 | 93/18723 | 6.73e-05 | 1.04e-03 | 24 |
| GO:00075174 | Endometrium | AEH | muscle organ development | 60/2100 | 327/18723 | 8.19e-05 | 1.22e-03 | 60 |
| GO:00487542 | Endometrium | AEH | branching morphogenesis of an epithelial tube | 33/2100 | 151/18723 | 1.22e-04 | 1.68e-03 | 33 |
| GO:00487625 | Endometrium | AEH | mesenchymal cell differentiation | 46/2100 | 236/18723 | 1.27e-04 | 1.74e-03 | 46 |
| Page: 1 2 3 4 5 6 7 8 9 10 11 12 13 14 15 16 17 18 |
| Pathway ID | Tissue | Disease Stage | Description | Gene Ratio | Bg Ratio | pvalue | p.adjust | qvalue | Count |
| hsa0451015 | Endometrium | AEH | Focal adhesion | 58/1197 | 203/8465 | 4.99e-08 | 7.37e-07 | 5.39e-07 | 58 |
| hsa051466 | Endometrium | AEH | Amoebiasis | 29/1197 | 102/8465 | 1.22e-04 | 1.10e-03 | 8.06e-04 | 29 |
| hsa0451016 | Endometrium | AEH | Focal adhesion | 58/1197 | 203/8465 | 4.99e-08 | 7.37e-07 | 5.39e-07 | 58 |
| hsa0514613 | Endometrium | AEH | Amoebiasis | 29/1197 | 102/8465 | 1.22e-04 | 1.10e-03 | 8.06e-04 | 29 |
| hsa0451024 | Endometrium | EEC | Focal adhesion | 58/1237 | 203/8465 | 1.61e-07 | 2.30e-06 | 1.71e-06 | 58 |
| hsa0514516 | Endometrium | EEC | Toxoplasmosis | 28/1237 | 112/8465 | 2.48e-03 | 1.48e-02 | 1.11e-02 | 28 |
| hsa0451034 | Endometrium | EEC | Focal adhesion | 58/1237 | 203/8465 | 1.61e-07 | 2.30e-06 | 1.71e-06 | 58 |
| hsa0514517 | Endometrium | EEC | Toxoplasmosis | 28/1237 | 112/8465 | 2.48e-03 | 1.48e-02 | 1.11e-02 | 28 |
| hsa0516510 | Esophagus | ESCC | Human papillomavirus infection | 215/4205 | 331/8465 | 7.86e-09 | 7.12e-08 | 3.65e-08 | 215 |
| hsa052229 | Esophagus | ESCC | Small cell lung cancer | 69/4205 | 92/8465 | 5.40e-07 | 3.85e-06 | 1.97e-06 | 69 |
| hsa0514525 | Esophagus | ESCC | Toxoplasmosis | 76/4205 | 112/8465 | 6.83e-05 | 2.90e-04 | 1.48e-04 | 76 |
| hsa0451020 | Esophagus | ESCC | Focal adhesion | 127/4205 | 203/8465 | 1.25e-04 | 4.99e-04 | 2.56e-04 | 127 |
| hsa041517 | Esophagus | ESCC | PI3K-Akt signaling pathway | 197/4205 | 354/8465 | 1.24e-02 | 2.83e-02 | 1.45e-02 | 197 |
| hsa0516515 | Esophagus | ESCC | Human papillomavirus infection | 215/4205 | 331/8465 | 7.86e-09 | 7.12e-08 | 3.65e-08 | 215 |
| hsa0522216 | Esophagus | ESCC | Small cell lung cancer | 69/4205 | 92/8465 | 5.40e-07 | 3.85e-06 | 1.97e-06 | 69 |
| hsa05145111 | Esophagus | ESCC | Toxoplasmosis | 76/4205 | 112/8465 | 6.83e-05 | 2.90e-04 | 1.48e-04 | 76 |
| hsa04510111 | Esophagus | ESCC | Focal adhesion | 127/4205 | 203/8465 | 1.25e-04 | 4.99e-04 | 2.56e-04 | 127 |
| hsa0415114 | Esophagus | ESCC | PI3K-Akt signaling pathway | 197/4205 | 354/8465 | 1.24e-02 | 2.83e-02 | 1.45e-02 | 197 |
| hsa0451021 | Liver | Cirrhotic | Focal adhesion | 93/2530 | 203/8465 | 9.27e-07 | 1.10e-05 | 6.80e-06 | 93 |
| hsa05165 | Liver | Cirrhotic | Human papillomavirus infection | 124/2530 | 331/8465 | 1.55e-03 | 7.83e-03 | 4.83e-03 | 124 |
| Page: 1 2 3 |
Top |
Cell-cell communication analysis |
| Identification of potential cell-cell interactions between two cell types and their ligand-receptor pairs for different disease states |
| Ligand | Receptor | LRpair | Pathway | Tissue | Disease Stage |
| LAMA5 | ITGA1_ITGB1 | LAMA5_ITGA1_ITGB1 | LAMININ | Cervix | ADJ |
| LAMA5 | ITGA2_ITGB1 | LAMA5_ITGA2_ITGB1 | LAMININ | Cervix | ADJ |
| LAMA5 | ITGA3_ITGB1 | LAMA5_ITGA3_ITGB1 | LAMININ | Cervix | ADJ |
| LAMA5 | ITGA6_ITGB1 | LAMA5_ITGA6_ITGB1 | LAMININ | Cervix | ADJ |
| LAMA5 | ITGA7_ITGB1 | LAMA5_ITGA7_ITGB1 | LAMININ | Cervix | ADJ |
| LAMA5 | ITGAV_ITGB8 | LAMA5_ITGAV_ITGB8 | LAMININ | Cervix | ADJ |
| LAMA5 | ITGA6_ITGB4 | LAMA5_ITGA6_ITGB4 | LAMININ | Cervix | ADJ |
| LAMA5 | CD44 | LAMA5_CD44 | LAMININ | Cervix | ADJ |
| LAMA5 | ITGA1_ITGB1 | LAMA5_ITGA1_ITGB1 | LAMININ | Cervix | CC |
| LAMA5 | ITGA2_ITGB1 | LAMA5_ITGA2_ITGB1 | LAMININ | Cervix | CC |
| LAMA5 | ITGA3_ITGB1 | LAMA5_ITGA3_ITGB1 | LAMININ | Cervix | CC |
| LAMA5 | ITGA6_ITGB1 | LAMA5_ITGA6_ITGB1 | LAMININ | Cervix | CC |
| LAMA5 | ITGA7_ITGB1 | LAMA5_ITGA7_ITGB1 | LAMININ | Cervix | CC |
| LAMA5 | ITGA9_ITGB1 | LAMA5_ITGA9_ITGB1 | LAMININ | Cervix | CC |
| LAMA5 | ITGAV_ITGB8 | LAMA5_ITGAV_ITGB8 | LAMININ | Cervix | CC |
| LAMA5 | ITGA6_ITGB4 | LAMA5_ITGA6_ITGB4 | LAMININ | Cervix | CC |
| LAMA5 | CD44 | LAMA5_CD44 | LAMININ | Cervix | CC |
| LAMA5 | ITGA1_ITGB1 | LAMA5_ITGA1_ITGB1 | LAMININ | Cervix | Precancer |
| LAMA5 | ITGA3_ITGB1 | LAMA5_ITGA3_ITGB1 | LAMININ | Cervix | Precancer |
| LAMA5 | ITGA6_ITGB1 | LAMA5_ITGA6_ITGB1 | LAMININ | Cervix | Precancer |
| Page: 1 2 3 4 5 6 7 8 9 10 11 |
Top |
Single-cell gene regulatory network inference analysis |
| Find out the significant the regulons (TFs) and the target genes of each regulon across cell types for different disease states |
| TF | Cell Type | Tissue | Disease Stage | Target Gene | RSS | Regulon Activity |
| ∗The dot plots of a searched regulon are shown for all cell subpopulations in each disease state of each tissue based on the regulon specific score inferred using pySCENIC and by calculating the average expression. |
| Page: 1 |
Top |
Somatic mutation of malignant transformation related genes |
| Annotation of somatic variants for genes involved in malignant transformation |
| Hugo Symbol | Variant Class | Variant Classification | dbSNP RS | HGVSc | HGVSp | HGVSp Short | SWISSPROT | BIOTYPE | SIFT | PolyPhen | Tumor Sample Barcode | Tissue | Histology | Sex | Age | Stage | Therapy Types | Drugs | Outcome |
| LAMA5 | SNV | Missense_Mutation | novel | c.505C>G | p.Leu169Val | p.L169V | O15230 | protein_coding | deleterious(0) | possibly_damaging(0.559) | TCGA-A2-A4RW-01 | Breast | breast invasive carcinoma | Female | <65 | III/IV | Unknown | Unknown | SD |
| LAMA5 | SNV | Missense_Mutation | rs745963258 | c.2186G>T | p.Gly729Val | p.G729V | O15230 | protein_coding | deleterious(0) | probably_damaging(1) | TCGA-AO-A128-01 | Breast | breast invasive carcinoma | Female | <65 | I/II | Chemotherapy | doxorubicin | SD |
| LAMA5 | SNV | Missense_Mutation | rs745963258 | c.2186N>T | p.Gly729Val | p.G729V | O15230 | protein_coding | deleterious(0) | probably_damaging(1) | TCGA-AR-A0TQ-01 | Breast | breast invasive carcinoma | Female | <65 | III/IV | Chemotherapy | doxorubicin | SD |
| LAMA5 | SNV | Missense_Mutation | c.4897N>A | p.Ala1633Thr | p.A1633T | O15230 | protein_coding | deleterious(0.03) | possibly_damaging(0.634) | TCGA-AR-A0TW-01 | Breast | breast invasive carcinoma | Female | <65 | III/IV | Chemotherapy | doxorubicin | PD | |
| LAMA5 | SNV | Missense_Mutation | rs553907113 | c.7400N>T | p.Pro2467Leu | p.P2467L | O15230 | protein_coding | tolerated(0.06) | possibly_damaging(0.766) | TCGA-BH-A0B6-01 | Breast | breast invasive carcinoma | Female | <65 | I/II | Unknown | Unknown | SD |
| LAMA5 | SNV | Missense_Mutation | rs139977032 | c.1958N>A | p.Arg653His | p.R653H | O15230 | protein_coding | tolerated(0.45) | benign(0.011) | TCGA-BH-A0DL-01 | Breast | breast invasive carcinoma | Female | <65 | I/II | Chemotherapy | cytoxan | CR |
| LAMA5 | SNV | Missense_Mutation | rs745963258 | c.2186N>T | p.Gly729Val | p.G729V | O15230 | protein_coding | deleterious(0) | probably_damaging(1) | TCGA-BH-A0DQ-01 | Breast | breast invasive carcinoma | Female | <65 | I/II | Chemotherapy | doxorubicin | SD |
| LAMA5 | SNV | Missense_Mutation | c.4290N>G | p.Phe1430Leu | p.F1430L | O15230 | protein_coding | deleterious(0) | possibly_damaging(0.835) | TCGA-C8-A26V-01 | Breast | breast invasive carcinoma | Female | <65 | III/IV | Hormone Therapy | tamoxiphen | CR | |
| LAMA5 | SNV | Missense_Mutation | c.9707N>A | p.Pro3236Gln | p.P3236Q | O15230 | protein_coding | tolerated(0.5) | possibly_damaging(0.579) | TCGA-D8-A1JM-01 | Breast | breast invasive carcinoma | Female | <65 | I/II | ChemotherapyHormone Therapy | doxorubicine | SD | |
| LAMA5 | SNV | Missense_Mutation | c.3634N>A | p.Ala1212Thr | p.A1212T | O15230 | protein_coding | tolerated(1) | benign(0) | TCGA-D8-A1XK-01 | Breast | breast invasive carcinoma | Female | <65 | I/II | Chemotherapy | doxorubicine+cyclophosphamide | SD |
| Page: 1 2 3 4 5 6 7 8 9 10 11 12 13 14 15 16 17 18 19 20 21 22 23 24 25 26 27 28 |
Top |
Related drugs of malignant transformation related genes |
| Identification of chemicals and drugs interact with genes involved in malignant transfromation |
| (DGIdb 4.0) |
| Entrez ID | Symbol | Category | Interaction Types | Drug Claim Name | Drug Name | PMIDs |
| 3911 | LAMA5 | DRUGGABLE GENOME | CHEMBL2095222 | OCRIPLASMIN | ||
| 3911 | LAMA5 | DRUGGABLE GENOME | RBC | 9763582 |
| Page: 1 |

Copyright 2023-Present -The University of Texas Health Science Center at Houston |