
|
|||||
|
 | |
| |
| |
| |
| |
| |
|
Gene: LAMA4 |
Gene summary for LAMA4 |
| Gene information | Species | Human | Gene symbol | LAMA4 | Gene ID | 3910 |
| Gene name | laminin subunit alpha 4 | |
| Gene Alias | CMD1JJ | |
| Cytomap | 6q21 | |
| Gene Type | protein-coding | GO ID | GO:0001659 | UniProtAcc | A0A0A0MQS9 |
Top |
Malignant transformation analysis |
| Identification of the aberrant gene expression in precancerous and cancerous lesions by comparing the gene expression of stem-like cells in diseased tissues with normal stem cells |
| Entrez ID | Symbol | Replicates | Species | Organ | Tissue | Adj P-value | Log2FC | Malignancy |
| 3910 | LAMA4 | HCC1_Meng | Human | Liver | HCC | 1.20e-56 | 2.46e-01 | 0.0246 |
| 3910 | LAMA4 | cirrhotic3 | Human | Liver | Cirrhotic | 4.25e-05 | 1.93e-01 | 0.0215 |
| 3910 | LAMA4 | Pt13.b | Human | Liver | HCC | 3.57e-16 | 3.85e-01 | 0.0251 |
| 3910 | LAMA4 | S027 | Human | Liver | HCC | 2.20e-06 | 4.57e-01 | 0.2446 |
| 3910 | LAMA4 | S028 | Human | Liver | HCC | 5.52e-18 | 6.41e-01 | 0.2503 |
| 3910 | LAMA4 | S029 | Human | Liver | HCC | 3.88e-18 | 6.80e-01 | 0.2581 |
| 3910 | LAMA4 | C04 | Human | Oral cavity | OSCC | 2.84e-03 | -5.08e-01 | 0.2633 |
| 3910 | LAMA4 | C21 | Human | Oral cavity | OSCC | 1.13e-04 | -4.37e-01 | 0.2678 |
| 3910 | LAMA4 | C43 | Human | Oral cavity | OSCC | 1.54e-13 | -5.08e-01 | 0.1704 |
| 3910 | LAMA4 | C46 | Human | Oral cavity | OSCC | 3.17e-13 | -5.08e-01 | 0.1673 |
| 3910 | LAMA4 | C51 | Human | Oral cavity | OSCC | 7.28e-03 | -3.02e-01 | 0.2674 |
| 3910 | LAMA4 | C57 | Human | Oral cavity | OSCC | 5.78e-07 | -4.99e-01 | 0.1679 |
| 3910 | LAMA4 | C08 | Human | Oral cavity | OSCC | 2.80e-08 | -4.51e-01 | 0.1919 |
| 3910 | LAMA4 | C09 | Human | Oral cavity | OSCC | 8.99e-06 | -3.24e-01 | 0.1431 |
| 3910 | LAMA4 | LN46 | Human | Oral cavity | OSCC | 1.99e-05 | -5.08e-01 | 0.1666 |
| 3910 | LAMA4 | EOLP-1 | Human | Oral cavity | EOLP | 4.53e-02 | 2.17e-01 | -0.0202 |
| 3910 | LAMA4 | NEOLP-1 | Human | Oral cavity | NEOLP | 6.21e-07 | 4.41e-01 | -0.0194 |
| 3910 | LAMA4 | NEOLP-2 | Human | Oral cavity | NEOLP | 5.78e-06 | 4.36e-01 | -0.0196 |
| 3910 | LAMA4 | NEOLP-3 | Human | Oral cavity | NEOLP | 1.72e-10 | 4.76e-01 | -0.0191 |
| 3910 | LAMA4 | SYSMH1 | Human | Oral cavity | OSCC | 2.38e-16 | -5.06e-01 | 0.1127 |
| Page: 1 2 |
| Tissue | Expression Dynamics | Abbreviation |
| Liver | 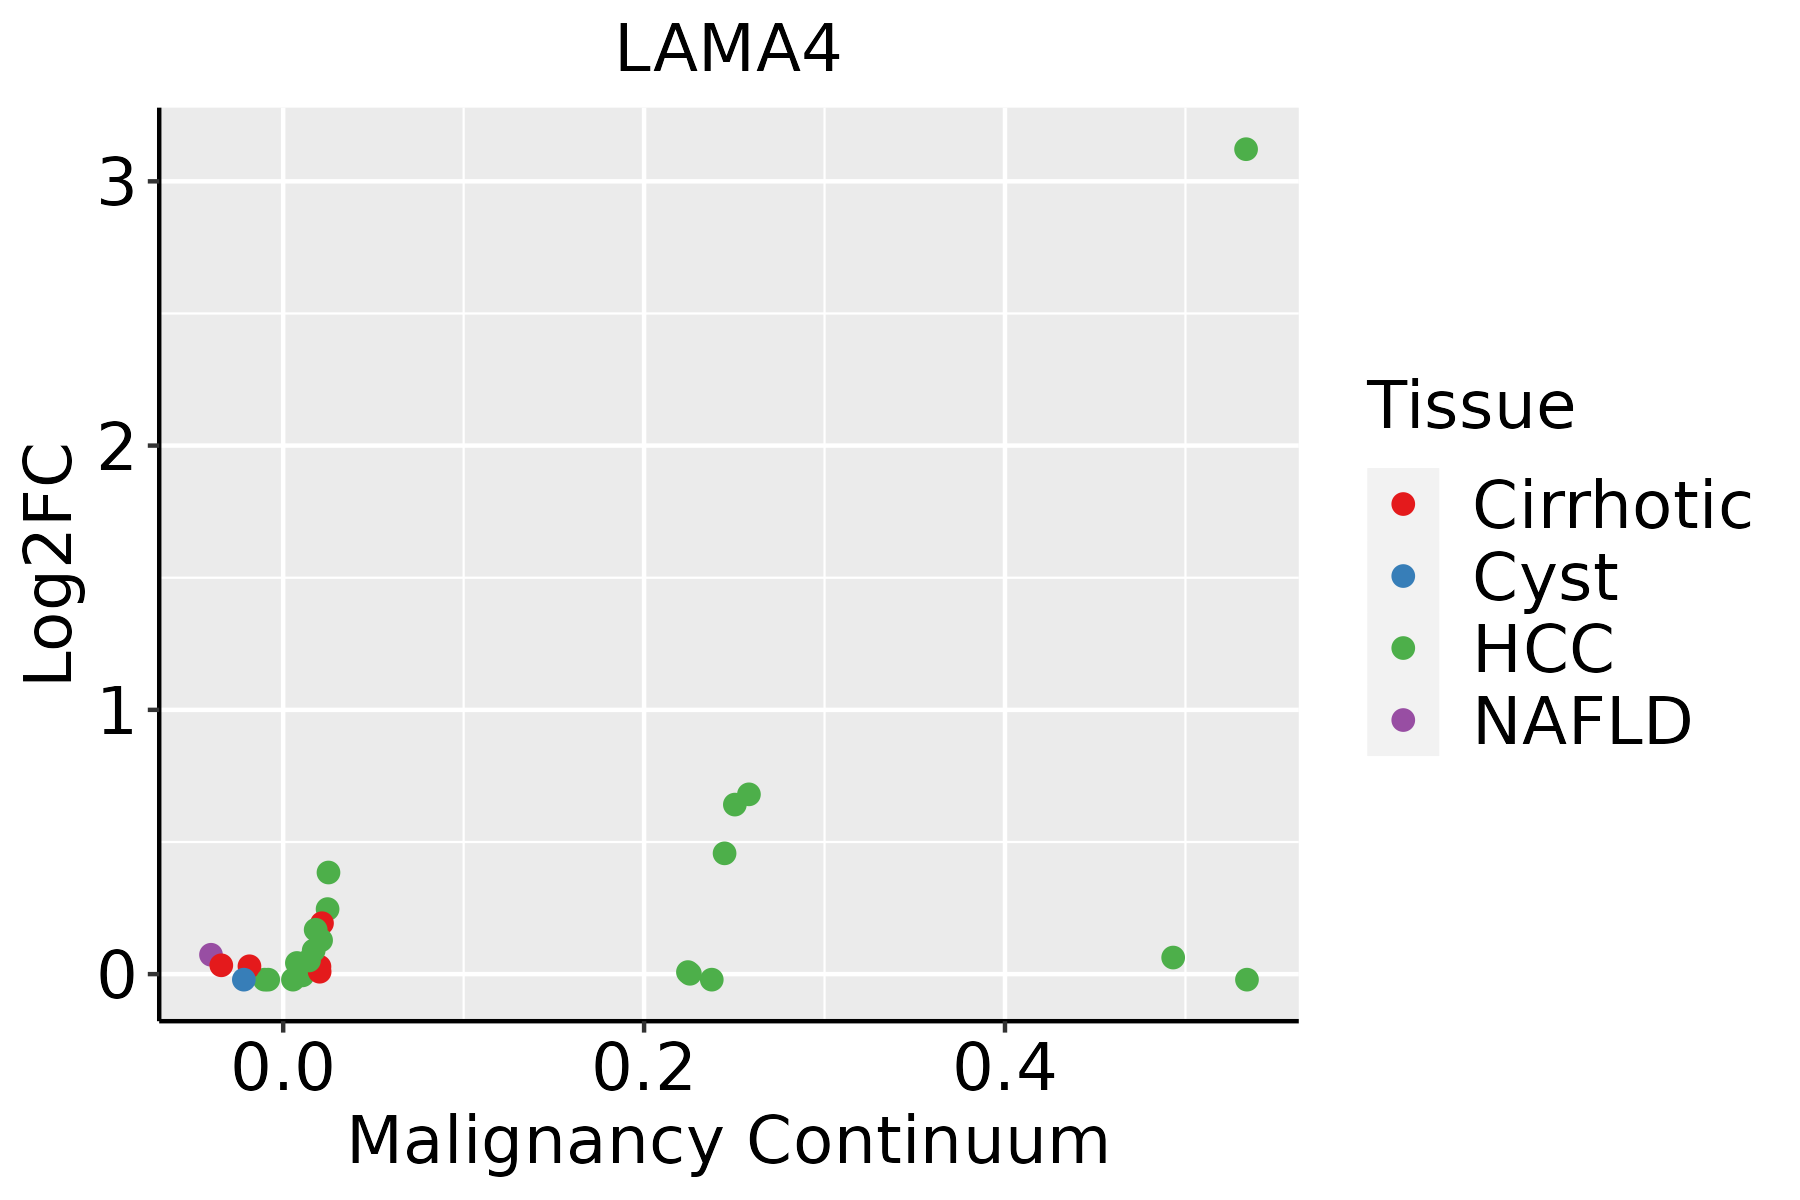 | HCC: Hepatocellular carcinoma |
| NAFLD: Non-alcoholic fatty liver disease | ||
| Oral Cavity | 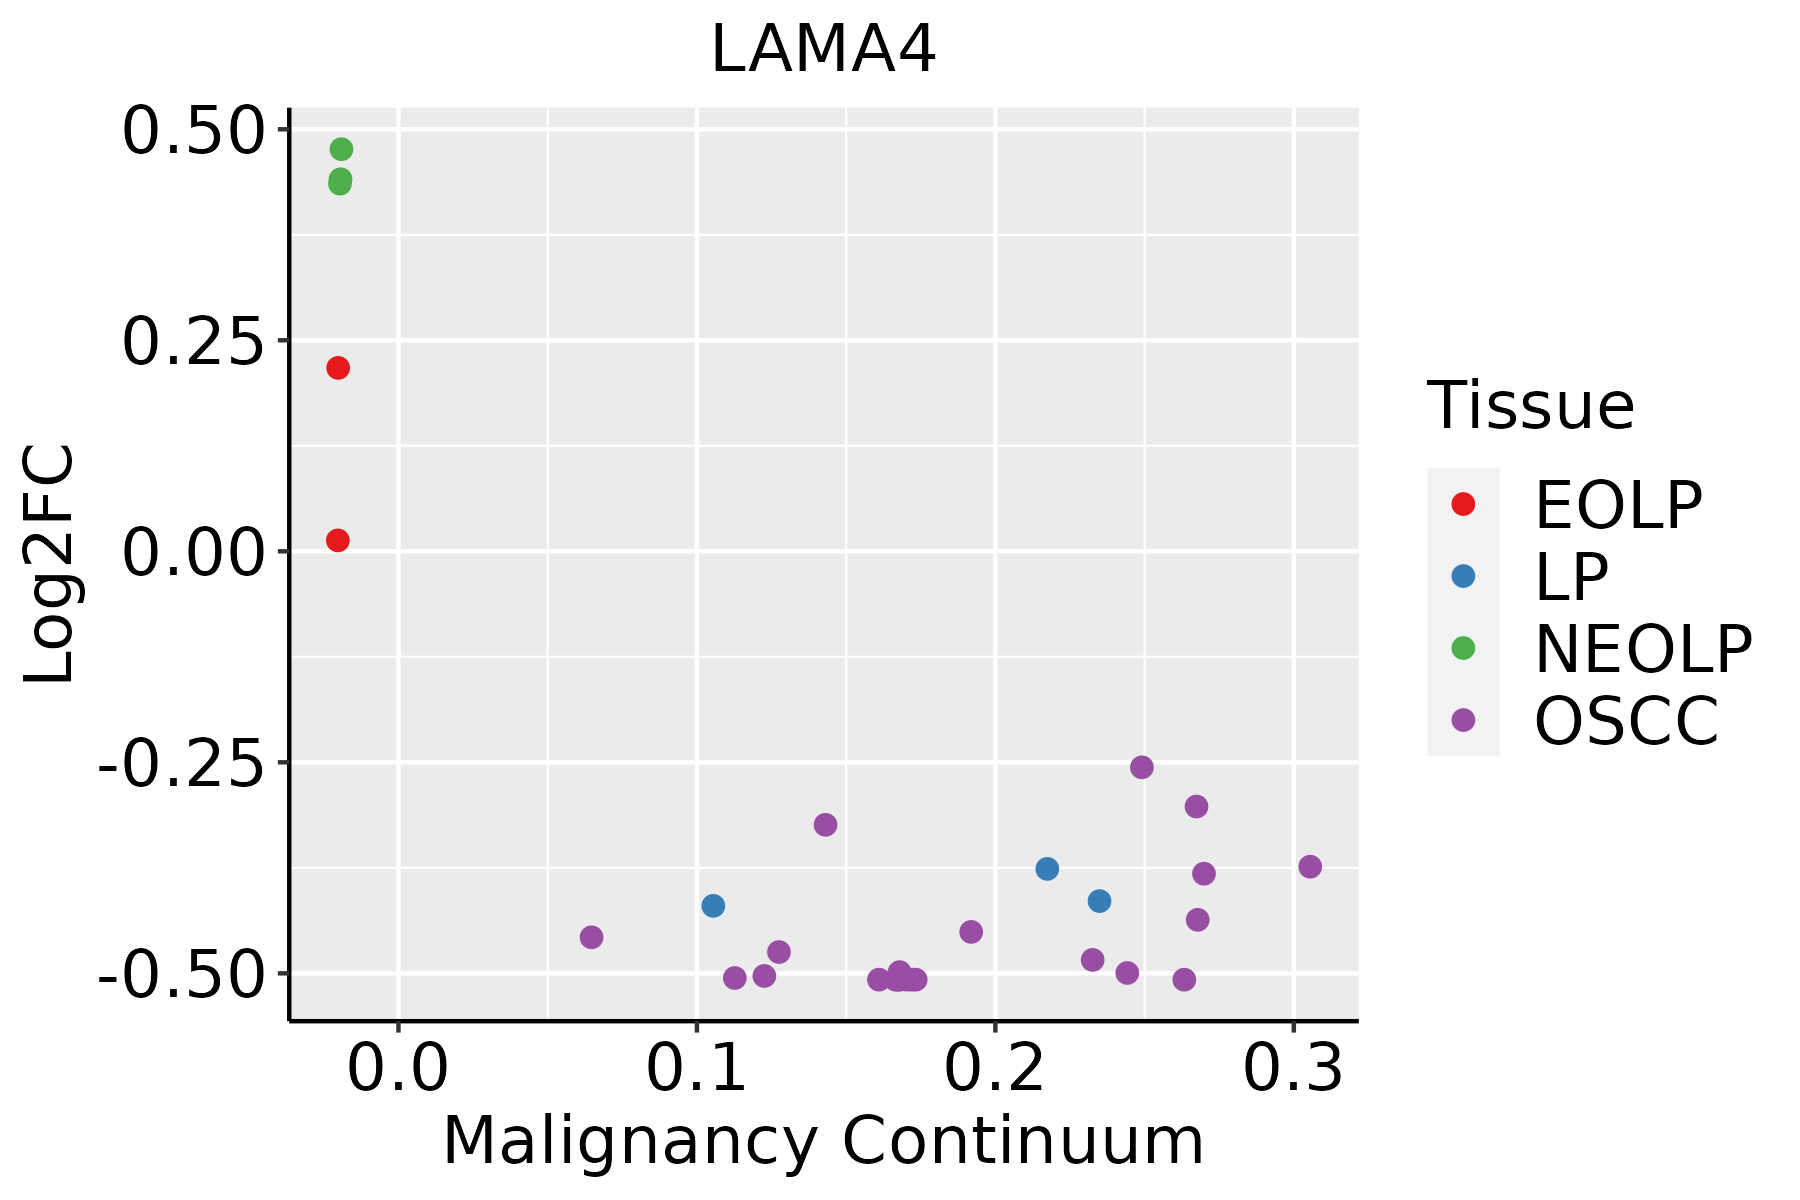 | EOLP: Erosive Oral lichen planus |
| LP: leukoplakia | ||
| NEOLP: Non-erosive oral lichen planus | ||
| OSCC: Oral squamous cell carcinoma | ||
| Thyroid | 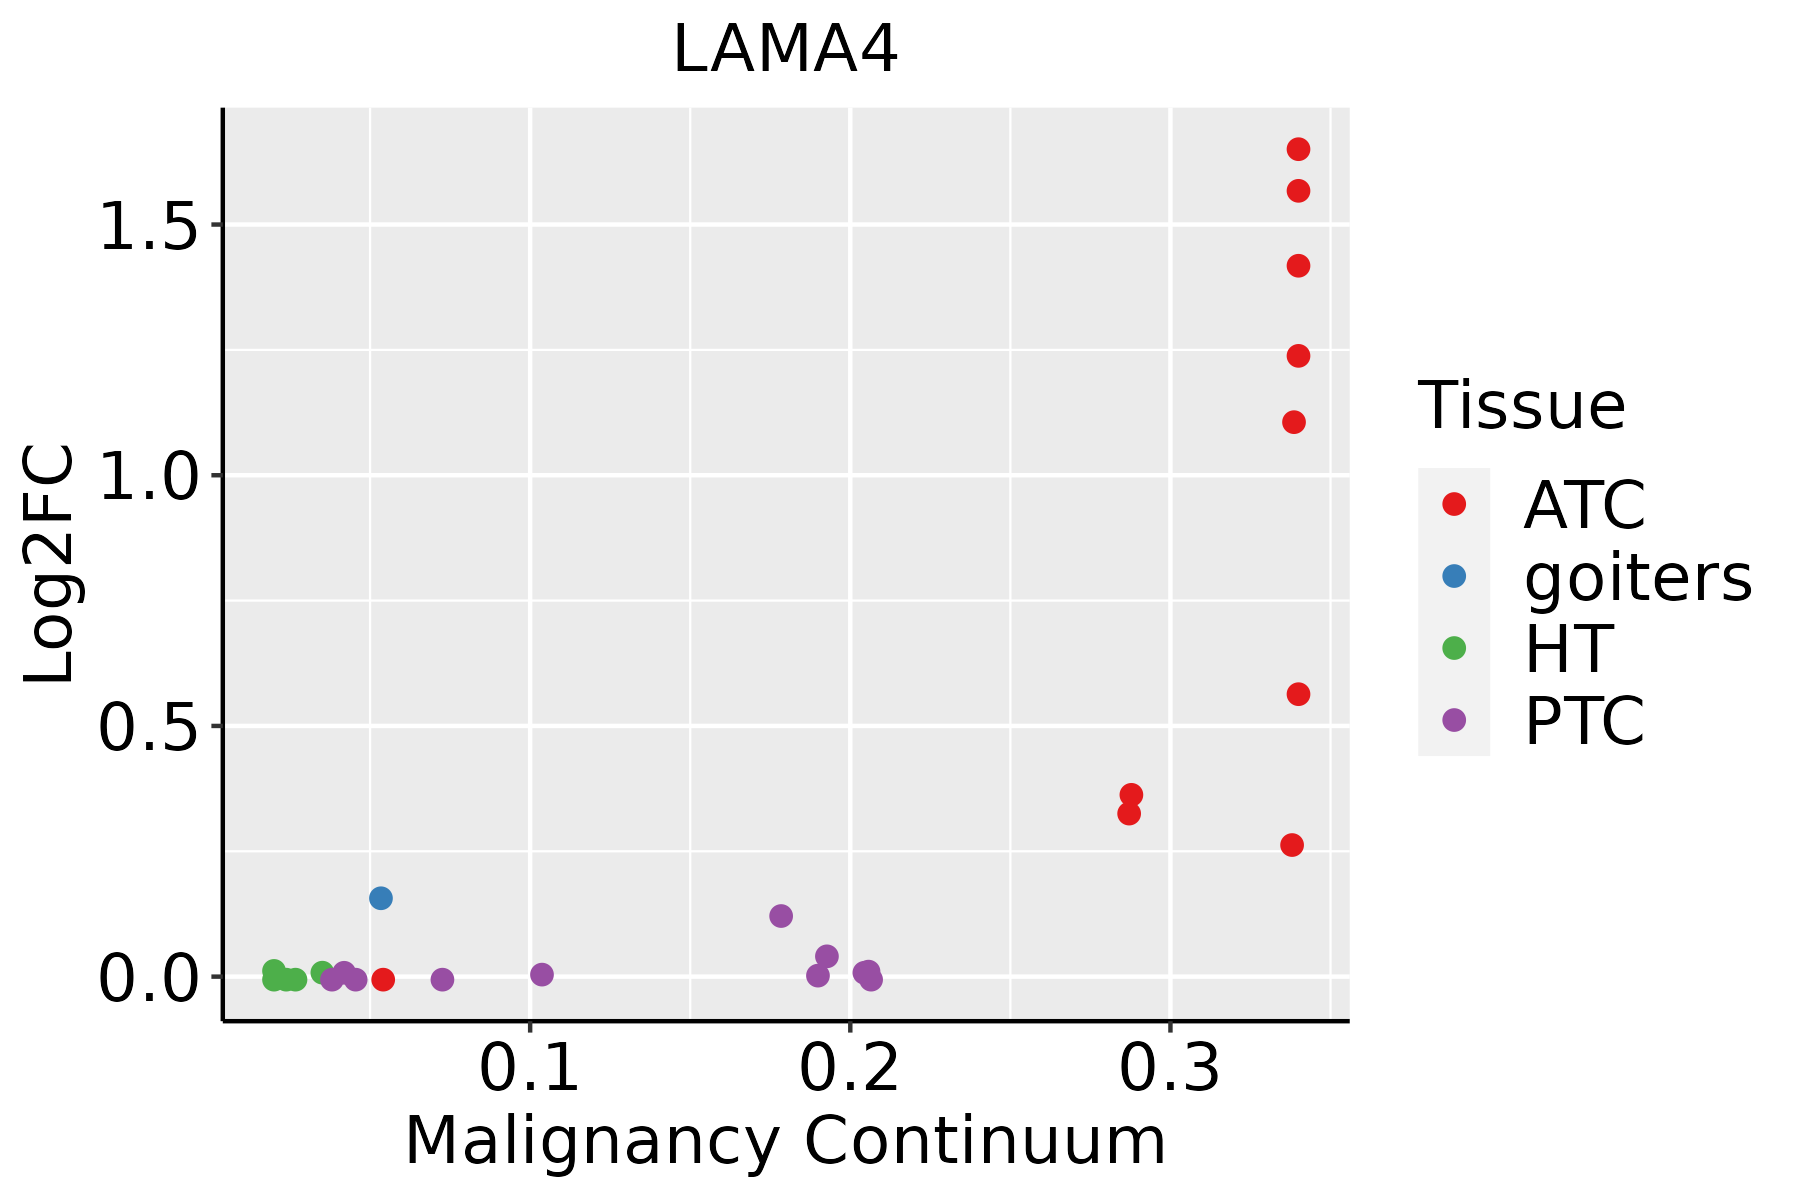 | ATC: Anaplastic thyroid cancer |
| HT: Hashimoto's thyroiditis | ||
| PTC: Papillary thyroid cancer |
| ∗log2FC in expression of this searched gene in stem-like cells from each diseased tissue sample relative to stem-like cells in normal samples in each tissue plotted against the malignancy continuum. Samples are colored based on if they are from different disease stage. |
Top |
Malignant transformation related pathway analysis |
| Find out the enriched GO biological processes and KEGG pathways involved in transition from healthy to precancer to cancer |
| Tissue | Disease Stage | Enriched GO biological Processes |
| Colorectum | AD |  |
| Colorectum | SER |  |
| Colorectum | MSS |  |
| Colorectum | MSI-H |  |
| Colorectum | FAP |  |
| ∗Top 15 enriched GO BP terms are showed in the bar plot of each disease state in each tissue. Each row represents a significant GO biological process which is colored according to the -log10(p.adjust). |
| Page: 1 2 3 4 5 6 7 8 9 |
| GO ID | Tissue | Disease Stage | Description | Gene Ratio | Bg Ratio | pvalue | p.adjust | Count |
| GO:010610611 | Liver | HCC | cold-induced thermogenesis | 76/7958 | 144/18723 | 8.07e-03 | 3.18e-02 | 76 |
| GO:012016111 | Liver | HCC | regulation of cold-induced thermogenesis | 76/7958 | 144/18723 | 8.07e-03 | 3.18e-02 | 76 |
| GO:199084511 | Liver | HCC | adaptive thermogenesis | 81/7958 | 157/18723 | 1.32e-02 | 4.72e-02 | 81 |
| GO:01061065 | Oral cavity | OSCC | cold-induced thermogenesis | 71/7305 | 144/18723 | 7.51e-03 | 2.75e-02 | 71 |
| GO:01201615 | Oral cavity | OSCC | regulation of cold-induced thermogenesis | 71/7305 | 144/18723 | 7.51e-03 | 2.75e-02 | 71 |
| GO:00016594 | Oral cavity | OSCC | temperature homeostasis | 84/7305 | 174/18723 | 7.84e-03 | 2.87e-02 | 84 |
| GO:19908454 | Oral cavity | OSCC | adaptive thermogenesis | 76/7305 | 157/18723 | 1.02e-02 | 3.52e-02 | 76 |
| GO:00459957 | Oral cavity | EOLP | regulation of embryonic development | 15/2218 | 64/18723 | 6.83e-03 | 3.32e-02 | 15 |
| GO:004599513 | Oral cavity | NEOLP | regulation of embryonic development | 18/2005 | 64/18723 | 9.10e-05 | 1.12e-03 | 18 |
| GO:000165911 | Oral cavity | NEOLP | temperature homeostasis | 30/2005 | 174/18723 | 5.83e-03 | 3.04e-02 | 30 |
| GO:199084512 | Oral cavity | NEOLP | adaptive thermogenesis | 27/2005 | 157/18723 | 8.87e-03 | 4.25e-02 | 27 |
| GO:0120163 | Oral cavity | NEOLP | negative regulation of cold-induced thermogenesis | 11/2005 | 47/18723 | 9.45e-03 | 4.47e-02 | 11 |
| GO:010610612 | Oral cavity | NEOLP | cold-induced thermogenesis | 25/2005 | 144/18723 | 1.02e-02 | 4.77e-02 | 25 |
| GO:012016112 | Oral cavity | NEOLP | regulation of cold-induced thermogenesis | 25/2005 | 144/18723 | 1.02e-02 | 4.77e-02 | 25 |
| GO:010610621 | Thyroid | ATC | cold-induced thermogenesis | 68/6293 | 144/18723 | 4.70e-04 | 2.76e-03 | 68 |
| GO:012016121 | Thyroid | ATC | regulation of cold-induced thermogenesis | 68/6293 | 144/18723 | 4.70e-04 | 2.76e-03 | 68 |
| GO:199084521 | Thyroid | ATC | adaptive thermogenesis | 71/6293 | 157/18723 | 1.59e-03 | 7.99e-03 | 71 |
| GO:000165912 | Thyroid | ATC | temperature homeostasis | 73/6293 | 174/18723 | 1.29e-02 | 4.51e-02 | 73 |
| Page: 1 |
| Pathway ID | Tissue | Disease Stage | Description | Gene Ratio | Bg Ratio | pvalue | p.adjust | qvalue | Count |
| hsa0451021 | Liver | Cirrhotic | Focal adhesion | 93/2530 | 203/8465 | 9.27e-07 | 1.10e-05 | 6.80e-06 | 93 |
| hsa0514512 | Liver | Cirrhotic | Toxoplasmosis | 47/2530 | 112/8465 | 4.16e-03 | 1.63e-02 | 1.00e-02 | 47 |
| hsa0451031 | Liver | Cirrhotic | Focal adhesion | 93/2530 | 203/8465 | 9.27e-07 | 1.10e-05 | 6.80e-06 | 93 |
| hsa0514513 | Liver | Cirrhotic | Toxoplasmosis | 47/2530 | 112/8465 | 4.16e-03 | 1.63e-02 | 1.00e-02 | 47 |
| hsa0451041 | Liver | HCC | Focal adhesion | 125/4020 | 203/8465 | 3.12e-05 | 1.88e-04 | 1.04e-04 | 125 |
| hsa051652 | Liver | HCC | Human papillomavirus infection | 188/4020 | 331/8465 | 3.34e-04 | 1.49e-03 | 8.29e-04 | 188 |
| hsa0514521 | Liver | HCC | Toxoplasmosis | 70/4020 | 112/8465 | 9.25e-04 | 3.52e-03 | 1.96e-03 | 70 |
| hsa052224 | Liver | HCC | Small cell lung cancer | 57/4020 | 92/8465 | 3.54e-03 | 1.12e-02 | 6.22e-03 | 57 |
| hsa0451051 | Liver | HCC | Focal adhesion | 125/4020 | 203/8465 | 3.12e-05 | 1.88e-04 | 1.04e-04 | 125 |
| hsa051653 | Liver | HCC | Human papillomavirus infection | 188/4020 | 331/8465 | 3.34e-04 | 1.49e-03 | 8.29e-04 | 188 |
| hsa0514531 | Liver | HCC | Toxoplasmosis | 70/4020 | 112/8465 | 9.25e-04 | 3.52e-03 | 1.96e-03 | 70 |
| hsa0522211 | Liver | HCC | Small cell lung cancer | 57/4020 | 92/8465 | 3.54e-03 | 1.12e-02 | 6.22e-03 | 57 |
| hsa051659 | Oral cavity | OSCC | Human papillomavirus infection | 200/3704 | 331/8465 | 3.83e-10 | 4.93e-09 | 2.51e-09 | 200 |
| hsa0451019 | Oral cavity | OSCC | Focal adhesion | 128/3704 | 203/8465 | 1.71e-08 | 1.63e-07 | 8.31e-08 | 128 |
| hsa052228 | Oral cavity | OSCC | Small cell lung cancer | 66/3704 | 92/8465 | 4.43e-08 | 3.38e-07 | 1.72e-07 | 66 |
| hsa0514520 | Oral cavity | OSCC | Toxoplasmosis | 75/3704 | 112/8465 | 5.28e-07 | 3.16e-06 | 1.61e-06 | 75 |
| hsa041516 | Oral cavity | OSCC | PI3K-Akt signaling pathway | 185/3704 | 354/8465 | 6.26e-04 | 1.86e-03 | 9.49e-04 | 185 |
| hsa051468 | Oral cavity | OSCC | Amoebiasis | 59/3704 | 102/8465 | 2.78e-03 | 7.17e-03 | 3.65e-03 | 59 |
| hsa0516514 | Oral cavity | OSCC | Human papillomavirus infection | 200/3704 | 331/8465 | 3.83e-10 | 4.93e-09 | 2.51e-09 | 200 |
| hsa04510110 | Oral cavity | OSCC | Focal adhesion | 128/3704 | 203/8465 | 1.71e-08 | 1.63e-07 | 8.31e-08 | 128 |
| Page: 1 2 3 |
Top |
Cell-cell communication analysis |
| Identification of potential cell-cell interactions between two cell types and their ligand-receptor pairs for different disease states |
| Ligand | Receptor | LRpair | Pathway | Tissue | Disease Stage |
| LAMA4 | ITGA1_ITGB1 | LAMA4_ITGA1_ITGB1 | LAMININ | Breast | ADJ |
| LAMA4 | ITGA2_ITGB1 | LAMA4_ITGA2_ITGB1 | LAMININ | Breast | ADJ |
| LAMA4 | CD44 | LAMA4_CD44 | LAMININ | Breast | ADJ |
| LAMA4 | ITGA1_ITGB1 | LAMA4_ITGA1_ITGB1 | LAMININ | Breast | DCIS |
| LAMA4 | ITGA2_ITGB1 | LAMA4_ITGA2_ITGB1 | LAMININ | Breast | DCIS |
| LAMA4 | ITGA6_ITGB1 | LAMA4_ITGA6_ITGB1 | LAMININ | Breast | DCIS |
| LAMA4 | ITGA7_ITGB1 | LAMA4_ITGA7_ITGB1 | LAMININ | Breast | DCIS |
| LAMA4 | ITGA6_ITGB4 | LAMA4_ITGA6_ITGB4 | LAMININ | Breast | DCIS |
| LAMA4 | CD44 | LAMA4_CD44 | LAMININ | Breast | DCIS |
| LAMA4 | DAG1 | LAMA4_DAG1 | LAMININ | Breast | DCIS |
| LAMA4 | ITGA1_ITGB1 | LAMA4_ITGA1_ITGB1 | LAMININ | Breast | Healthy |
| LAMA4 | ITGA2_ITGB1 | LAMA4_ITGA2_ITGB1 | LAMININ | Breast | Healthy |
| LAMA4 | ITGA6_ITGB1 | LAMA4_ITGA6_ITGB1 | LAMININ | Breast | Healthy |
| LAMA4 | ITGA7_ITGB1 | LAMA4_ITGA7_ITGB1 | LAMININ | Breast | Healthy |
| LAMA4 | ITGAV_ITGB8 | LAMA4_ITGAV_ITGB8 | LAMININ | Breast | Healthy |
| LAMA4 | CD44 | LAMA4_CD44 | LAMININ | Breast | Healthy |
| LAMA4 | ITGA1_ITGB1 | LAMA4_ITGA1_ITGB1 | LAMININ | Breast | IDC |
| LAMA4 | ITGA6_ITGB1 | LAMA4_ITGA6_ITGB1 | LAMININ | Breast | IDC |
| LAMA4 | CD44 | LAMA4_CD44 | LAMININ | Breast | IDC |
| LAMA4 | ITGA1_ITGB1 | LAMA4_ITGA1_ITGB1 | LAMININ | Breast | Precancer |
| Page: 1 2 3 4 5 6 7 8 9 10 11 12 13 14 15 16 17 |
Top |
Single-cell gene regulatory network inference analysis |
| Find out the significant the regulons (TFs) and the target genes of each regulon across cell types for different disease states |
| TF | Cell Type | Tissue | Disease Stage | Target Gene | RSS | Regulon Activity |
| ∗The dot plots of a searched regulon are shown for all cell subpopulations in each disease state of each tissue based on the regulon specific score inferred using pySCENIC and by calculating the average expression. |
| Page: 1 |
Top |
Somatic mutation of malignant transformation related genes |
| Annotation of somatic variants for genes involved in malignant transformation |
| Hugo Symbol | Variant Class | Variant Classification | dbSNP RS | HGVSc | HGVSp | HGVSp Short | SWISSPROT | BIOTYPE | SIFT | PolyPhen | Tumor Sample Barcode | Tissue | Histology | Sex | Age | Stage | Therapy Types | Drugs | Outcome |
| LAMA4 | SNV | Missense_Mutation | c.3848N>A | p.Ser1283Tyr | p.S1283Y | protein_coding | deleterious(0) | possibly_damaging(0.847) | TCGA-A2-A25A-01 | Breast | breast invasive carcinoma | Female | <65 | I/II | Unspecific | Cytoxan | SD | ||
| LAMA4 | SNV | Missense_Mutation | c.4880N>G | p.Ser1627Cys | p.S1627C | protein_coding | tolerated(0.14) | probably_damaging(0.967) | TCGA-A8-A06Q-01 | Breast | breast invasive carcinoma | Female | <65 | III/IV | Unknown | Unknown | SD | ||
| LAMA4 | SNV | Missense_Mutation | rs148801194 | c.640N>T | p.Arg214Cys | p.R214C | protein_coding | deleterious(0.02) | possibly_damaging(0.765) | TCGA-A8-A06X-01 | Breast | breast invasive carcinoma | Female | >=65 | I/II | Unknown | Unknown | SD | |
| LAMA4 | SNV | Missense_Mutation | novel | c.2828N>A | p.Gly943Glu | p.G943E | protein_coding | deleterious(0) | probably_damaging(0.996) | TCGA-A8-A079-01 | Breast | breast invasive carcinoma | Female | >=65 | III/IV | Chemotherapy | 5-fluorouracil | SD | |
| LAMA4 | SNV | Missense_Mutation | c.5293C>A | p.His1765Asn | p.H1765N | protein_coding | tolerated(0.34) | benign(0.022) | TCGA-AC-A23H-01 | Breast | breast invasive carcinoma | Female | >=65 | I/II | Unknown | Unknown | PD | ||
| LAMA4 | SNV | Missense_Mutation | c.4144G>C | p.Asp1382His | p.D1382H | protein_coding | deleterious(0) | probably_damaging(0.985) | TCGA-AC-A23H-01 | Breast | breast invasive carcinoma | Female | >=65 | I/II | Unknown | Unknown | PD | ||
| LAMA4 | SNV | Missense_Mutation | c.366C>G | p.Ile122Met | p.I122M | protein_coding | tolerated(0.12) | possibly_damaging(0.659) | TCGA-AC-A23H-01 | Breast | breast invasive carcinoma | Female | >=65 | I/II | Unknown | Unknown | PD | ||
| LAMA4 | SNV | Missense_Mutation | novel | c.428N>T | p.Ala143Val | p.A143V | protein_coding | deleterious(0) | probably_damaging(0.955) | TCGA-AC-A6IW-01 | Breast | breast invasive carcinoma | Female | >=65 | I/II | Unknown | Unknown | SD | |
| LAMA4 | SNV | Missense_Mutation | novel | c.427N>T | p.Ala143Ser | p.A143S | protein_coding | deleterious(0.02) | probably_damaging(0.947) | TCGA-AC-A6IW-01 | Breast | breast invasive carcinoma | Female | >=65 | I/II | Unknown | Unknown | SD | |
| LAMA4 | SNV | Missense_Mutation | c.1060G>A | p.Glu354Lys | p.E354K | protein_coding | tolerated(0.4) | benign(0.025) | TCGA-AN-A0FY-01 | Breast | breast invasive carcinoma | Female | <65 | I/II | Unknown | Unknown | SD |
| Page: 1 2 3 4 5 6 7 8 9 10 11 12 13 14 15 16 17 18 19 20 21 22 23 24 25 26 27 |
Top |
Related drugs of malignant transformation related genes |
| Identification of chemicals and drugs interact with genes involved in malignant transfromation |
| (DGIdb 4.0) |
| Entrez ID | Symbol | Category | Interaction Types | Drug Claim Name | Drug Name | PMIDs |
| 3910 | LAMA4 | DRUGGABLE GENOME | CHEMBL2095222 | OCRIPLASMIN |
| Page: 1 |

Copyright 2023-Present -The University of Texas Health Science Center at Houston |