
|
|||||
|
 | |
| |
| |
| |
| |
| |
|
Gene: LAMA3 |
Gene summary for LAMA3 |
| Gene information | Species | Human | Gene symbol | LAMA3 | Gene ID | 3909 |
| Gene name | laminin subunit alpha 3 | |
| Gene Alias | BM600 | |
| Cytomap | 18q11.2 | |
| Gene Type | protein-coding | GO ID | GO:0000902 | UniProtAcc | A0A0A6YYF2 |
Top |
Malignant transformation analysis |
| Identification of the aberrant gene expression in precancerous and cancerous lesions by comparing the gene expression of stem-like cells in diseased tissues with normal stem cells |
| Entrez ID | Symbol | Replicates | Species | Organ | Tissue | Adj P-value | Log2FC | Malignancy |
| 3909 | LAMA3 | CA_HPV_1 | Human | Cervix | CC | 2.31e-05 | -2.15e-01 | 0.0264 |
| 3909 | LAMA3 | CA_HPV_3 | Human | Cervix | CC | 2.97e-02 | 1.36e-01 | 0.0414 |
| 3909 | LAMA3 | HSIL_HPV_1 | Human | Cervix | HSIL_HPV | 1.65e-04 | -2.29e-01 | 0.0116 |
| 3909 | LAMA3 | CCI_1 | Human | Cervix | CC | 6.95e-07 | 8.05e-01 | 0.528 |
| 3909 | LAMA3 | CCI_3 | Human | Cervix | CC | 1.15e-09 | 9.08e-01 | 0.516 |
| 3909 | LAMA3 | T3 | Human | Cervix | CC | 2.30e-03 | 2.16e-01 | 0.1389 |
| 3909 | LAMA3 | HTA11_1938_2000001011 | Human | Colorectum | AD | 4.43e-16 | 9.01e-01 | -0.0811 |
| 3909 | LAMA3 | HTA11_78_2000001011 | Human | Colorectum | AD | 6.85e-06 | 4.65e-01 | -0.1088 |
| 3909 | LAMA3 | HTA11_347_2000001011 | Human | Colorectum | AD | 2.37e-02 | 2.84e-01 | -0.1954 |
| 3909 | LAMA3 | HTA11_866_2000001011 | Human | Colorectum | AD | 1.57e-03 | 2.69e-01 | -0.1001 |
| 3909 | LAMA3 | HTA11_1391_2000001011 | Human | Colorectum | AD | 1.30e-05 | 4.16e-01 | -0.059 |
| 3909 | LAMA3 | HTA11_10711_2000001011 | Human | Colorectum | AD | 5.94e-03 | 3.39e-01 | 0.0338 |
| 3909 | LAMA3 | HTA11_7696_3000711011 | Human | Colorectum | AD | 7.75e-11 | 4.69e-01 | 0.0674 |
| 3909 | LAMA3 | HTA11_6818_2000001011 | Human | Colorectum | AD | 4.01e-04 | 5.41e-01 | 0.0112 |
| 3909 | LAMA3 | A002-C-205 | Human | Colorectum | FAP | 3.84e-02 | 1.38e-01 | -0.1236 |
| 3909 | LAMA3 | LZE4T | Human | Esophagus | ESCC | 6.90e-03 | 3.28e-01 | 0.0811 |
| 3909 | LAMA3 | LZE8T | Human | Esophagus | ESCC | 4.12e-02 | 3.46e-01 | 0.067 |
| 3909 | LAMA3 | LZE24T | Human | Esophagus | ESCC | 2.99e-02 | 2.51e-01 | 0.0596 |
| 3909 | LAMA3 | P2T-E | Human | Esophagus | ESCC | 1.26e-10 | 2.67e-01 | 0.1177 |
| 3909 | LAMA3 | P4T-E | Human | Esophagus | ESCC | 4.73e-11 | 3.57e-01 | 0.1323 |
| Page: 1 2 3 4 5 6 7 |
| Tissue | Expression Dynamics | Abbreviation |
| Cervix | 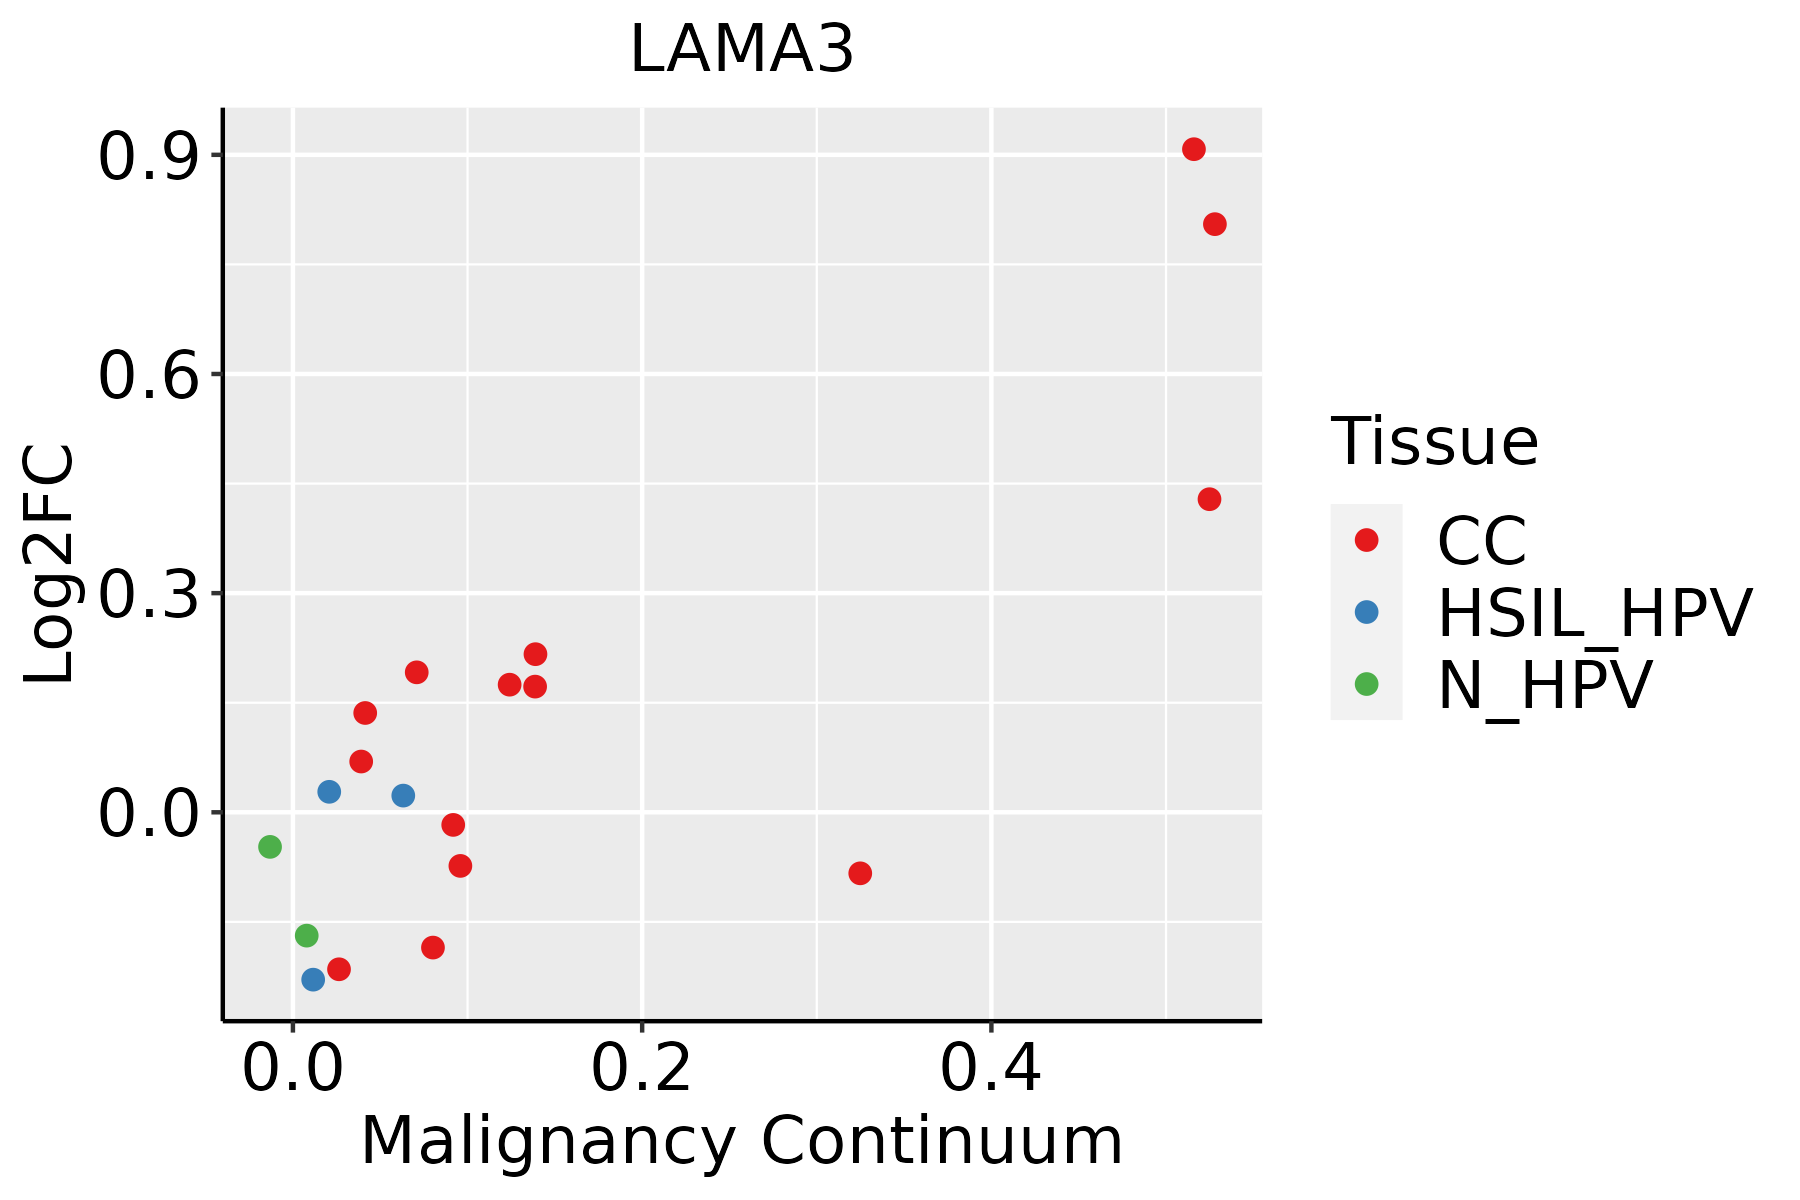 | CC: Cervix cancer |
| HSIL_HPV: HPV-infected high-grade squamous intraepithelial lesions | ||
| N_HPV: HPV-infected normal cervix | ||
| Colorectum (GSE201348) |  | FAP: Familial adenomatous polyposis |
| CRC: Colorectal cancer | ||
| Colorectum (HTA11) |  | AD: Adenomas |
| SER: Sessile serrated lesions | ||
| MSI-H: Microsatellite-high colorectal cancer | ||
| MSS: Microsatellite stable colorectal cancer | ||
| Esophagus |  | ESCC: Esophageal squamous cell carcinoma |
| HGIN: High-grade intraepithelial neoplasias | ||
| LGIN: Low-grade intraepithelial neoplasias | ||
| GC | 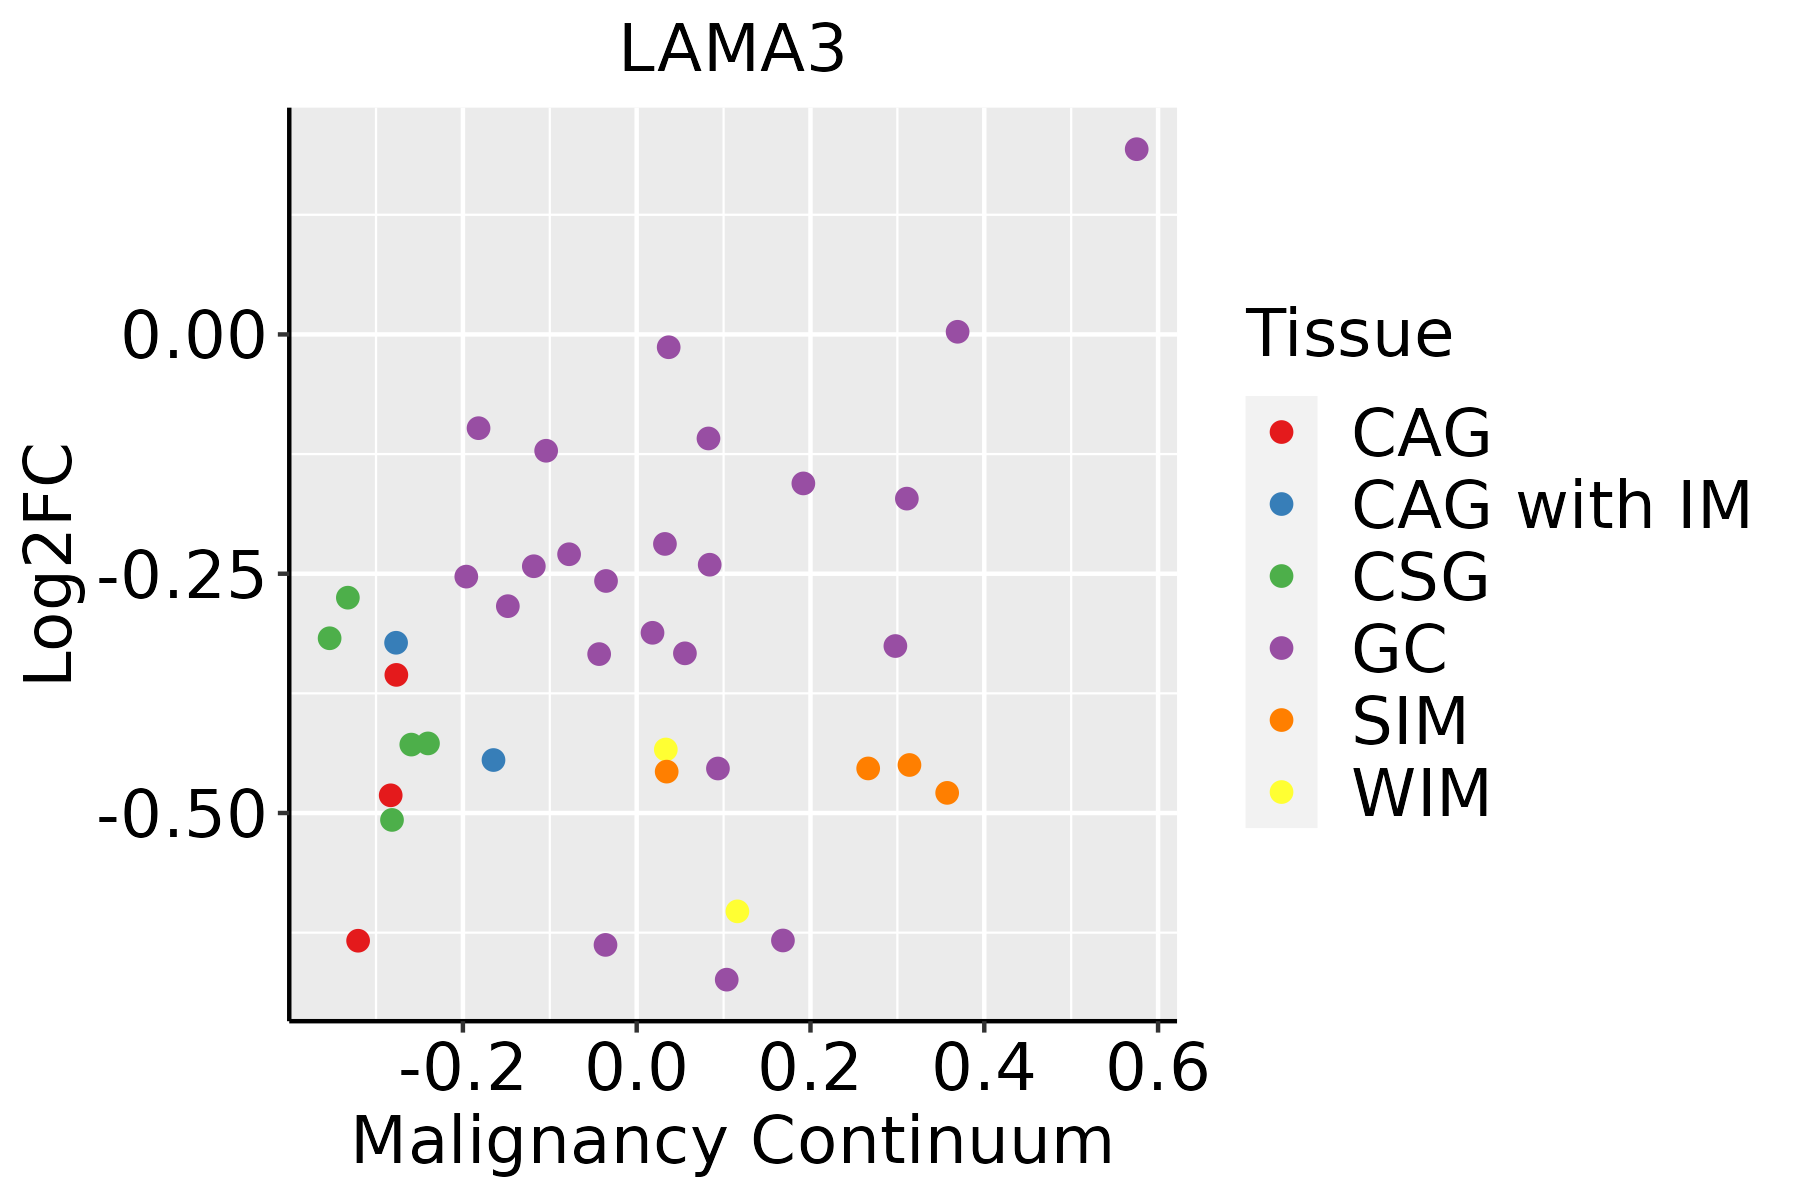 | CAG: Chronic atrophic gastritis |
| CAG with IM: Chronic atrophic gastritis with intestinal metaplasia | ||
| CSG: Chronic superficial gastritis | ||
| GC: Gastric cancer | ||
| SIM: Severe intestinal metaplasia | ||
| WIM: Wild intestinal metaplasia | ||
| Liver | 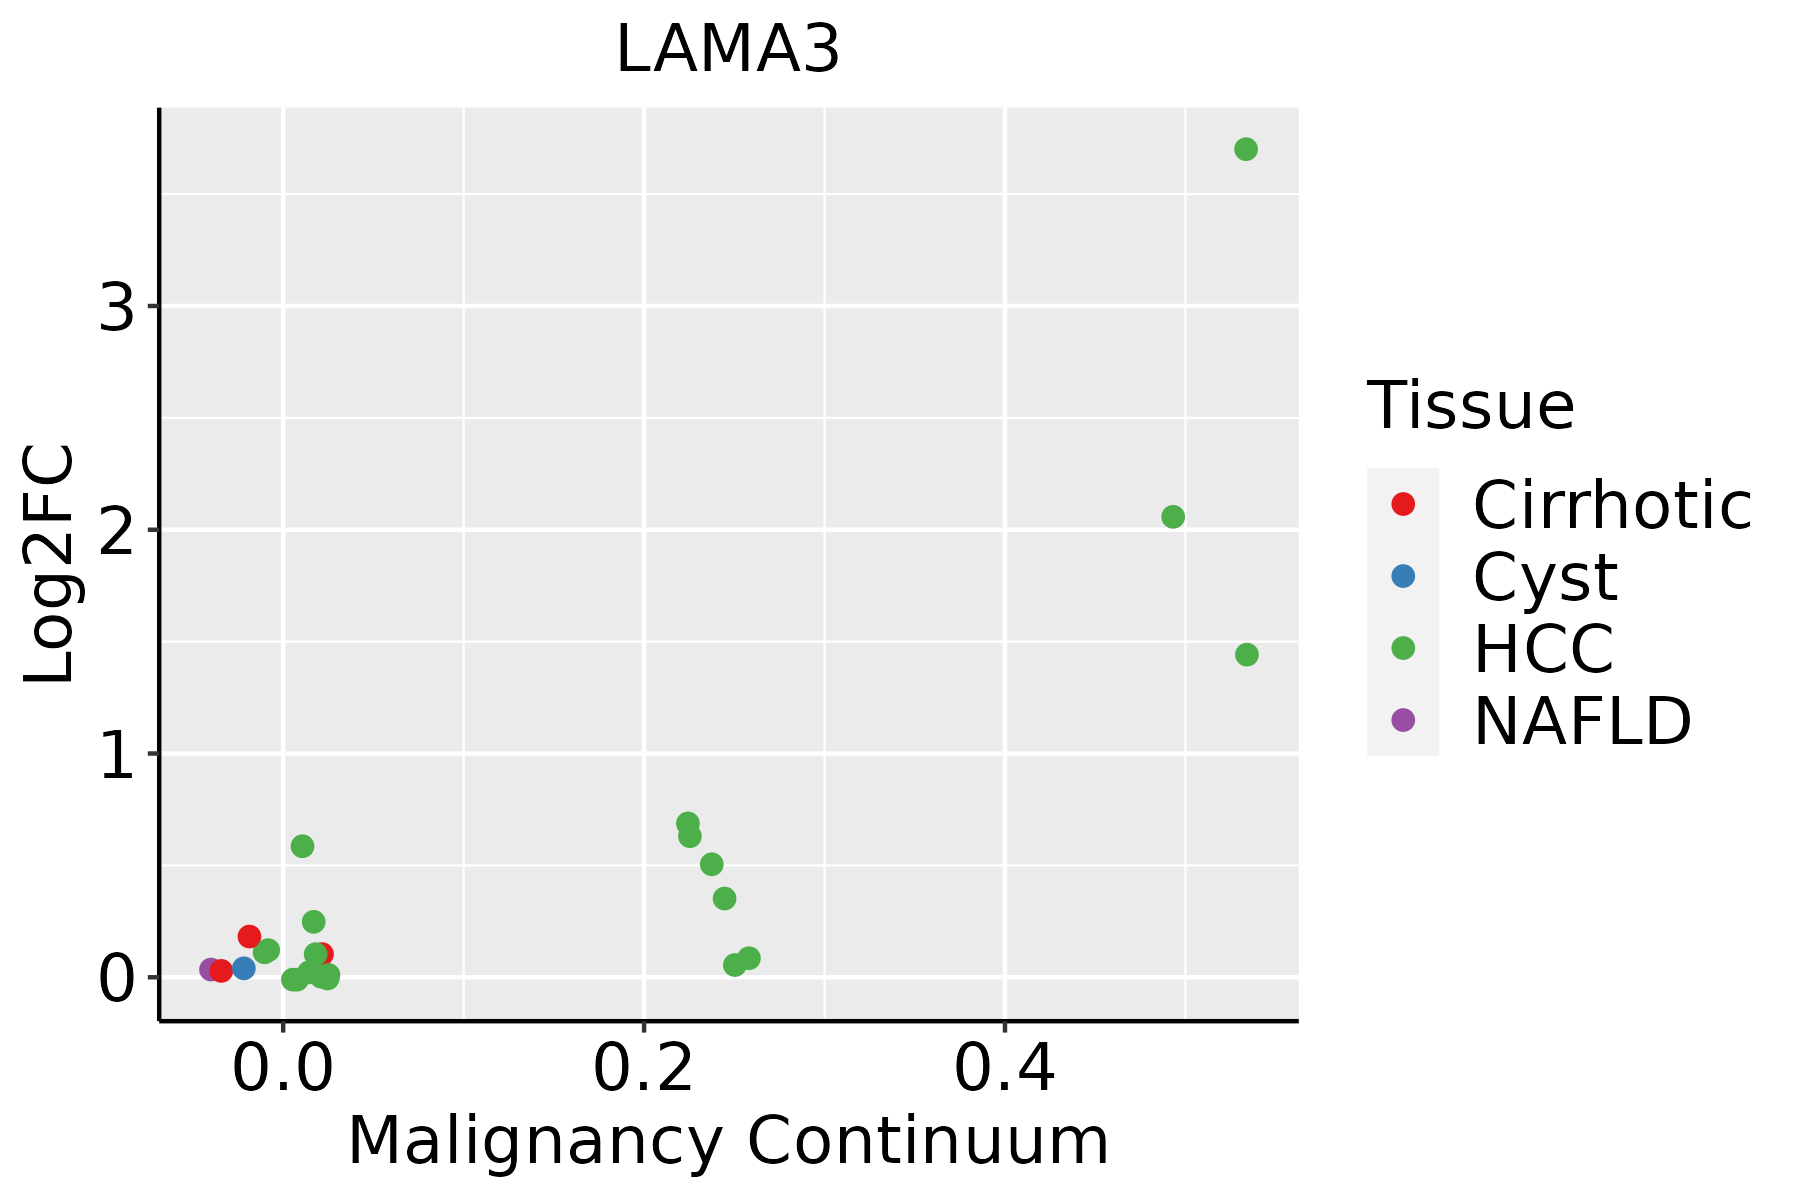 | HCC: Hepatocellular carcinoma |
| NAFLD: Non-alcoholic fatty liver disease | ||
| Lung |  | AAH: Atypical adenomatous hyperplasia |
| AIS: Adenocarcinoma in situ | ||
| IAC: Invasive lung adenocarcinoma | ||
| MIA: Minimally invasive adenocarcinoma | ||
| Oral Cavity | 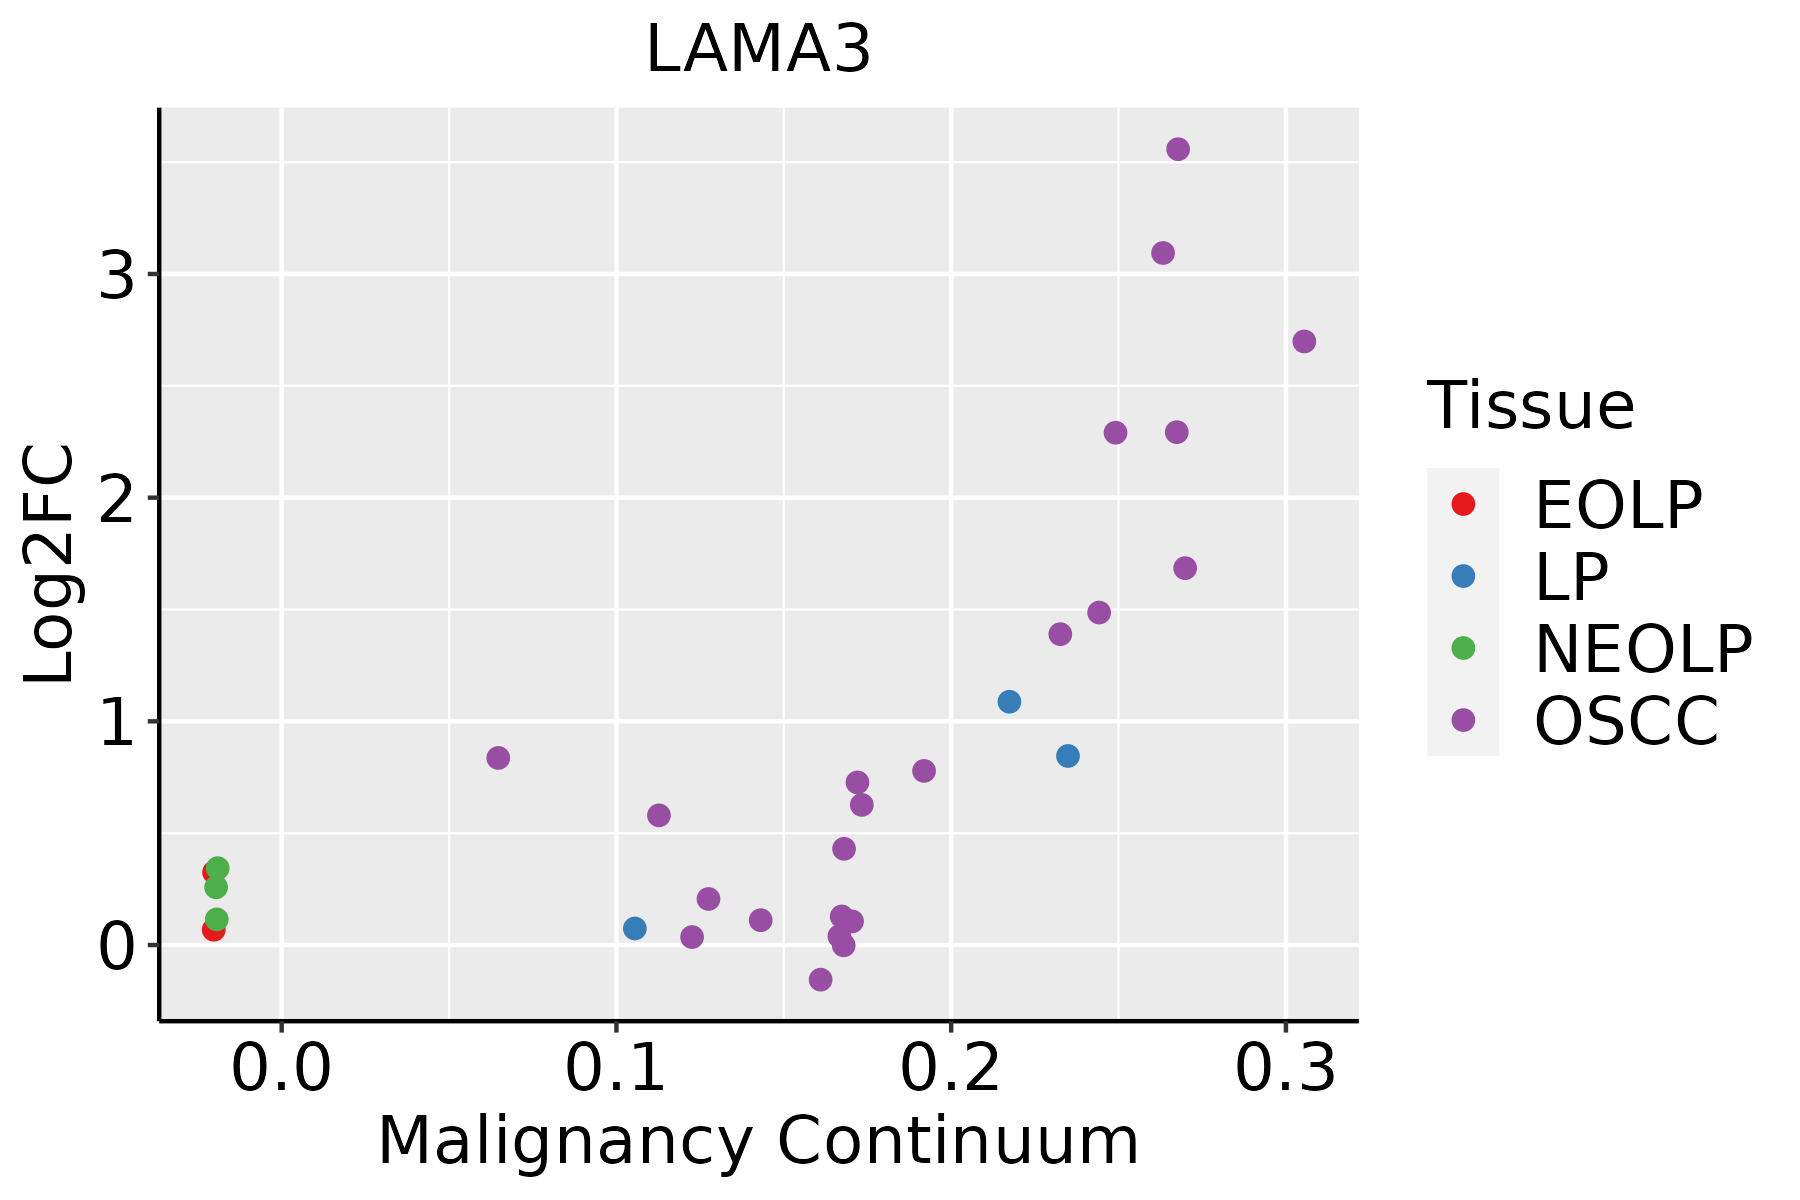 | EOLP: Erosive Oral lichen planus |
| LP: leukoplakia | ||
| NEOLP: Non-erosive oral lichen planus | ||
| OSCC: Oral squamous cell carcinoma | ||
| Skin | 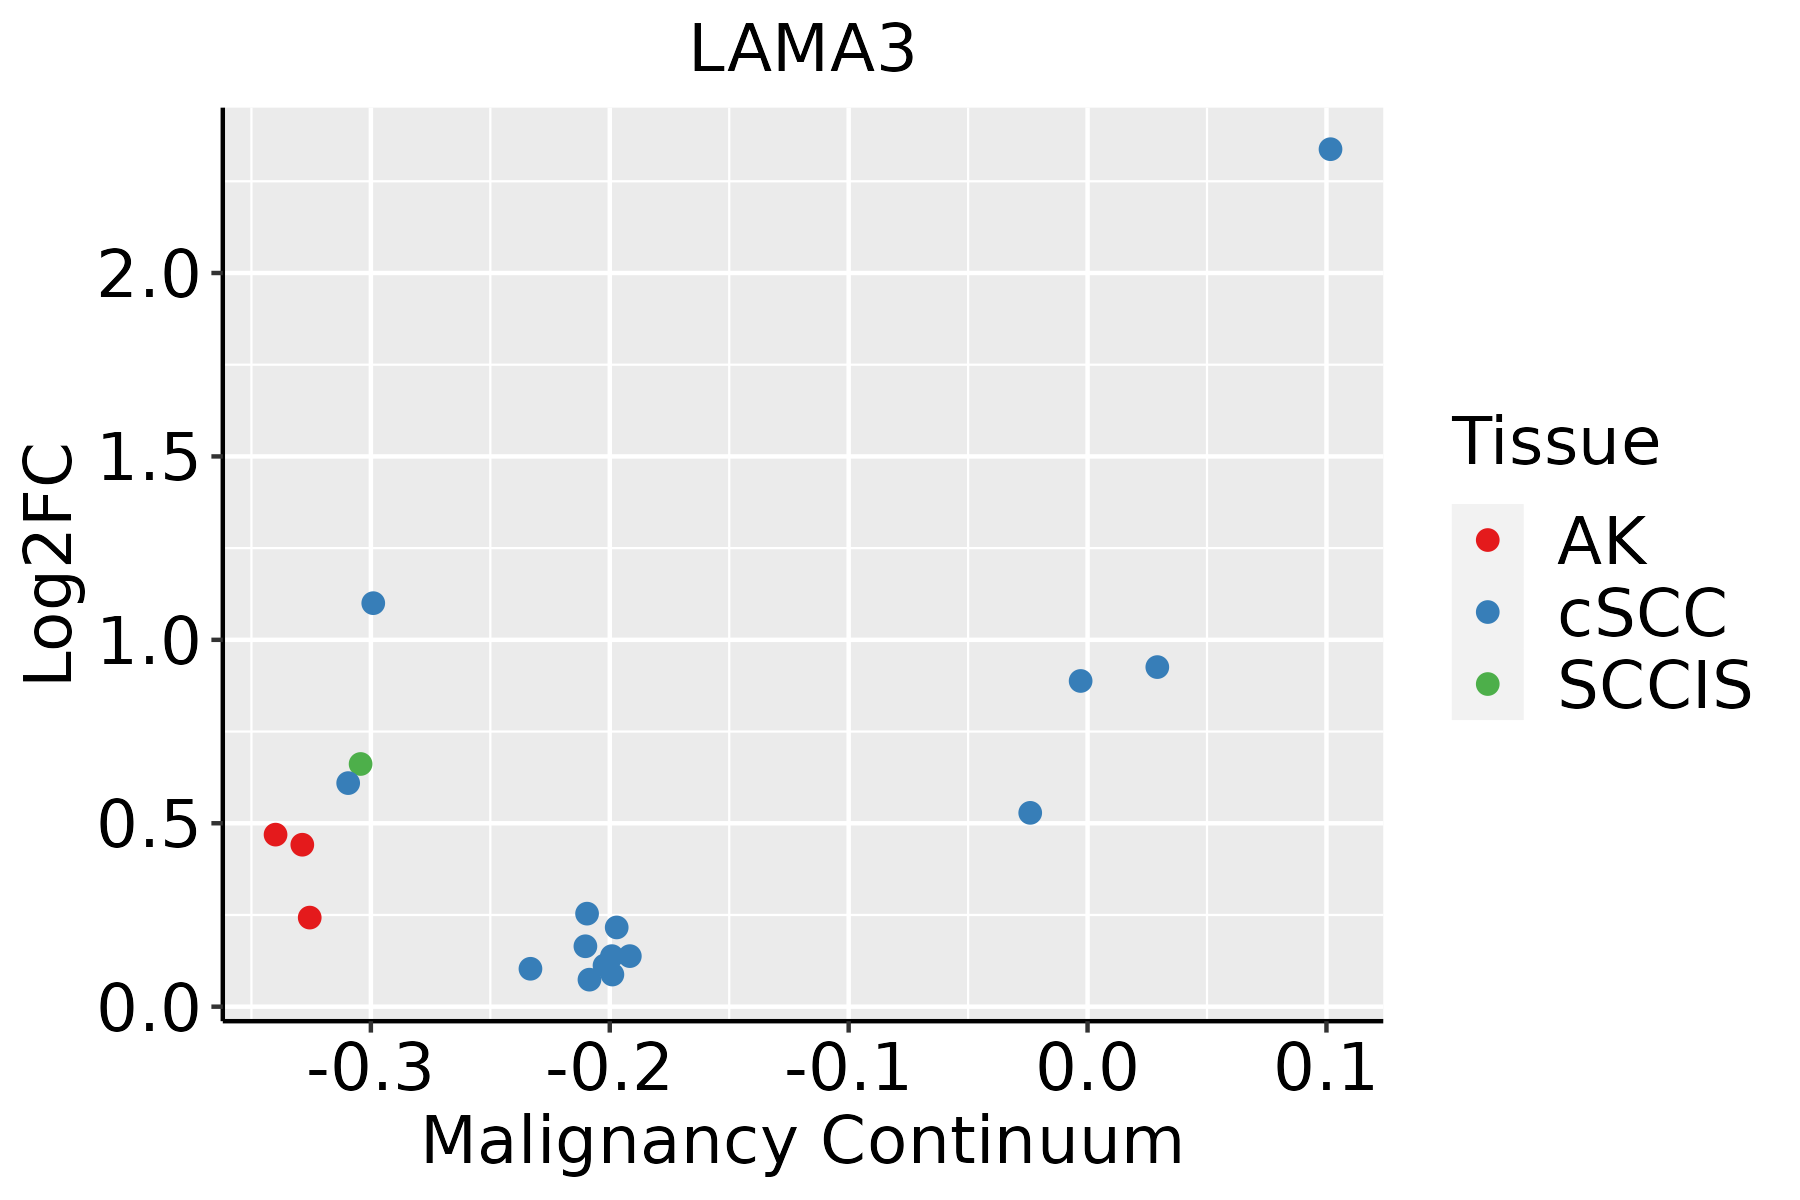 | AK: Actinic keratosis |
| cSCC: Cutaneous squamous cell carcinoma | ||
| SCCIS:squamous cell carcinoma in situ |
| ∗log2FC in expression of this searched gene in stem-like cells from each diseased tissue sample relative to stem-like cells in normal samples in each tissue plotted against the malignancy continuum. Samples are colored based on if they are from different disease stage. |
Top |
Malignant transformation related pathway analysis |
| Find out the enriched GO biological processes and KEGG pathways involved in transition from healthy to precancer to cancer |
| Tissue | Disease Stage | Enriched GO biological Processes |
| Colorectum | AD |  |
| Colorectum | SER |  |
| Colorectum | MSS |  |
| Colorectum | MSI-H |  |
| Colorectum | FAP |  |
| ∗Top 15 enriched GO BP terms are showed in the bar plot of each disease state in each tissue. Each row represents a significant GO biological process which is colored according to the -log10(p.adjust). |
| Page: 1 2 3 4 5 6 7 8 9 |
| GO ID | Tissue | Disease Stage | Description | Gene Ratio | Bg Ratio | pvalue | p.adjust | Count |
| GO:00085446 | Cervix | CC | epidermis development | 83/2311 | 324/18723 | 3.91e-11 | 8.54e-09 | 83 |
| GO:00072295 | Cervix | CC | integrin-mediated signaling pathway | 34/2311 | 107/18723 | 1.01e-07 | 5.25e-06 | 34 |
| GO:00615647 | Cervix | CC | axon development | 89/2311 | 467/18723 | 1.71e-05 | 3.27e-04 | 89 |
| GO:00073695 | Cervix | CC | gastrulation | 42/2311 | 185/18723 | 5.83e-05 | 8.46e-04 | 42 |
| GO:00074097 | Cervix | CC | axonogenesis | 78/2311 | 418/18723 | 1.14e-04 | 1.43e-03 | 78 |
| GO:00459955 | Cervix | CC | regulation of embryonic development | 19/2311 | 64/18723 | 1.78e-04 | 2.09e-03 | 19 |
| GO:00074923 | Cervix | CC | endoderm development | 20/2311 | 77/18723 | 8.40e-04 | 7.30e-03 | 20 |
| GO:0001704 | Cervix | CC | formation of primary germ layer | 27/2311 | 121/18723 | 1.49e-03 | 1.16e-02 | 27 |
| GO:00017384 | Cervix | CC | morphogenesis of a polarized epithelium | 22/2311 | 94/18723 | 2.09e-03 | 1.52e-02 | 22 |
| GO:000854413 | Cervix | HSIL_HPV | epidermis development | 38/737 | 324/18723 | 1.92e-09 | 3.23e-07 | 38 |
| GO:000722913 | Cervix | HSIL_HPV | integrin-mediated signaling pathway | 19/737 | 107/18723 | 3.37e-08 | 2.76e-06 | 19 |
| GO:00017041 | Cervix | HSIL_HPV | formation of primary germ layer | 13/737 | 121/18723 | 9.63e-04 | 1.20e-02 | 13 |
| GO:000736911 | Cervix | HSIL_HPV | gastrulation | 16/737 | 185/18723 | 2.71e-03 | 2.58e-02 | 16 |
| GO:0001706 | Cervix | HSIL_HPV | endoderm formation | 7/737 | 54/18723 | 5.04e-03 | 4.12e-02 | 7 |
| GO:0007409 | Colorectum | AD | axonogenesis | 122/3918 | 418/18723 | 3.36e-05 | 6.15e-04 | 122 |
| GO:0061564 | Colorectum | AD | axon development | 132/3918 | 467/18723 | 8.40e-05 | 1.31e-03 | 132 |
| GO:0045995 | Colorectum | AD | regulation of embryonic development | 24/3918 | 64/18723 | 1.72e-03 | 1.43e-02 | 24 |
| GO:0001738 | Colorectum | AD | morphogenesis of a polarized epithelium | 31/3918 | 94/18723 | 4.30e-03 | 2.95e-02 | 31 |
| GO:0007411 | Colorectum | AD | axon guidance | 64/3918 | 227/18723 | 5.41e-03 | 3.55e-02 | 64 |
| GO:0008544 | Colorectum | AD | epidermis development | 87/3918 | 324/18723 | 5.99e-03 | 3.76e-02 | 87 |
| Page: 1 2 3 4 5 6 |
| Pathway ID | Tissue | Disease Stage | Description | Gene Ratio | Bg Ratio | pvalue | p.adjust | qvalue | Count |
| hsa0451010 | Cervix | CC | Focal adhesion | 59/1267 | 203/8465 | 1.53e-07 | 1.84e-06 | 1.09e-06 | 59 |
| hsa0514514 | Cervix | CC | Toxoplasmosis | 34/1267 | 112/8465 | 2.42e-05 | 1.82e-04 | 1.08e-04 | 34 |
| hsa052226 | Cervix | CC | Small cell lung cancer | 29/1267 | 92/8465 | 4.38e-05 | 3.09e-04 | 1.83e-04 | 29 |
| hsa051657 | Cervix | CC | Human papillomavirus infection | 74/1267 | 331/8465 | 1.70e-04 | 1.02e-03 | 6.03e-04 | 74 |
| hsa051465 | Cervix | CC | Amoebiasis | 29/1267 | 102/8465 | 3.31e-04 | 1.70e-03 | 1.01e-03 | 29 |
| hsa0451014 | Cervix | CC | Focal adhesion | 59/1267 | 203/8465 | 1.53e-07 | 1.84e-06 | 1.09e-06 | 59 |
| hsa0514515 | Cervix | CC | Toxoplasmosis | 34/1267 | 112/8465 | 2.42e-05 | 1.82e-04 | 1.08e-04 | 34 |
| hsa0522213 | Cervix | CC | Small cell lung cancer | 29/1267 | 92/8465 | 4.38e-05 | 3.09e-04 | 1.83e-04 | 29 |
| hsa0516512 | Cervix | CC | Human papillomavirus infection | 74/1267 | 331/8465 | 1.70e-04 | 1.02e-03 | 6.03e-04 | 74 |
| hsa0514612 | Cervix | CC | Amoebiasis | 29/1267 | 102/8465 | 3.31e-04 | 1.70e-03 | 1.01e-03 | 29 |
| hsa0514522 | Cervix | HSIL_HPV | Toxoplasmosis | 22/459 | 112/8465 | 1.07e-07 | 3.14e-06 | 2.54e-06 | 22 |
| hsa0522222 | Cervix | HSIL_HPV | Small cell lung cancer | 13/459 | 92/8465 | 1.30e-03 | 9.51e-03 | 7.68e-03 | 13 |
| hsa045124 | Cervix | HSIL_HPV | ECM-receptor interaction | 12/459 | 89/8465 | 2.95e-03 | 1.88e-02 | 1.52e-02 | 12 |
| hsa0451023 | Cervix | HSIL_HPV | Focal adhesion | 21/459 | 203/8465 | 3.24e-03 | 2.02e-02 | 1.63e-02 | 21 |
| hsa0514532 | Cervix | HSIL_HPV | Toxoplasmosis | 22/459 | 112/8465 | 1.07e-07 | 3.14e-06 | 2.54e-06 | 22 |
| hsa0522232 | Cervix | HSIL_HPV | Small cell lung cancer | 13/459 | 92/8465 | 1.30e-03 | 9.51e-03 | 7.68e-03 | 13 |
| hsa0451211 | Cervix | HSIL_HPV | ECM-receptor interaction | 12/459 | 89/8465 | 2.95e-03 | 1.88e-02 | 1.52e-02 | 12 |
| hsa0451033 | Cervix | HSIL_HPV | Focal adhesion | 21/459 | 203/8465 | 3.24e-03 | 2.02e-02 | 1.63e-02 | 21 |
| hsa04510 | Colorectum | AD | Focal adhesion | 67/2092 | 203/8465 | 4.40e-03 | 2.17e-02 | 1.38e-02 | 67 |
| hsa045101 | Colorectum | AD | Focal adhesion | 67/2092 | 203/8465 | 4.40e-03 | 2.17e-02 | 1.38e-02 | 67 |
| Page: 1 2 3 4 5 6 |
Top |
Cell-cell communication analysis |
| Identification of potential cell-cell interactions between two cell types and their ligand-receptor pairs for different disease states |
| Ligand | Receptor | LRpair | Pathway | Tissue | Disease Stage |
| LAMA3 | ITGA1_ITGB1 | LAMA3_ITGA1_ITGB1 | LAMININ | Breast | DCIS |
| LAMA3 | ITGA2_ITGB1 | LAMA3_ITGA2_ITGB1 | LAMININ | Breast | DCIS |
| LAMA3 | ITGA6_ITGB1 | LAMA3_ITGA6_ITGB1 | LAMININ | Breast | DCIS |
| LAMA3 | ITGA7_ITGB1 | LAMA3_ITGA7_ITGB1 | LAMININ | Breast | DCIS |
| LAMA3 | ITGA6_ITGB4 | LAMA3_ITGA6_ITGB4 | LAMININ | Breast | DCIS |
| LAMA3 | CD44 | LAMA3_CD44 | LAMININ | Breast | DCIS |
| LAMA3 | DAG1 | LAMA3_DAG1 | LAMININ | Breast | DCIS |
| LAMA3 | ITGA1_ITGB1 | LAMA3_ITGA1_ITGB1 | LAMININ | Breast | Healthy |
| LAMA3 | ITGA2_ITGB1 | LAMA3_ITGA2_ITGB1 | LAMININ | Breast | Healthy |
| LAMA3 | ITGA6_ITGB1 | LAMA3_ITGA6_ITGB1 | LAMININ | Breast | Healthy |
| LAMA3 | ITGA7_ITGB1 | LAMA3_ITGA7_ITGB1 | LAMININ | Breast | Healthy |
| LAMA3 | ITGAV_ITGB8 | LAMA3_ITGAV_ITGB8 | LAMININ | Breast | Healthy |
| LAMA3 | CD44 | LAMA3_CD44 | LAMININ | Breast | Healthy |
| LAMA3 | ITGA1_ITGB1 | LAMA3_ITGA1_ITGB1 | LAMININ | Cervix | ADJ |
| LAMA3 | ITGA2_ITGB1 | LAMA3_ITGA2_ITGB1 | LAMININ | Cervix | ADJ |
| LAMA3 | ITGA3_ITGB1 | LAMA3_ITGA3_ITGB1 | LAMININ | Cervix | ADJ |
| LAMA3 | ITGA6_ITGB1 | LAMA3_ITGA6_ITGB1 | LAMININ | Cervix | ADJ |
| LAMA3 | ITGA7_ITGB1 | LAMA3_ITGA7_ITGB1 | LAMININ | Cervix | ADJ |
| LAMA3 | ITGAV_ITGB8 | LAMA3_ITGAV_ITGB8 | LAMININ | Cervix | ADJ |
| LAMA3 | ITGA6_ITGB4 | LAMA3_ITGA6_ITGB4 | LAMININ | Cervix | ADJ |
| Page: 1 2 3 4 5 6 7 8 9 10 11 12 13 |
Top |
Single-cell gene regulatory network inference analysis |
| Find out the significant the regulons (TFs) and the target genes of each regulon across cell types for different disease states |
| TF | Cell Type | Tissue | Disease Stage | Target Gene | RSS | Regulon Activity |
| ∗The dot plots of a searched regulon are shown for all cell subpopulations in each disease state of each tissue based on the regulon specific score inferred using pySCENIC and by calculating the average expression. |
| Page: 1 |
Top |
Somatic mutation of malignant transformation related genes |
| Annotation of somatic variants for genes involved in malignant transformation |
| Hugo Symbol | Variant Class | Variant Classification | dbSNP RS | HGVSc | HGVSp | HGVSp Short | SWISSPROT | BIOTYPE | SIFT | PolyPhen | Tumor Sample Barcode | Tissue | Histology | Sex | Age | Stage | Therapy Types | Drugs | Outcome |
| LAMA3 | SNV | Missense_Mutation | c.9901N>A | p.Gly3301Ser | p.G3301S | Q16787 | protein_coding | deleterious(0) | probably_damaging(1) | TCGA-A1-A0SK-01 | Breast | breast invasive carcinoma | Female | <65 | I/II | Unknown | Unknown | PD | |
| LAMA3 | SNV | Missense_Mutation | rs756402937 | c.9533N>T | p.Pro3178Leu | p.P3178L | Q16787 | protein_coding | tolerated(1) | probably_damaging(0.925) | TCGA-A2-A04U-01 | Breast | breast invasive carcinoma | Female | <65 | I/II | Chemotherapy | adriamycin | SD |
| LAMA3 | SNV | Missense_Mutation | rs763626668 | c.4558N>T | p.Ala1520Ser | p.A1520S | Q16787 | protein_coding | deleterious(0.03) | possibly_damaging(0.458) | TCGA-A2-A0CU-01 | Breast | breast invasive carcinoma | Female | >=65 | I/II | Hormone Therapy | tamoxiphen | SD |
| LAMA3 | SNV | Missense_Mutation | c.1510N>A | p.Asp504Asn | p.D504N | Q16787 | protein_coding | deleterious(0.05) | benign(0.059) | TCGA-A8-A08F-01 | Breast | breast invasive carcinoma | Female | <65 | III/IV | Chemotherapy | 5-fluorouracil | CR | |
| LAMA3 | SNV | Missense_Mutation | c.8153G>A | p.Gly2718Glu | p.G2718E | Q16787 | protein_coding | deleterious(0) | probably_damaging(1) | TCGA-AC-A23H-01 | Breast | breast invasive carcinoma | Female | >=65 | I/II | Unknown | Unknown | PD | |
| LAMA3 | SNV | Missense_Mutation | novel | c.727N>G | p.Phe243Val | p.F243V | Q16787 | protein_coding | deleterious(0.02) | benign(0.111) | TCGA-AN-A046-01 | Breast | breast invasive carcinoma | Female | >=65 | I/II | Unknown | Unknown | SD |
| LAMA3 | SNV | Missense_Mutation | rs759912753 | c.5580G>A | p.Met1860Ile | p.M1860I | Q16787 | protein_coding | tolerated(0.27) | benign(0.007) | TCGA-AR-A0TX-01 | Breast | breast invasive carcinoma | Female | <65 | I/II | Unknown | Unknown | SD |
| LAMA3 | SNV | Missense_Mutation | c.4793G>A | p.Arg1598His | p.R1598H | Q16787 | protein_coding | tolerated(0.13) | benign(0.009) | TCGA-AR-A1AY-01 | Breast | breast invasive carcinoma | Female | >=65 | I/II | Unspecific | Doxorubicin | SD | |
| LAMA3 | SNV | Missense_Mutation | novel | c.4450G>C | p.Glu1484Gln | p.E1484Q | Q16787 | protein_coding | tolerated(0.06) | benign(0.312) | TCGA-C8-A8HQ-01 | Breast | breast invasive carcinoma | Female | <65 | I/II | Unknown | Unknown | SD |
| LAMA3 | SNV | Missense_Mutation | rs774924039 | c.6700C>A | p.Gln2234Lys | p.Q2234K | Q16787 | protein_coding | tolerated(0.16) | benign(0.024) | TCGA-D8-A145-01 | Breast | breast invasive carcinoma | Female | >=65 | I/II | Hormone Therapy | tamoxiphen | SD |
| Page: 1 2 3 4 5 6 7 8 9 10 11 12 13 14 15 16 17 18 19 20 21 22 23 24 25 26 27 28 29 30 |
Top |
Related drugs of malignant transformation related genes |
| Identification of chemicals and drugs interact with genes involved in malignant transfromation |
| (DGIdb 4.0) |
| Entrez ID | Symbol | Category | Interaction Types | Drug Claim Name | Drug Name | PMIDs |
| 3909 | LAMA3 | DRUGGABLE GENOME | CHEMBL2095222 | OCRIPLASMIN |
| Page: 1 |

Copyright 2023-Present -The University of Texas Health Science Center at Houston |