
|
|||||
|
 | |
| |
| |
| |
| |
| |
|
Gene: LAMA2 |
Gene summary for LAMA2 |
| Gene information | Species | Human | Gene symbol | LAMA2 | Gene ID | 3908 |
| Gene name | laminin subunit alpha 2 | |
| Gene Alias | LAMM | |
| Cytomap | 6q22.33 | |
| Gene Type | protein-coding | GO ID | GO:0000902 | UniProtAcc | P24043 |
Top |
Malignant transformation analysis |
| Identification of the aberrant gene expression in precancerous and cancerous lesions by comparing the gene expression of stem-like cells in diseased tissues with normal stem cells |
| Entrez ID | Symbol | Replicates | Species | Organ | Tissue | Adj P-value | Log2FC | Malignancy |
| 3908 | LAMA2 | HTA11_1938_2000001011 | Human | Colorectum | AD | 9.77e-03 | 1.74e-01 | -0.0811 |
| 3908 | LAMA2 | HTA11_78_2000001011 | Human | Colorectum | AD | 2.87e-04 | 1.85e-01 | -0.1088 |
| 3908 | LAMA2 | HTA11_347_2000001011 | Human | Colorectum | AD | 1.84e-03 | 1.70e-01 | -0.1954 |
| 3908 | LAMA2 | HTA11_1391_2000001011 | Human | Colorectum | AD | 6.02e-03 | 1.60e-01 | -0.059 |
| 3908 | LAMA2 | HTA11_10711_2000001011 | Human | Colorectum | AD | 2.21e-02 | 2.41e-01 | 0.0338 |
| 3908 | LAMA2 | HTA11_6818_2000001021 | Human | Colorectum | AD | 4.82e-02 | 1.72e-01 | 0.0588 |
| 3908 | LAMA2 | A001-C-007 | Human | Colorectum | CRC | 1.31e-11 | 6.41e-01 | 0.1899 |
| 3908 | LAMA2 | CRC-1-8810 | Human | Colorectum | CRC | 2.71e-19 | 6.53e-01 | 0.6257 |
| 3908 | LAMA2 | AEH-subject1 | Human | Endometrium | AEH | 9.64e-03 | -1.52e-01 | -0.3059 |
| 3908 | LAMA2 | AEH-subject2 | Human | Endometrium | AEH | 6.09e-04 | -1.53e-01 | -0.2525 |
| 3908 | LAMA2 | AEH-subject5 | Human | Endometrium | AEH | 6.55e-20 | 6.88e-01 | -0.2953 |
| 3908 | LAMA2 | EEC-subject1 | Human | Endometrium | EEC | 4.88e-05 | -1.62e-01 | -0.2682 |
| 3908 | LAMA2 | EEC-subject2 | Human | Endometrium | EEC | 1.07e-03 | -1.79e-01 | -0.2607 |
| 3908 | LAMA2 | EEC-subject3 | Human | Endometrium | EEC | 2.80e-04 | -1.24e-01 | -0.2525 |
| 3908 | LAMA2 | EEC-subject4 | Human | Endometrium | EEC | 3.57e-12 | 6.45e-01 | -0.2571 |
| 3908 | LAMA2 | EEC-subject5 | Human | Endometrium | EEC | 1.63e-07 | -1.80e-01 | -0.249 |
| 3908 | LAMA2 | GSM5276935 | Human | Endometrium | EEC | 8.77e-08 | -1.73e-01 | -0.123 |
| 3908 | LAMA2 | GSM6177620_NYU_UCEC1_lib1_lib1 | Human | Endometrium | EEC | 1.30e-06 | -1.87e-01 | -0.1869 |
| 3908 | LAMA2 | GSM6177620_NYU_UCEC1_lib2_lib2 | Human | Endometrium | EEC | 1.28e-05 | -1.87e-01 | -0.1875 |
| 3908 | LAMA2 | GSM6177620_NYU_UCEC1_lib3_lib3 | Human | Endometrium | EEC | 1.66e-05 | -1.73e-01 | -0.1883 |
| Page: 1 2 |
| Tissue | Expression Dynamics | Abbreviation |
| Colorectum (GSE201348) |  | FAP: Familial adenomatous polyposis |
| CRC: Colorectal cancer | ||
| Colorectum (HTA11) |  | AD: Adenomas |
| SER: Sessile serrated lesions | ||
| MSI-H: Microsatellite-high colorectal cancer | ||
| MSS: Microsatellite stable colorectal cancer | ||
| Endometrium | 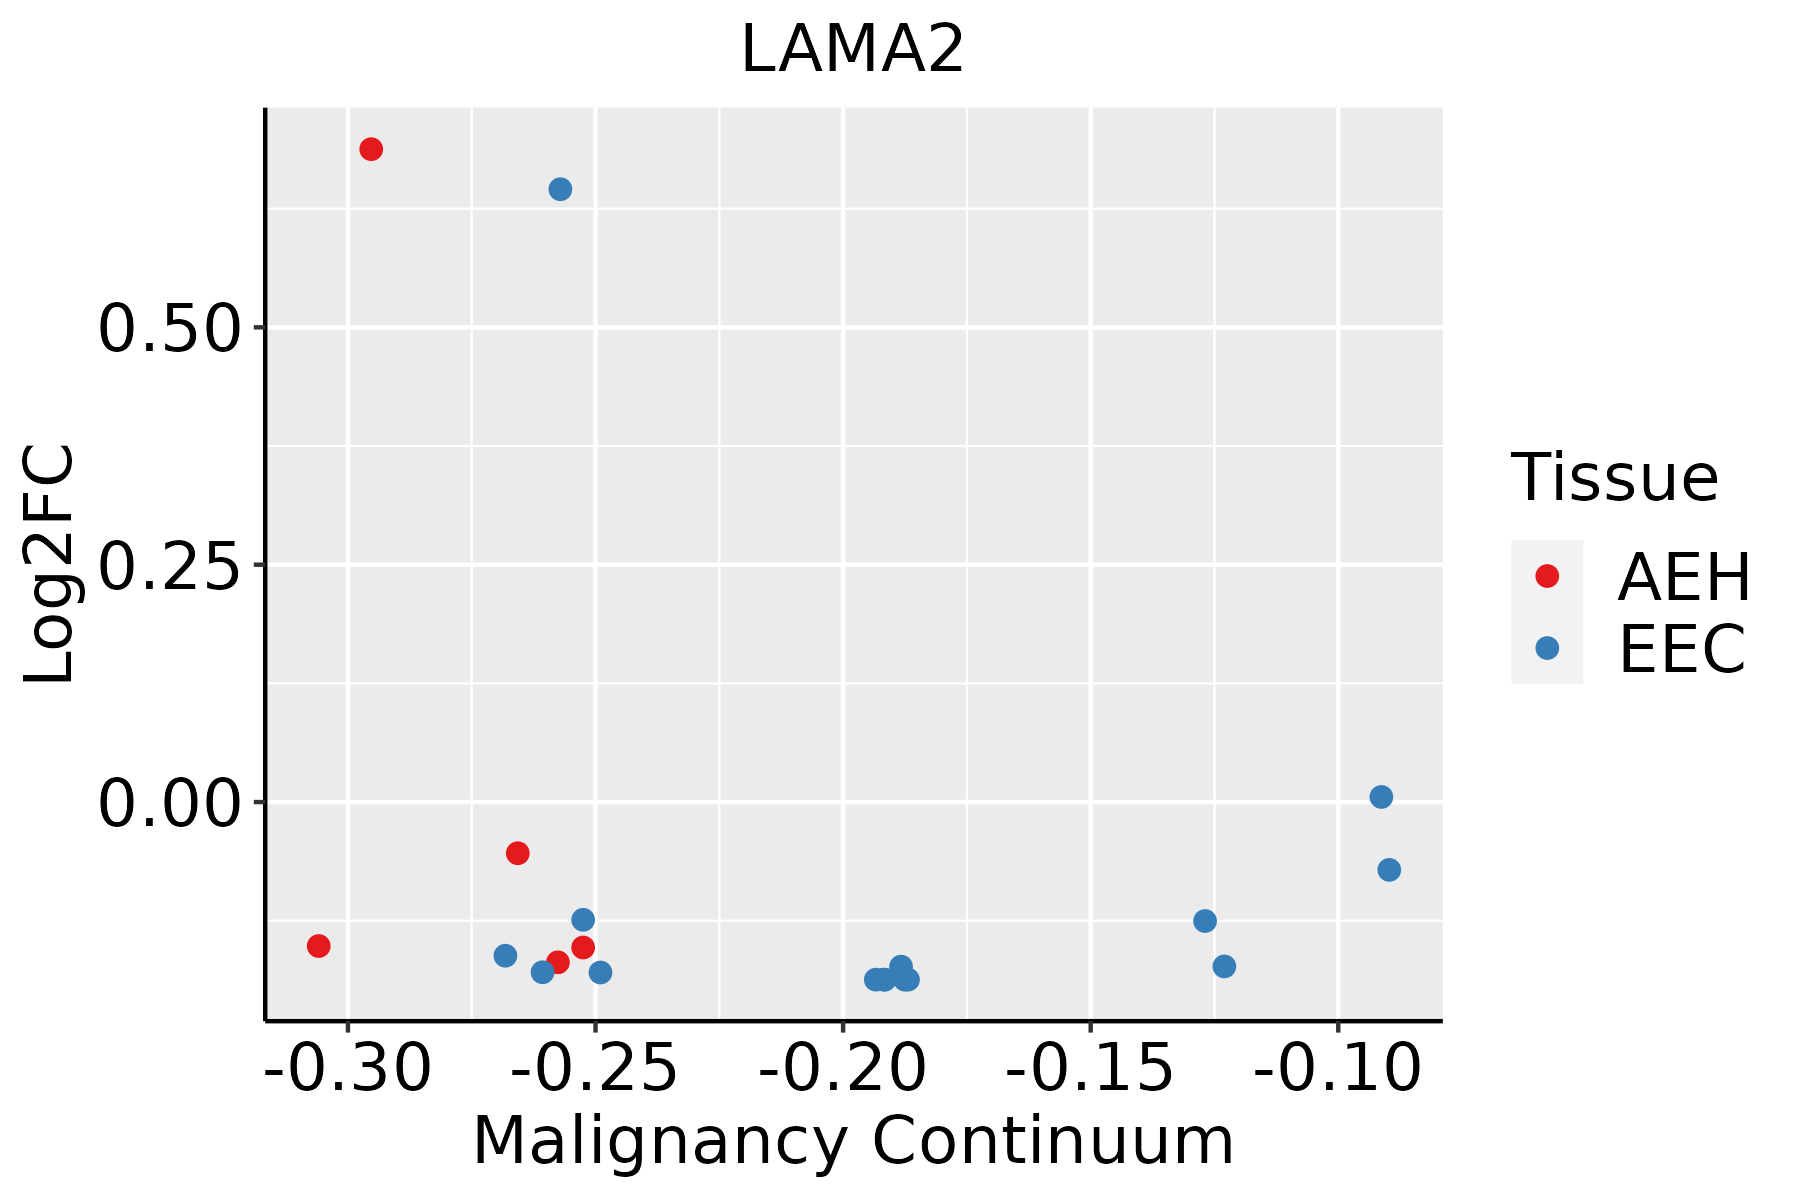 | AEH: Atypical endometrial hyperplasia |
| EEC: Endometrioid Cancer | ||
| Thyroid | 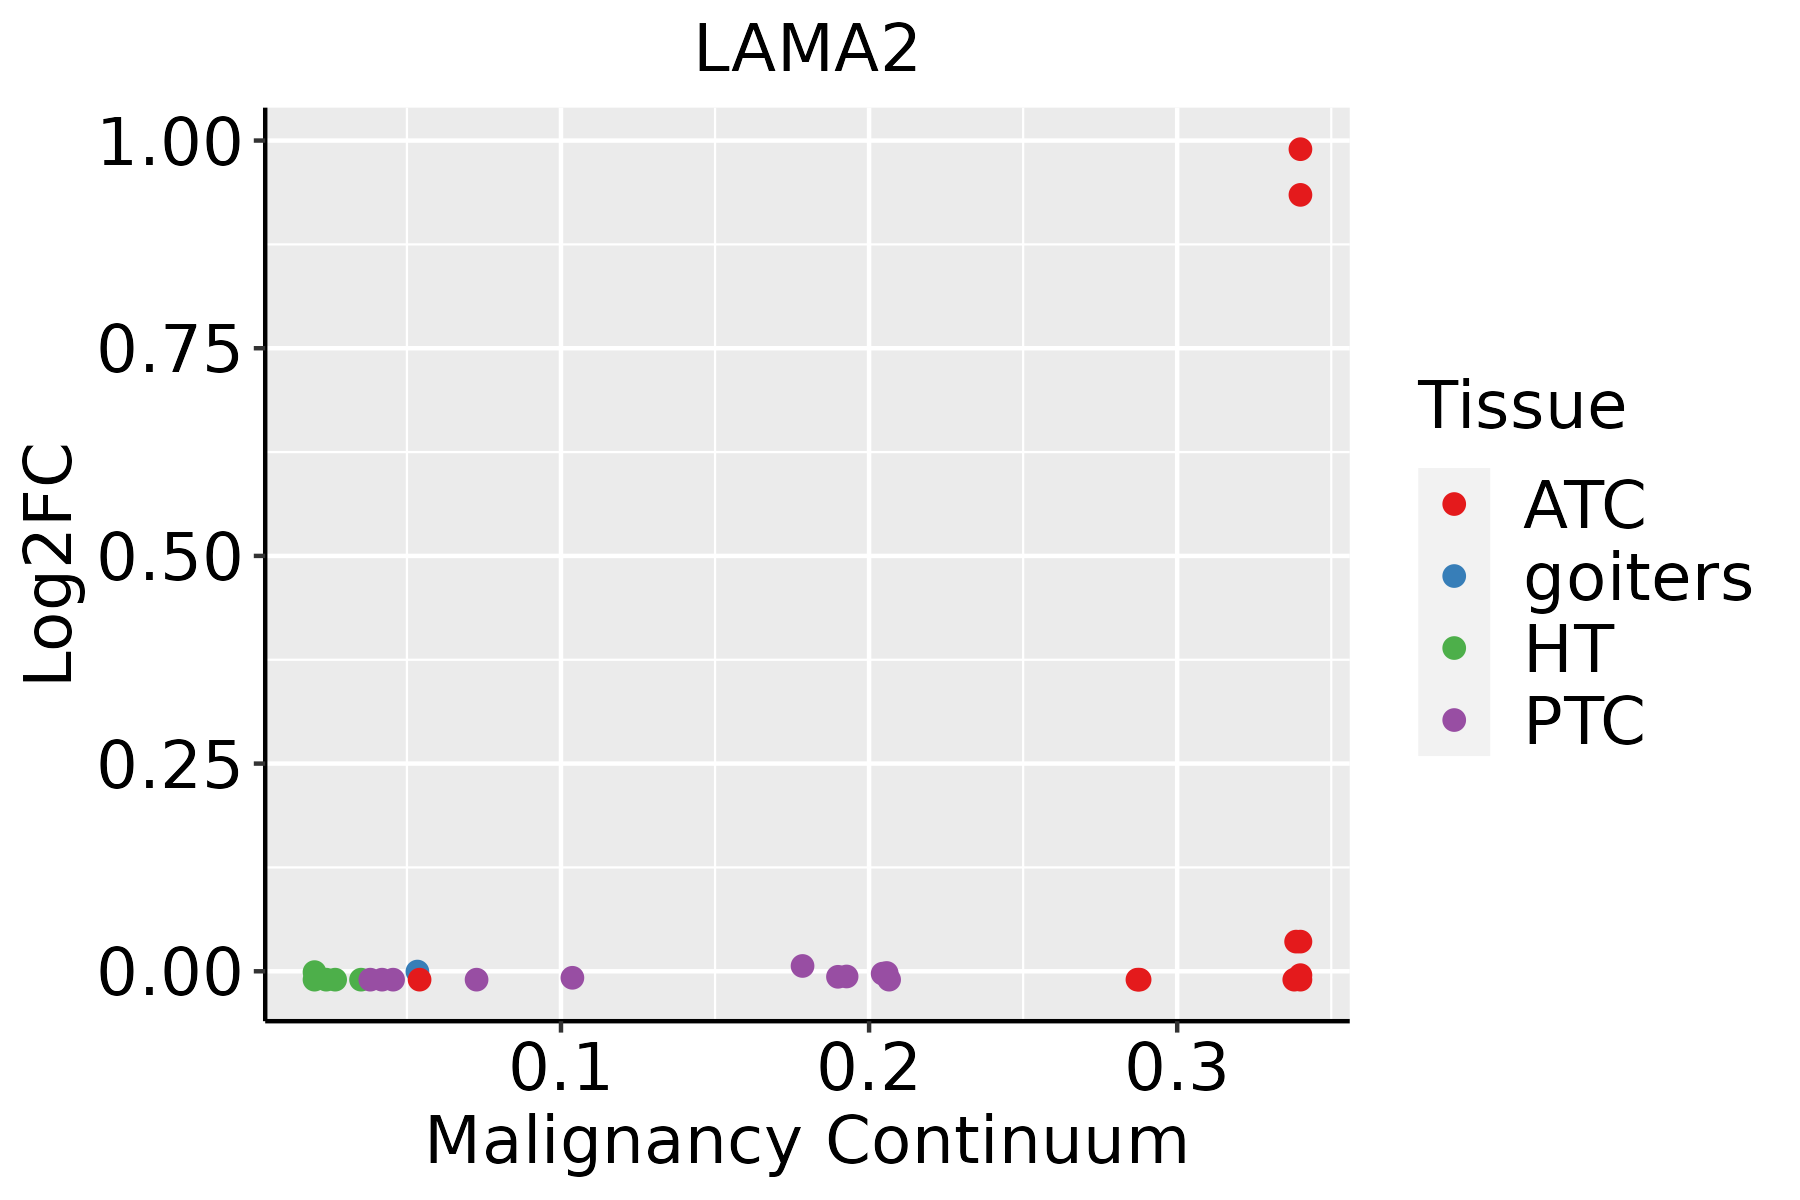 | ATC: Anaplastic thyroid cancer |
| HT: Hashimoto's thyroiditis | ||
| PTC: Papillary thyroid cancer |
| ∗log2FC in expression of this searched gene in stem-like cells from each diseased tissue sample relative to stem-like cells in normal samples in each tissue plotted against the malignancy continuum. Samples are colored based on if they are from different disease stage. |
Top |
Malignant transformation related pathway analysis |
| Find out the enriched GO biological processes and KEGG pathways involved in transition from healthy to precancer to cancer |
| Tissue | Disease Stage | Enriched GO biological Processes |
| Colorectum | AD |  |
| Colorectum | SER |  |
| Colorectum | MSS |  |
| Colorectum | MSI-H |  |
| Colorectum | FAP |  |
| ∗Top 15 enriched GO BP terms are showed in the bar plot of each disease state in each tissue. Each row represents a significant GO biological process which is colored according to the -log10(p.adjust). |
| Page: 1 2 3 4 5 6 7 8 9 |
| GO ID | Tissue | Disease Stage | Description | Gene Ratio | Bg Ratio | pvalue | p.adjust | Count |
| GO:0007409 | Colorectum | AD | axonogenesis | 122/3918 | 418/18723 | 3.36e-05 | 6.15e-04 | 122 |
| GO:0061564 | Colorectum | AD | axon development | 132/3918 | 467/18723 | 8.40e-05 | 1.31e-03 | 132 |
| GO:0060249 | Colorectum | AD | anatomical structure homeostasis | 94/3918 | 314/18723 | 9.37e-05 | 1.42e-03 | 94 |
| GO:0001894 | Colorectum | AD | tissue homeostasis | 81/3918 | 268/18723 | 1.96e-04 | 2.62e-03 | 81 |
| GO:0045995 | Colorectum | AD | regulation of embryonic development | 24/3918 | 64/18723 | 1.72e-03 | 1.43e-02 | 24 |
| GO:0007411 | Colorectum | AD | axon guidance | 64/3918 | 227/18723 | 5.41e-03 | 3.55e-02 | 64 |
| GO:0097485 | Colorectum | AD | neuron projection guidance | 64/3918 | 228/18723 | 6.02e-03 | 3.78e-02 | 64 |
| GO:0035633 | Colorectum | AD | maintenance of blood-brain barrier | 14/3918 | 35/18723 | 7.92e-03 | 4.73e-02 | 14 |
| GO:00074094 | Colorectum | CRC | axonogenesis | 81/2078 | 418/18723 | 3.60e-07 | 2.99e-05 | 81 |
| GO:00615644 | Colorectum | CRC | axon development | 86/2078 | 467/18723 | 1.48e-06 | 8.12e-05 | 86 |
| GO:00602495 | Colorectum | CRC | anatomical structure homeostasis | 57/2078 | 314/18723 | 1.24e-04 | 2.41e-03 | 57 |
| GO:00018945 | Colorectum | CRC | tissue homeostasis | 48/2078 | 268/18723 | 5.56e-04 | 7.70e-03 | 48 |
| GO:0050804 | Colorectum | CRC | modulation of chemical synaptic transmission | 70/2078 | 439/18723 | 1.15e-03 | 1.33e-02 | 70 |
| GO:0099177 | Colorectum | CRC | regulation of trans-synaptic signaling | 70/2078 | 440/18723 | 1.23e-03 | 1.38e-02 | 70 |
| GO:00074098 | Endometrium | AEH | axonogenesis | 81/2100 | 418/18723 | 5.54e-07 | 2.12e-05 | 81 |
| GO:00615648 | Endometrium | AEH | axon development | 88/2100 | 467/18723 | 6.39e-07 | 2.38e-05 | 88 |
| GO:00356337 | Endometrium | AEH | maintenance of blood-brain barrier | 14/2100 | 35/18723 | 1.12e-05 | 2.52e-04 | 14 |
| GO:00075174 | Endometrium | AEH | muscle organ development | 60/2100 | 327/18723 | 8.19e-05 | 1.22e-03 | 60 |
| GO:00459956 | Endometrium | AEH | regulation of embryonic development | 18/2100 | 64/18723 | 1.65e-04 | 2.15e-03 | 18 |
| GO:000189410 | Endometrium | AEH | tissue homeostasis | 50/2100 | 268/18723 | 2.04e-04 | 2.54e-03 | 50 |
| Page: 1 2 |
| Pathway ID | Tissue | Disease Stage | Description | Gene Ratio | Bg Ratio | pvalue | p.adjust | qvalue | Count |
| hsa04510 | Colorectum | AD | Focal adhesion | 67/2092 | 203/8465 | 4.40e-03 | 2.17e-02 | 1.38e-02 | 67 |
| hsa045101 | Colorectum | AD | Focal adhesion | 67/2092 | 203/8465 | 4.40e-03 | 2.17e-02 | 1.38e-02 | 67 |
| hsa045104 | Colorectum | CRC | Focal adhesion | 51/1091 | 203/8465 | 1.29e-06 | 5.41e-05 | 3.66e-05 | 51 |
| hsa041512 | Colorectum | CRC | PI3K-Akt signaling pathway | 64/1091 | 354/8465 | 2.70e-03 | 1.77e-02 | 1.20e-02 | 64 |
| hsa054122 | Colorectum | CRC | Arrhythmogenic right ventricular cardiomyopathy | 18/1091 | 77/8465 | 7.90e-03 | 3.77e-02 | 2.55e-02 | 18 |
| hsa045105 | Colorectum | CRC | Focal adhesion | 51/1091 | 203/8465 | 1.29e-06 | 5.41e-05 | 3.66e-05 | 51 |
| hsa041513 | Colorectum | CRC | PI3K-Akt signaling pathway | 64/1091 | 354/8465 | 2.70e-03 | 1.77e-02 | 1.20e-02 | 64 |
| hsa054123 | Colorectum | CRC | Arrhythmogenic right ventricular cardiomyopathy | 18/1091 | 77/8465 | 7.90e-03 | 3.77e-02 | 2.55e-02 | 18 |
| hsa0541625 | Endometrium | AEH | Viral myocarditis | 27/1197 | 60/8465 | 6.98e-09 | 1.13e-07 | 8.30e-08 | 27 |
| hsa0451015 | Endometrium | AEH | Focal adhesion | 58/1197 | 203/8465 | 4.99e-08 | 7.37e-07 | 5.39e-07 | 58 |
| hsa051466 | Endometrium | AEH | Amoebiasis | 29/1197 | 102/8465 | 1.22e-04 | 1.10e-03 | 8.06e-04 | 29 |
| hsa05416111 | Endometrium | AEH | Viral myocarditis | 27/1197 | 60/8465 | 6.98e-09 | 1.13e-07 | 8.30e-08 | 27 |
| hsa0451016 | Endometrium | AEH | Focal adhesion | 58/1197 | 203/8465 | 4.99e-08 | 7.37e-07 | 5.39e-07 | 58 |
| hsa0514613 | Endometrium | AEH | Amoebiasis | 29/1197 | 102/8465 | 1.22e-04 | 1.10e-03 | 8.06e-04 | 29 |
| hsa0541626 | Endometrium | EEC | Viral myocarditis | 28/1237 | 60/8465 | 2.81e-09 | 5.77e-08 | 4.30e-08 | 28 |
| hsa0451024 | Endometrium | EEC | Focal adhesion | 58/1237 | 203/8465 | 1.61e-07 | 2.30e-06 | 1.71e-06 | 58 |
| hsa0514622 | Endometrium | EEC | Amoebiasis | 28/1237 | 102/8465 | 5.23e-04 | 3.83e-03 | 2.85e-03 | 28 |
| hsa0514516 | Endometrium | EEC | Toxoplasmosis | 28/1237 | 112/8465 | 2.48e-03 | 1.48e-02 | 1.11e-02 | 28 |
| hsa0541635 | Endometrium | EEC | Viral myocarditis | 28/1237 | 60/8465 | 2.81e-09 | 5.77e-08 | 4.30e-08 | 28 |
| hsa0451034 | Endometrium | EEC | Focal adhesion | 58/1237 | 203/8465 | 1.61e-07 | 2.30e-06 | 1.71e-06 | 58 |
| Page: 1 2 |
Top |
Cell-cell communication analysis |
| Identification of potential cell-cell interactions between two cell types and their ligand-receptor pairs for different disease states |
| Ligand | Receptor | LRpair | Pathway | Tissue | Disease Stage |
| LAMA2 | ITGA1_ITGB1 | LAMA2_ITGA1_ITGB1 | LAMININ | Breast | ADJ |
| LAMA2 | ITGA2_ITGB1 | LAMA2_ITGA2_ITGB1 | LAMININ | Breast | ADJ |
| LAMA2 | CD44 | LAMA2_CD44 | LAMININ | Breast | ADJ |
| LAMA2 | ITGA1_ITGB1 | LAMA2_ITGA1_ITGB1 | LAMININ | Breast | DCIS |
| LAMA2 | ITGA2_ITGB1 | LAMA2_ITGA2_ITGB1 | LAMININ | Breast | DCIS |
| LAMA2 | ITGA6_ITGB1 | LAMA2_ITGA6_ITGB1 | LAMININ | Breast | DCIS |
| LAMA2 | ITGA7_ITGB1 | LAMA2_ITGA7_ITGB1 | LAMININ | Breast | DCIS |
| LAMA2 | ITGA6_ITGB4 | LAMA2_ITGA6_ITGB4 | LAMININ | Breast | DCIS |
| LAMA2 | CD44 | LAMA2_CD44 | LAMININ | Breast | DCIS |
| LAMA2 | DAG1 | LAMA2_DAG1 | LAMININ | Breast | DCIS |
| LAMA2 | ITGA1_ITGB1 | LAMA2_ITGA1_ITGB1 | LAMININ | Breast | Healthy |
| LAMA2 | ITGA2_ITGB1 | LAMA2_ITGA2_ITGB1 | LAMININ | Breast | Healthy |
| LAMA2 | ITGA6_ITGB1 | LAMA2_ITGA6_ITGB1 | LAMININ | Breast | Healthy |
| LAMA2 | ITGA7_ITGB1 | LAMA2_ITGA7_ITGB1 | LAMININ | Breast | Healthy |
| LAMA2 | ITGAV_ITGB8 | LAMA2_ITGAV_ITGB8 | LAMININ | Breast | Healthy |
| LAMA2 | CD44 | LAMA2_CD44 | LAMININ | Breast | Healthy |
| LAMA2 | ITGA1_ITGB1 | LAMA2_ITGA1_ITGB1 | LAMININ | Cervix | ADJ |
| LAMA2 | ITGA2_ITGB1 | LAMA2_ITGA2_ITGB1 | LAMININ | Cervix | ADJ |
| LAMA2 | ITGA3_ITGB1 | LAMA2_ITGA3_ITGB1 | LAMININ | Cervix | ADJ |
| LAMA2 | ITGA6_ITGB1 | LAMA2_ITGA6_ITGB1 | LAMININ | Cervix | ADJ |
| Page: 1 2 3 4 5 6 7 8 9 10 11 12 13 14 15 |
Top |
Single-cell gene regulatory network inference analysis |
| Find out the significant the regulons (TFs) and the target genes of each regulon across cell types for different disease states |
| TF | Cell Type | Tissue | Disease Stage | Target Gene | RSS | Regulon Activity |
| ∗The dot plots of a searched regulon are shown for all cell subpopulations in each disease state of each tissue based on the regulon specific score inferred using pySCENIC and by calculating the average expression. |
| Page: 1 |
Top |
Somatic mutation of malignant transformation related genes |
| Annotation of somatic variants for genes involved in malignant transformation |
| Hugo Symbol | Variant Class | Variant Classification | dbSNP RS | HGVSc | HGVSp | HGVSp Short | SWISSPROT | BIOTYPE | SIFT | PolyPhen | Tumor Sample Barcode | Tissue | Histology | Sex | Age | Stage | Therapy Types | Drugs | Outcome |
| LAMA2 | SNV | Missense_Mutation | c.6913G>C | p.Glu2305Gln | p.E2305Q | P24043 | protein_coding | deleterious(0) | probably_damaging(0.999) | TCGA-A2-A0SY-01 | Breast | breast invasive carcinoma | Female | <65 | III/IV | Hormone Therapy | arimidex | SD | |
| LAMA2 | SNV | Missense_Mutation | c.6039G>C | p.Leu2013Phe | p.L2013F | P24043 | protein_coding | tolerated(0.13) | possibly_damaging(0.748) | TCGA-A2-A0T0-01 | Breast | breast invasive carcinoma | Female | <65 | I/II | Chemotherapy | taxotere | SD | |
| LAMA2 | SNV | Missense_Mutation | c.5483T>C | p.Ile1828Thr | p.I1828T | P24043 | protein_coding | tolerated(1) | benign(0) | TCGA-A7-A56D-01 | Breast | breast invasive carcinoma | Female | >=65 | I/II | Hormone Therapy | arimidex | SD | |
| LAMA2 | SNV | Missense_Mutation | rs781097647 | c.8420G>A | p.Arg2807His | p.R2807H | P24043 | protein_coding | tolerated(0.85) | probably_damaging(0.999) | TCGA-A8-A07F-01 | Breast | breast invasive carcinoma | Female | >=65 | I/II | Hormone Therapy | tamoxiphen | SD |
| LAMA2 | SNV | Missense_Mutation | novel | c.1707N>G | p.Ile569Met | p.I569M | P24043 | protein_coding | deleterious(0) | benign(0.347) | TCGA-A8-A09G-01 | Breast | breast invasive carcinoma | Female | >=65 | III/IV | Unknown | Unknown | SD |
| LAMA2 | SNV | Missense_Mutation | novel | c.7412N>T | p.Gly2471Val | p.G2471V | P24043 | protein_coding | deleterious(0) | probably_damaging(1) | TCGA-AC-A5EH-01 | Breast | breast invasive carcinoma | Female | >=65 | I/II | Unknown | Unknown | SD |
| LAMA2 | SNV | Missense_Mutation | c.6062N>A | p.Gly2021Glu | p.G2021E | P24043 | protein_coding | tolerated(1) | benign(0.011) | TCGA-AN-A0FZ-01 | Breast | breast invasive carcinoma | Female | <65 | III/IV | Unknown | Unknown | SD | |
| LAMA2 | SNV | Missense_Mutation | rs548483084 | c.7058N>A | p.Arg2353His | p.R2353H | P24043 | protein_coding | deleterious(0) | probably_damaging(0.989) | TCGA-AN-A0G0-01 | Breast | breast invasive carcinoma | Female | <65 | I/II | Unknown | Unknown | SD |
| LAMA2 | SNV | Missense_Mutation | c.8511G>C | p.Met2837Ile | p.M2837I | P24043 | protein_coding | tolerated(0.46) | benign(0.316) | TCGA-AO-A0J6-01 | Breast | breast invasive carcinoma | Female | <65 | I/II | Chemotherapy | doxorubicin | SD | |
| LAMA2 | SNV | Missense_Mutation | rs199806512 | c.8356C>T | p.Arg2786Cys | p.R2786C | P24043 | protein_coding | deleterious(0) | possibly_damaging(0.61) | TCGA-AQ-A0Y5-01 | Breast | breast invasive carcinoma | Female | >=65 | III/IV | Chemotherapy | cytoxan | SD |
| Page: 1 2 3 4 5 6 7 8 9 10 11 12 13 14 15 16 17 18 19 20 21 22 23 24 25 26 27 28 29 30 31 32 33 34 35 36 37 38 39 40 41 42 43 44 45 46 47 |
Top |
Related drugs of malignant transformation related genes |
| Identification of chemicals and drugs interact with genes involved in malignant transfromation |
| (DGIdb 4.0) |
| Entrez ID | Symbol | Category | Interaction Types | Drug Claim Name | Drug Name | PMIDs |
| 3908 | LAMA2 | DRUGGABLE GENOME | CHEMBL2095222 | OCRIPLASMIN |
| Page: 1 |

Copyright 2023-Present -The University of Texas Health Science Center at Houston |