
|
|||||
|
 | |
| |
| |
| |
| |
| |
|
Gene: LAGE3 |
Gene summary for LAGE3 |
| Gene information | Species | Human | Gene symbol | LAGE3 | Gene ID | 8270 |
| Gene name | L antigen family member 3 | |
| Gene Alias | CVG5 | |
| Cytomap | Xq28 | |
| Gene Type | protein-coding | GO ID | GO:0006139 | UniProtAcc | Q14657 |
Top |
Malignant transformation analysis |
| Identification of the aberrant gene expression in precancerous and cancerous lesions by comparing the gene expression of stem-like cells in diseased tissues with normal stem cells |
| Entrez ID | Symbol | Replicates | Species | Organ | Tissue | Adj P-value | Log2FC | Malignancy |
| 8270 | LAGE3 | GSM4909281 | Human | Breast | IDC | 2.55e-05 | 3.48e-01 | 0.21 |
| 8270 | LAGE3 | GSM4909282 | Human | Breast | IDC | 2.15e-59 | 1.03e+00 | -0.0288 |
| 8270 | LAGE3 | GSM4909285 | Human | Breast | IDC | 2.36e-50 | 8.51e-01 | 0.21 |
| 8270 | LAGE3 | GSM4909287 | Human | Breast | IDC | 4.84e-14 | 5.45e-01 | 0.2057 |
| 8270 | LAGE3 | GSM4909289 | Human | Breast | IDC | 3.75e-03 | 5.29e-01 | 0.1064 |
| 8270 | LAGE3 | GSM4909290 | Human | Breast | IDC | 2.55e-09 | 4.53e-01 | 0.2096 |
| 8270 | LAGE3 | GSM4909291 | Human | Breast | IDC | 4.90e-13 | 5.82e-01 | 0.1753 |
| 8270 | LAGE3 | GSM4909293 | Human | Breast | IDC | 7.18e-13 | 4.26e-01 | 0.1581 |
| 8270 | LAGE3 | GSM4909294 | Human | Breast | IDC | 1.16e-07 | 4.00e-01 | 0.2022 |
| 8270 | LAGE3 | GSM4909295 | Human | Breast | IDC | 1.68e-04 | 4.21e-01 | 0.0898 |
| 8270 | LAGE3 | GSM4909296 | Human | Breast | IDC | 6.10e-22 | 6.03e-01 | 0.1524 |
| 8270 | LAGE3 | GSM4909298 | Human | Breast | IDC | 5.52e-07 | 3.93e-01 | 0.1551 |
| 8270 | LAGE3 | GSM4909301 | Human | Breast | IDC | 2.63e-07 | 4.43e-01 | 0.1577 |
| 8270 | LAGE3 | GSM4909302 | Human | Breast | IDC | 3.18e-08 | 4.26e-01 | 0.1545 |
| 8270 | LAGE3 | GSM4909304 | Human | Breast | IDC | 2.50e-40 | 7.81e-01 | 0.1636 |
| 8270 | LAGE3 | GSM4909306 | Human | Breast | IDC | 4.82e-34 | 7.88e-01 | 0.1564 |
| 8270 | LAGE3 | GSM4909307 | Human | Breast | IDC | 4.31e-07 | 4.08e-01 | 0.1569 |
| 8270 | LAGE3 | GSM4909308 | Human | Breast | IDC | 4.91e-19 | 5.37e-01 | 0.158 |
| 8270 | LAGE3 | GSM4909309 | Human | Breast | IDC | 9.14e-04 | 3.31e-01 | 0.0483 |
| 8270 | LAGE3 | GSM4909311 | Human | Breast | IDC | 3.89e-19 | 4.96e-02 | 0.1534 |
| Page: 1 2 3 4 5 6 7 8 9 |
| Tissue | Expression Dynamics | Abbreviation |
| Breast | 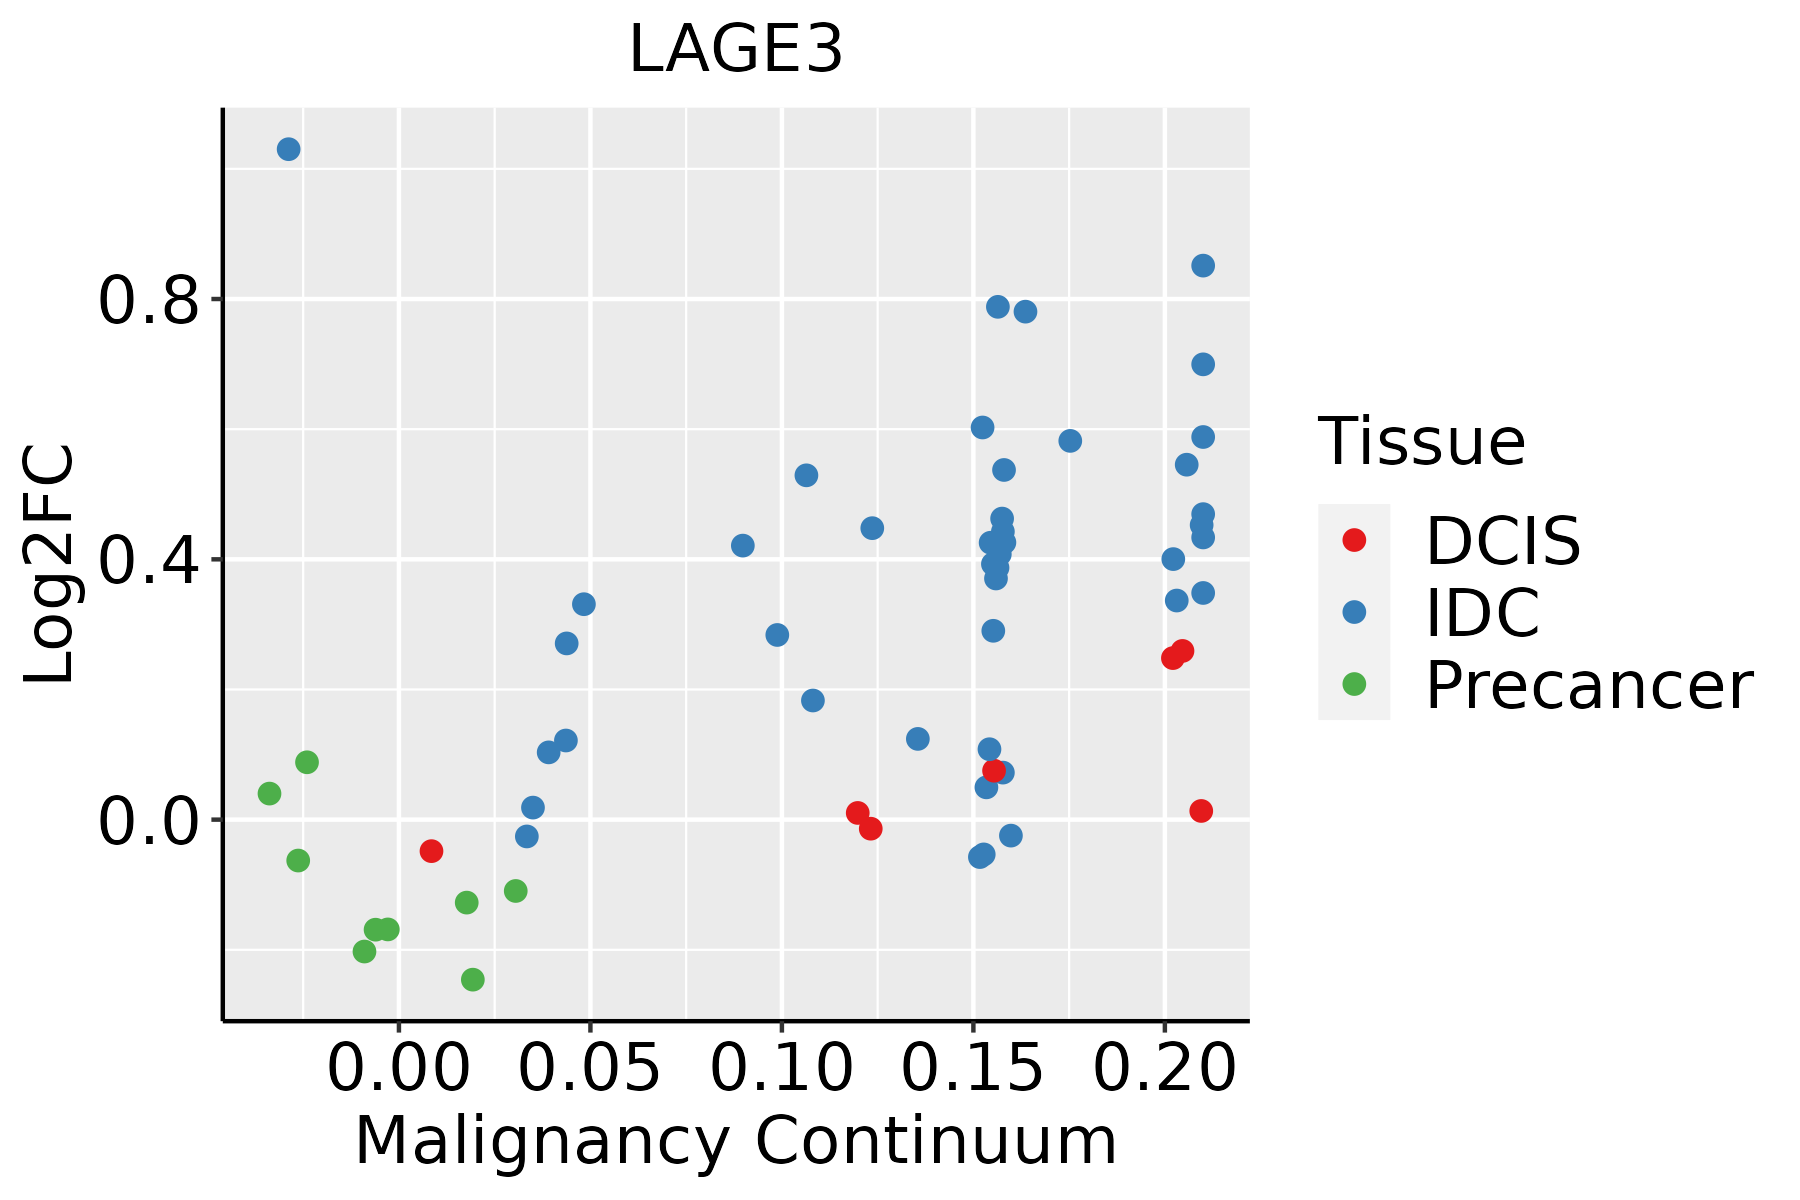 | IDC: Invasive ductal carcinoma |
| DCIS: Ductal carcinoma in situ | ||
| Precancer(BRCA1-mut): Precancerous lesion from BRCA1 mutation carriers | ||
| Esophagus |  | ESCC: Esophageal squamous cell carcinoma |
| HGIN: High-grade intraepithelial neoplasias | ||
| LGIN: Low-grade intraepithelial neoplasias | ||
| Liver | 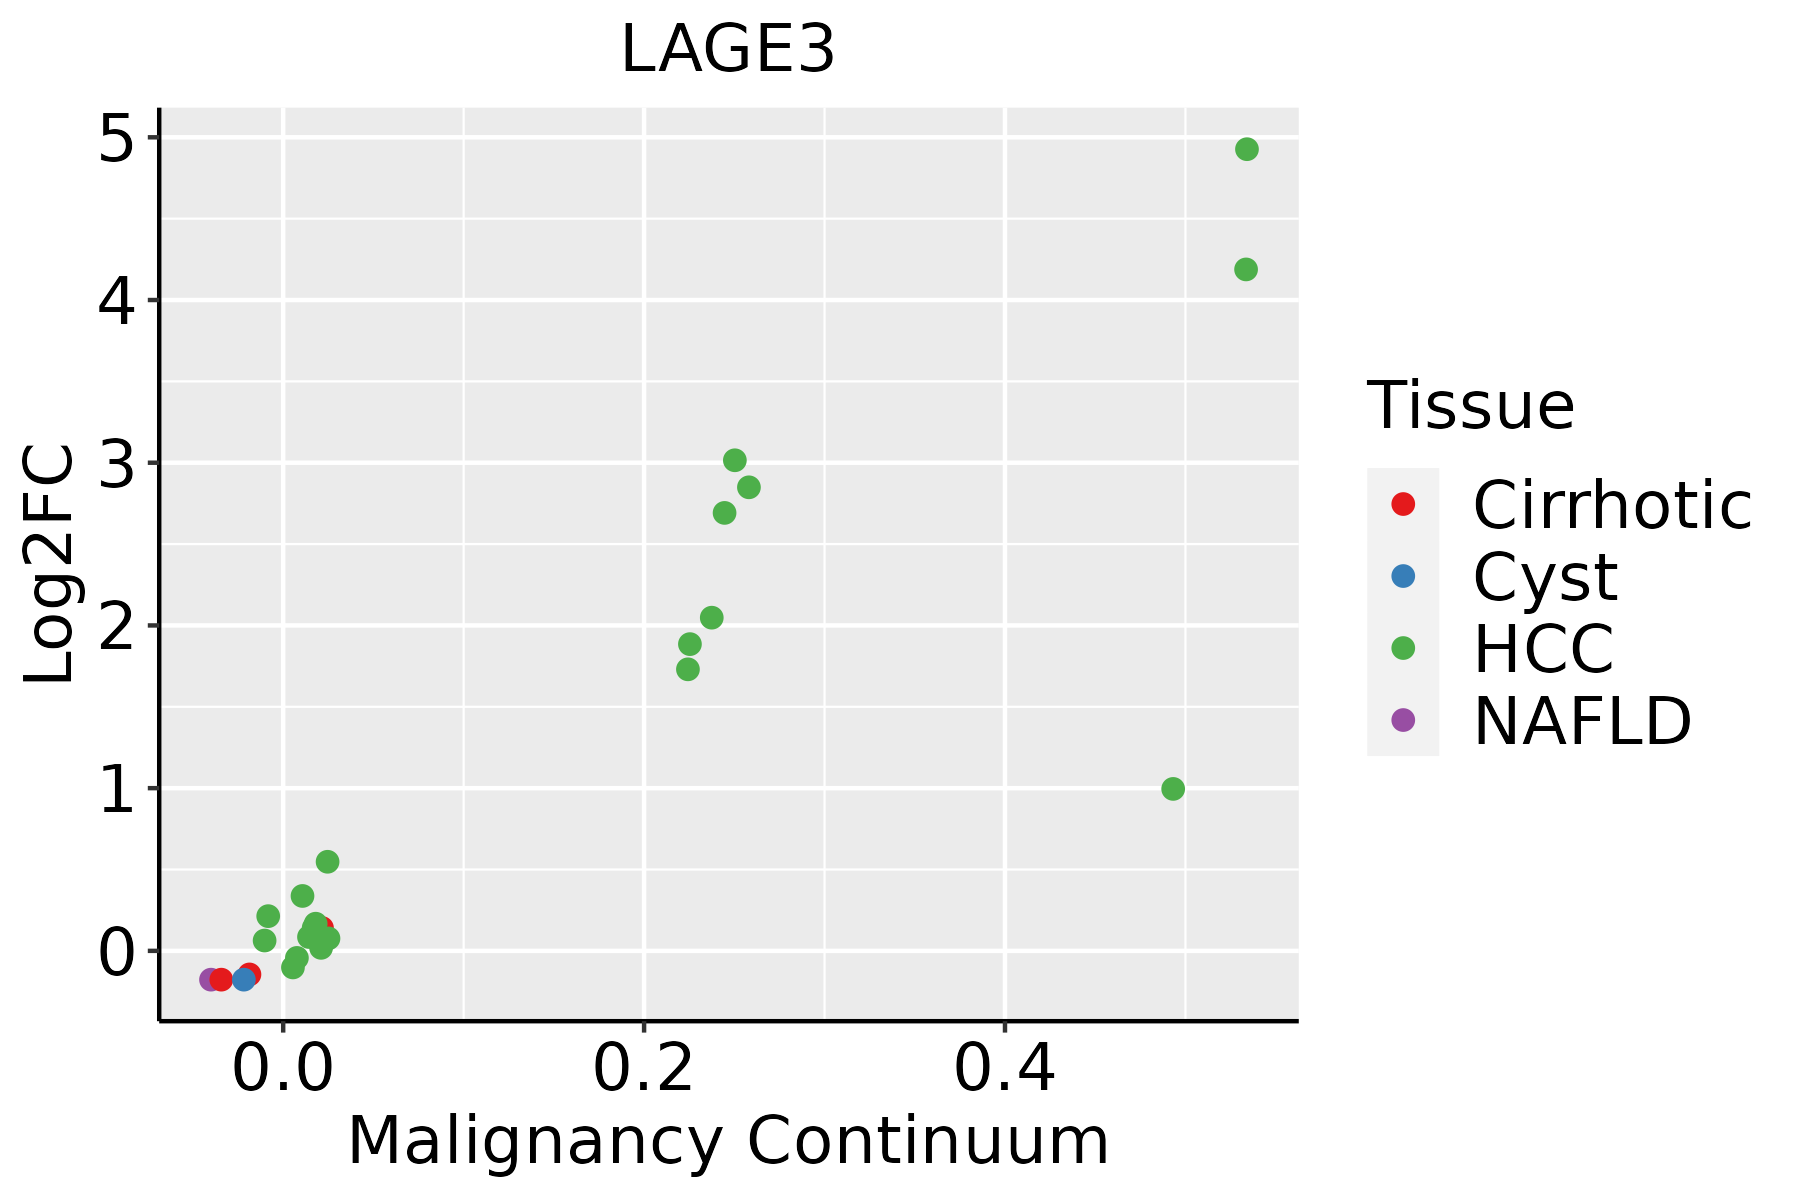 | HCC: Hepatocellular carcinoma |
| NAFLD: Non-alcoholic fatty liver disease | ||
| Oral Cavity | 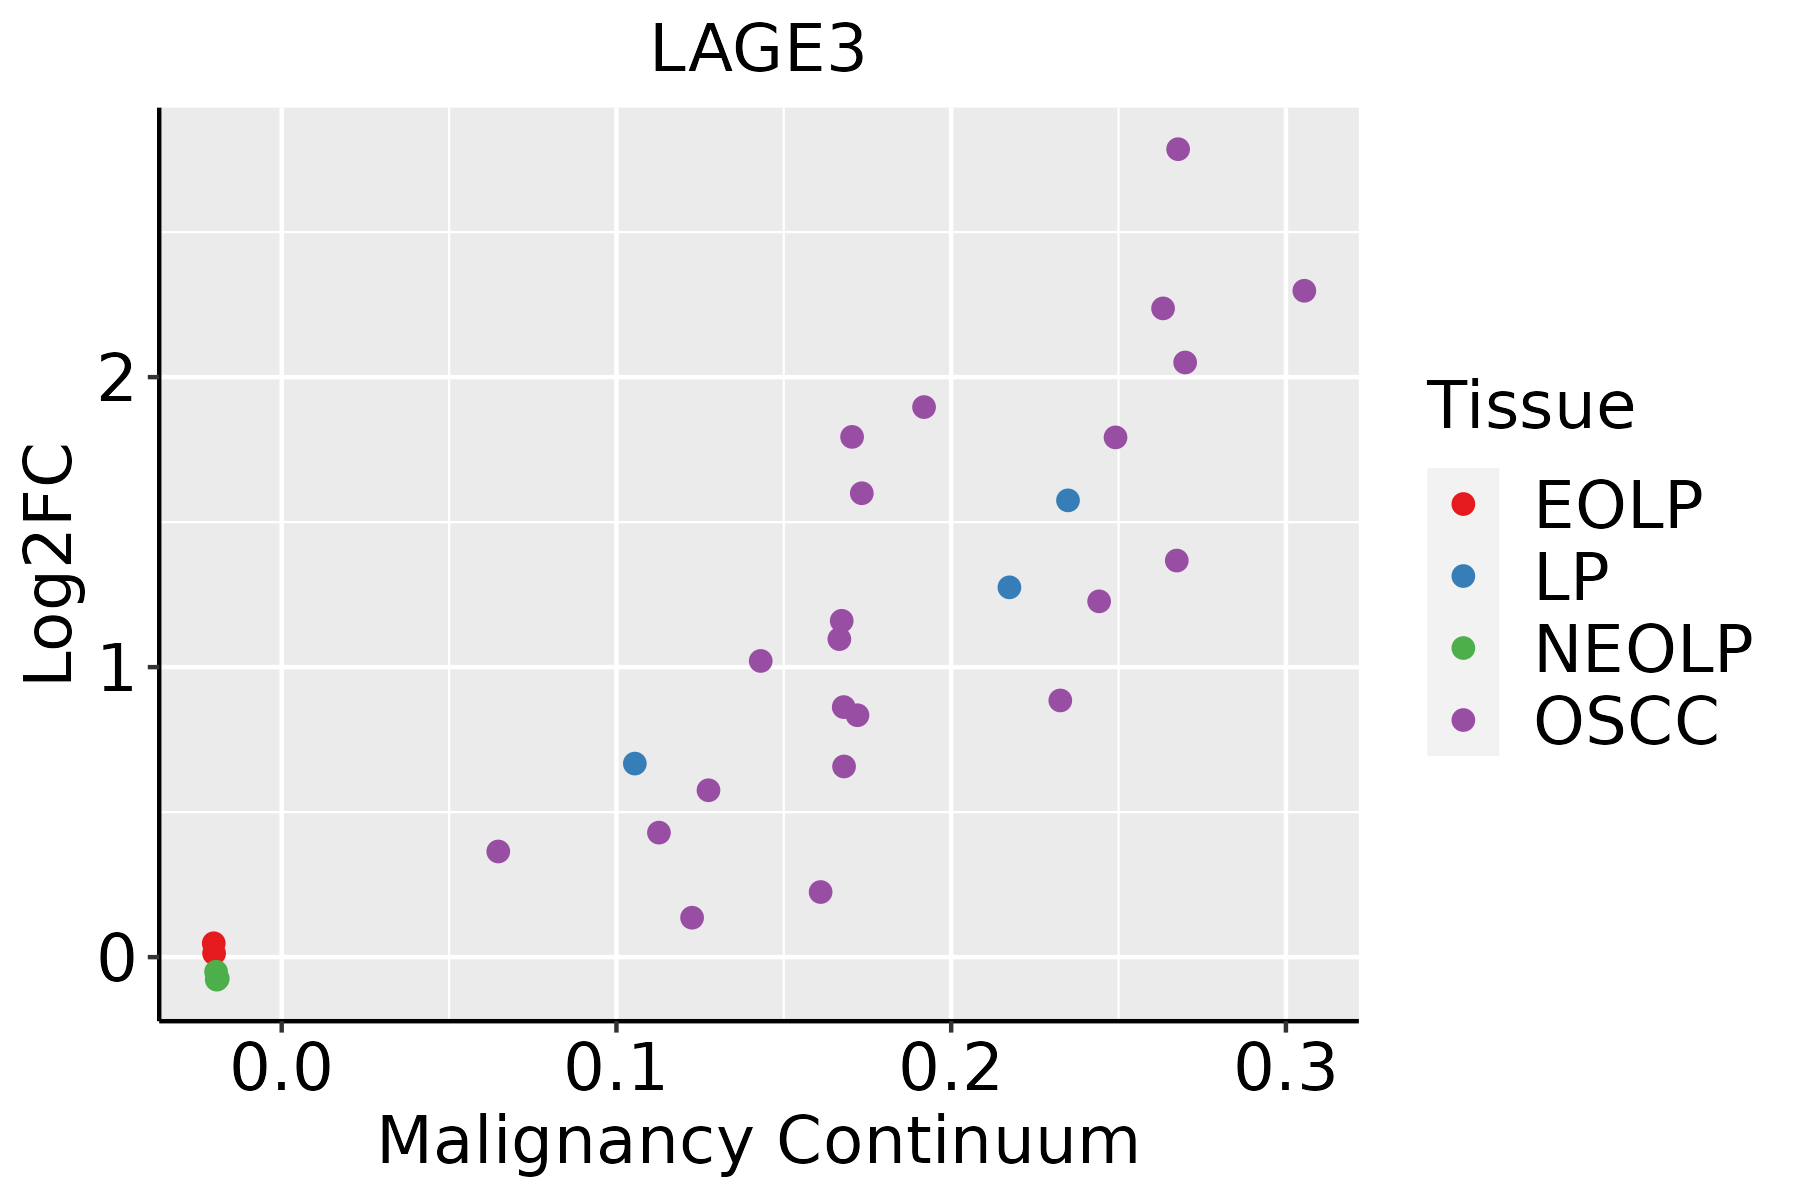 | EOLP: Erosive Oral lichen planus |
| LP: leukoplakia | ||
| NEOLP: Non-erosive oral lichen planus | ||
| OSCC: Oral squamous cell carcinoma | ||
| Prostate |  | BPH: Benign Prostatic Hyperplasia |
| Skin | 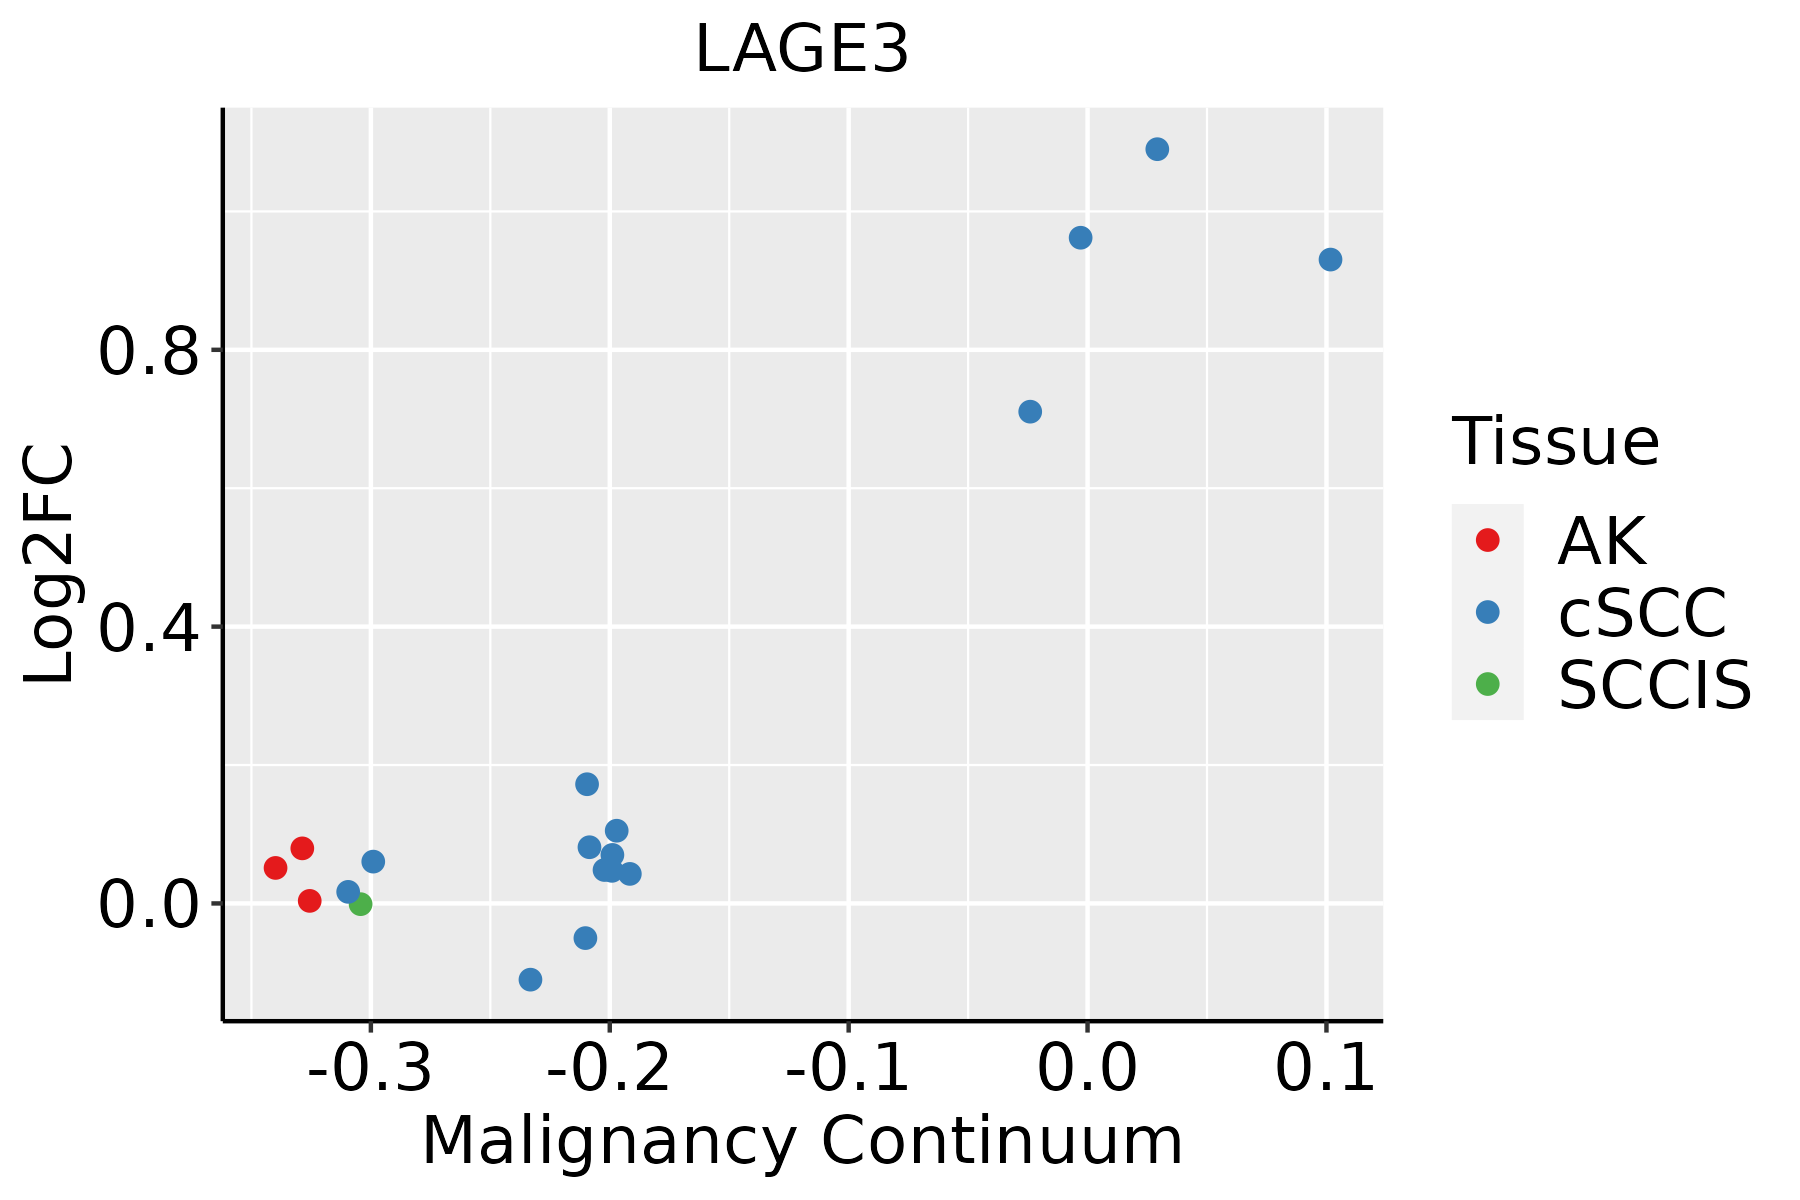 | AK: Actinic keratosis |
| cSCC: Cutaneous squamous cell carcinoma | ||
| SCCIS:squamous cell carcinoma in situ | ||
| Thyroid | 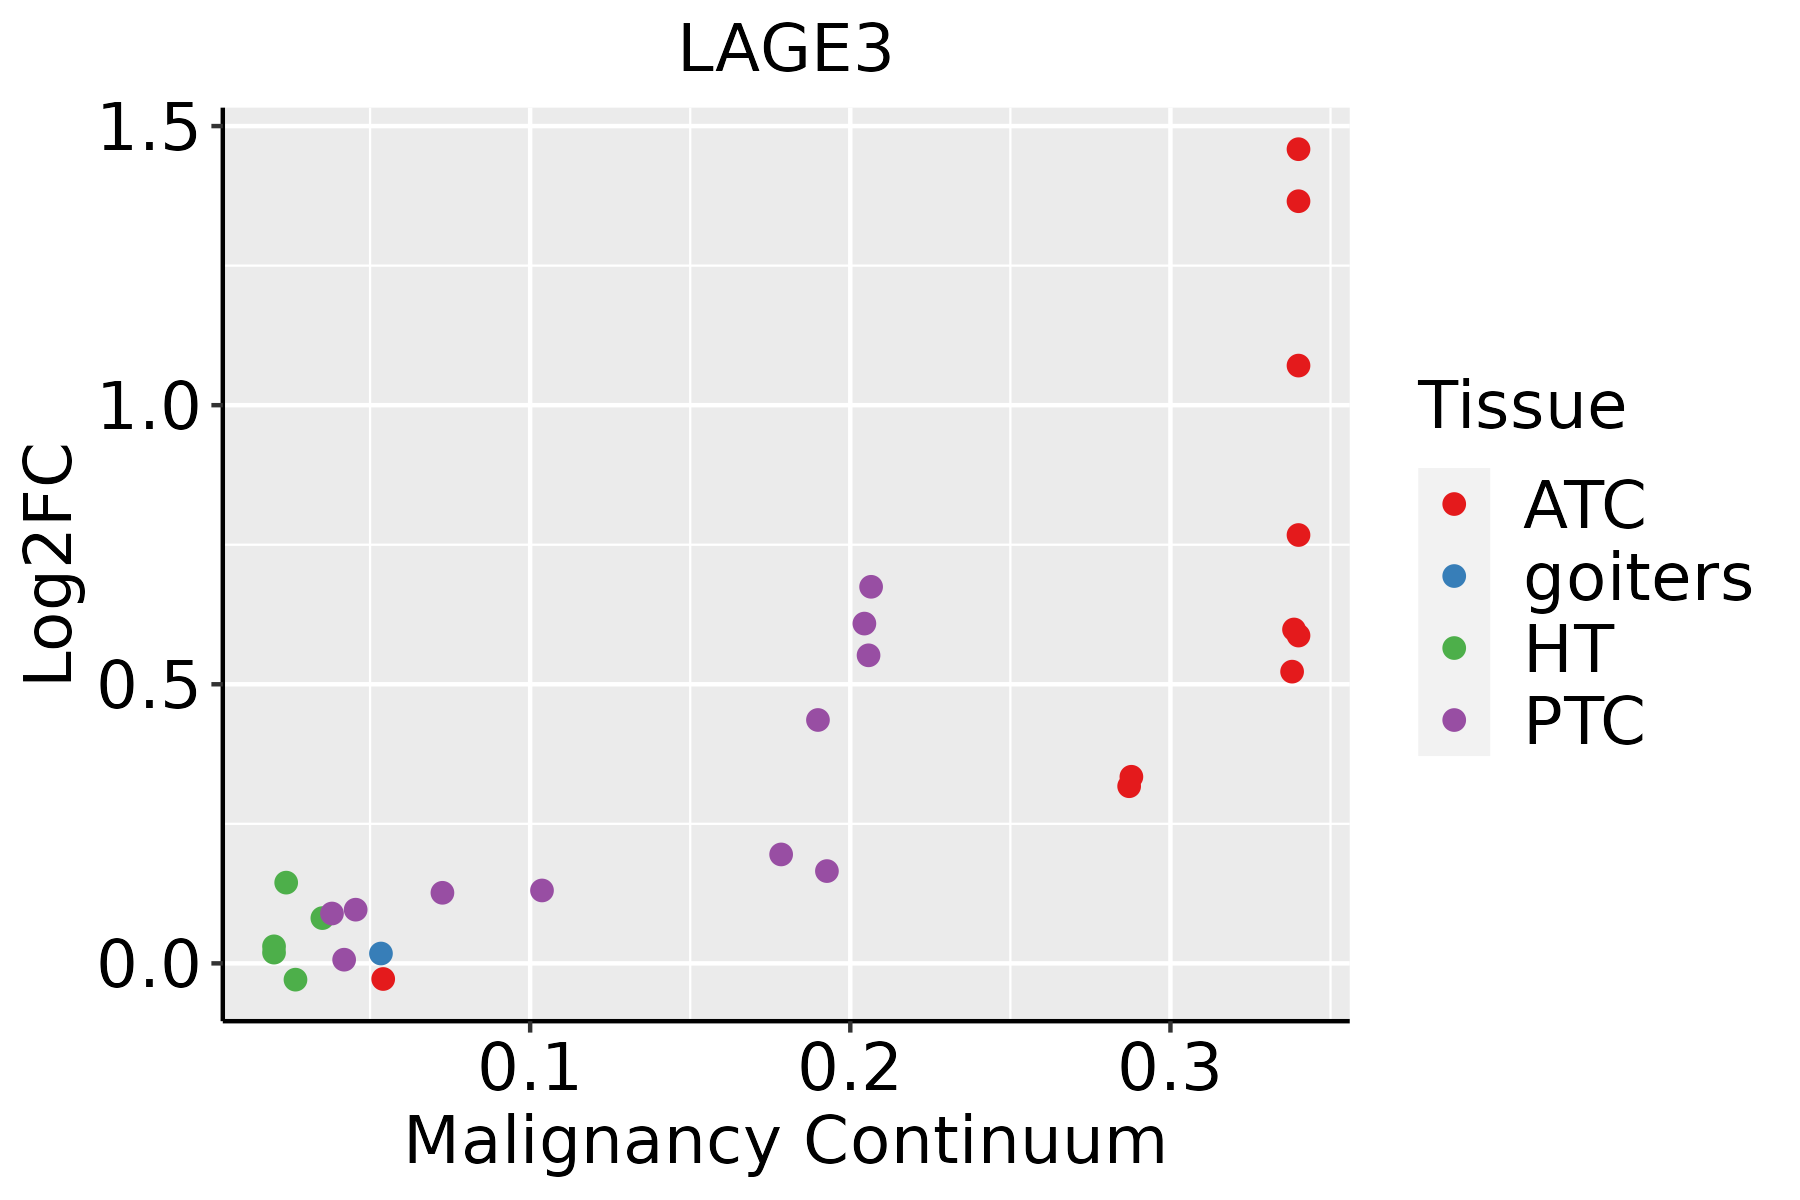 | ATC: Anaplastic thyroid cancer |
| HT: Hashimoto's thyroiditis | ||
| PTC: Papillary thyroid cancer |
| ∗log2FC in expression of this searched gene in stem-like cells from each diseased tissue sample relative to stem-like cells in normal samples in each tissue plotted against the malignancy continuum. Samples are colored based on if they are from different disease stage. |
Top |
Malignant transformation related pathway analysis |
| Find out the enriched GO biological processes and KEGG pathways involved in transition from healthy to precancer to cancer |
| Tissue | Disease Stage | Enriched GO biological Processes |
| Colorectum | AD |  |
| Colorectum | SER |  |
| Colorectum | MSS |  |
| Colorectum | MSI-H |  |
| Colorectum | FAP |  |
| ∗Top 15 enriched GO BP terms are showed in the bar plot of each disease state in each tissue. Each row represents a significant GO biological process which is colored according to the -log10(p.adjust). |
| Page: 1 2 3 4 5 6 7 8 9 |
| GO ID | Tissue | Disease Stage | Description | Gene Ratio | Bg Ratio | pvalue | p.adjust | Count |
| GO:003447011 | Breast | DCIS | ncRNA processing | 44/1390 | 395/18723 | 4.56e-03 | 3.49e-02 | 44 |
| GO:003447010 | Esophagus | HGIN | ncRNA processing | 97/2587 | 395/18723 | 5.92e-09 | 3.90e-07 | 97 |
| GO:00346606 | Esophagus | HGIN | ncRNA metabolic process | 104/2587 | 485/18723 | 2.26e-06 | 8.23e-05 | 104 |
| GO:003447015 | Esophagus | ESCC | ncRNA processing | 300/8552 | 395/18723 | 3.09e-35 | 3.26e-32 | 300 |
| GO:003466012 | Esophagus | ESCC | ncRNA metabolic process | 346/8552 | 485/18723 | 4.35e-31 | 2.51e-28 | 346 |
| GO:00080333 | Esophagus | ESCC | tRNA processing | 92/8552 | 127/18723 | 7.83e-10 | 1.93e-08 | 92 |
| GO:00063992 | Esophagus | ESCC | tRNA metabolic process | 122/8552 | 179/18723 | 9.03e-10 | 2.19e-08 | 122 |
| GO:00344701 | Liver | Cirrhotic | ncRNA processing | 158/4634 | 395/18723 | 1.09e-11 | 6.96e-10 | 158 |
| GO:00346603 | Liver | Cirrhotic | ncRNA metabolic process | 173/4634 | 485/18723 | 3.64e-08 | 1.21e-06 | 173 |
| GO:00344702 | Liver | HCC | ncRNA processing | 293/7958 | 395/18723 | 4.26e-38 | 6.76e-35 | 293 |
| GO:00346601 | Liver | HCC | ncRNA metabolic process | 332/7958 | 485/18723 | 1.48e-31 | 7.80e-29 | 332 |
| GO:0008033 | Liver | HCC | tRNA processing | 87/7958 | 127/18723 | 2.66e-09 | 7.23e-08 | 87 |
| GO:0006399 | Liver | HCC | tRNA metabolic process | 108/7958 | 179/18723 | 1.07e-06 | 1.59e-05 | 108 |
| GO:00344709 | Oral cavity | OSCC | ncRNA processing | 263/7305 | 395/18723 | 4.38e-29 | 2.78e-26 | 263 |
| GO:00346605 | Oral cavity | OSCC | ncRNA metabolic process | 296/7305 | 485/18723 | 2.94e-23 | 6.65e-21 | 296 |
| GO:00080332 | Oral cavity | OSCC | tRNA processing | 78/7305 | 127/18723 | 2.56e-07 | 4.00e-06 | 78 |
| GO:00063991 | Oral cavity | OSCC | tRNA metabolic process | 101/7305 | 179/18723 | 1.65e-06 | 2.15e-05 | 101 |
| GO:003447014 | Oral cavity | LP | ncRNA processing | 184/4623 | 395/18723 | 1.20e-21 | 3.12e-19 | 184 |
| GO:003466011 | Oral cavity | LP | ncRNA metabolic process | 205/4623 | 485/18723 | 6.46e-18 | 1.09e-15 | 205 |
| GO:00080331 | Oral cavity | LP | tRNA processing | 44/4623 | 127/18723 | 7.50e-03 | 4.15e-02 | 44 |
| Page: 1 2 |
| Pathway ID | Tissue | Disease Stage | Description | Gene Ratio | Bg Ratio | pvalue | p.adjust | qvalue | Count |
| Page: 1 |
Top |
Cell-cell communication analysis |
| Identification of potential cell-cell interactions between two cell types and their ligand-receptor pairs for different disease states |
| Ligand | Receptor | LRpair | Pathway | Tissue | Disease Stage |
| Page: 1 |
Top |
Single-cell gene regulatory network inference analysis |
| Find out the significant the regulons (TFs) and the target genes of each regulon across cell types for different disease states |
| TF | Cell Type | Tissue | Disease Stage | Target Gene | RSS | Regulon Activity |
| ∗The dot plots of a searched regulon are shown for all cell subpopulations in each disease state of each tissue based on the regulon specific score inferred using pySCENIC and by calculating the average expression. |
| Page: 1 |
Top |
Somatic mutation of malignant transformation related genes |
| Annotation of somatic variants for genes involved in malignant transformation |
| Hugo Symbol | Variant Class | Variant Classification | dbSNP RS | HGVSc | HGVSp | HGVSp Short | SWISSPROT | BIOTYPE | SIFT | PolyPhen | Tumor Sample Barcode | Tissue | Histology | Sex | Age | Stage | Therapy Types | Drugs | Outcome |
| LAGE3 | SNV | Missense_Mutation | rs142157546 | c.421G>A | p.Val141Ile | p.V141I | Q14657 | protein_coding | tolerated(0.18) | benign(0.041) | TCGA-EW-A1J5-01 | Breast | breast invasive carcinoma | Female | <65 | I/II | Chemotherapy | adriamycin | SD |
| LAGE3 | insertion | Frame_Shift_Ins | novel | c.210_211insGTTCTTAAATGTTTGTTACTACAGAAAATAAAACTGCGCTACTATTC | p.Thr71ValfsTer45 | p.T71Vfs*45 | Q14657 | protein_coding | TCGA-B6-A0IK-01 | Breast | breast invasive carcinoma | Female | <65 | III/IV | Unknown | Unknown | PD | ||
| LAGE3 | SNV | Missense_Mutation | c.272N>T | p.Arg91Met | p.R91M | Q14657 | protein_coding | tolerated(0.08) | possibly_damaging(0.62) | TCGA-AA-3663-01 | Colorectum | colon adenocarcinoma | Male | <65 | I/II | Unknown | Unknown | SD | |
| LAGE3 | SNV | Missense_Mutation | c.341N>A | p.Arg114His | p.R114H | Q14657 | protein_coding | tolerated(0.16) | benign(0.049) | TCGA-AM-5821-01 | Colorectum | colon adenocarcinoma | Female | >=65 | I/II | Unknown | Unknown | SD | |
| LAGE3 | SNV | Missense_Mutation | c.224C>T | p.Ala75Val | p.A75V | Q14657 | protein_coding | deleterious(0.05) | probably_damaging(0.994) | TCGA-AG-3885-01 | Colorectum | rectum adenocarcinoma | Female | >=65 | III/IV | Ancillary | zoledronic | SD | |
| LAGE3 | SNV | Missense_Mutation | rs146248216 | c.350N>A | p.Arg117Gln | p.R117Q | Q14657 | protein_coding | tolerated(0.08) | benign(0.223) | TCGA-B5-A11E-01 | Endometrium | uterine corpus endometrioid carcinoma | Female | <65 | I/II | Unknown | Unknown | SD |
| LAGE3 | SNV | Missense_Mutation | rs782404075 | c.319N>T | p.Arg107Cys | p.R107C | Q14657 | protein_coding | tolerated(0.06) | benign(0.25) | TCGA-DF-A2KU-01 | Endometrium | uterine corpus endometrioid carcinoma | Female | Unknown | I/II | Unknown | Unknown | SD |
| LAGE3 | SNV | Missense_Mutation | rs146248216 | c.350N>A | p.Arg117Gln | p.R117Q | Q14657 | protein_coding | tolerated(0.08) | benign(0.223) | TCGA-EO-A3B0-01 | Endometrium | uterine corpus endometrioid carcinoma | Female | <65 | III/IV | Unknown | Unknown | SD |
| LAGE3 | SNV | Missense_Mutation | novel | c.238G>T | p.Gly80Trp | p.G80W | Q14657 | protein_coding | deleterious(0) | benign(0.173) | TCGA-49-6761-01 | Lung | lung adenocarcinoma | Female | >=65 | III/IV | Unknown | Unknown | SD |
| LAGE3 | SNV | Missense_Mutation | c.145N>C | p.Ala49Pro | p.A49P | Q14657 | protein_coding | tolerated(0.25) | benign(0.026) | TCGA-97-7547-01 | Lung | lung adenocarcinoma | Female | >=65 | I/II | Chemotherapy | vinorelbine | PD |
| Page: 1 2 |
Top |
Related drugs of malignant transformation related genes |
| Identification of chemicals and drugs interact with genes involved in malignant transfromation |
| (DGIdb 4.0) |
| Entrez ID | Symbol | Category | Interaction Types | Drug Claim Name | Drug Name | PMIDs |
| Page: 1 |

Copyright 2023-Present -The University of Texas Health Science Center at Houston |