
|
|||||
|
 | |
| |
| |
| |
| |
| |
|
Gene: LAD1 |
Gene summary for LAD1 |
| Gene information | Species | Human | Gene symbol | LAD1 | Gene ID | 3898 |
| Gene name | ladinin 1 | |
| Gene Alias | LadA | |
| Cytomap | 1q32.1 | |
| Gene Type | protein-coding | GO ID | GO:0005575 | UniProtAcc | O00515 |
Top |
Malignant transformation analysis |
| Identification of the aberrant gene expression in precancerous and cancerous lesions by comparing the gene expression of stem-like cells in diseased tissues with normal stem cells |
| Entrez ID | Symbol | Replicates | Species | Organ | Tissue | Adj P-value | Log2FC | Malignancy |
| 3898 | LAD1 | N_HPV_2 | Human | Cervix | N_HPV | 6.56e-03 | 2.43e-01 | -0.0131 |
| 3898 | LAD1 | Tumor | Human | Cervix | CC | 5.38e-34 | 6.83e-01 | 0.1241 |
| 3898 | LAD1 | sample3 | Human | Cervix | CC | 1.48e-36 | 5.42e-01 | 0.1387 |
| 3898 | LAD1 | L1 | Human | Cervix | CC | 4.70e-03 | 3.82e-01 | 0.0802 |
| 3898 | LAD1 | T3 | Human | Cervix | CC | 1.21e-32 | 5.78e-01 | 0.1389 |
| 3898 | LAD1 | HTA11_3410_2000001011 | Human | Colorectum | AD | 4.44e-16 | 5.19e-01 | 0.0155 |
| 3898 | LAD1 | HTA11_2487_2000001011 | Human | Colorectum | SER | 1.23e-31 | 1.33e+00 | -0.1808 |
| 3898 | LAD1 | HTA11_2951_2000001011 | Human | Colorectum | AD | 3.61e-02 | 4.72e-01 | 0.0216 |
| 3898 | LAD1 | HTA11_1938_2000001011 | Human | Colorectum | AD | 3.20e-31 | 1.22e+00 | -0.0811 |
| 3898 | LAD1 | HTA11_78_2000001011 | Human | Colorectum | AD | 1.99e-17 | 8.02e-01 | -0.1088 |
| 3898 | LAD1 | HTA11_347_2000001011 | Human | Colorectum | AD | 8.27e-40 | 9.86e-01 | -0.1954 |
| 3898 | LAD1 | HTA11_411_2000001011 | Human | Colorectum | SER | 3.97e-09 | 1.59e+00 | -0.2602 |
| 3898 | LAD1 | HTA11_2112_2000001011 | Human | Colorectum | SER | 1.35e-08 | 1.10e+00 | -0.2196 |
| 3898 | LAD1 | HTA11_3361_2000001011 | Human | Colorectum | AD | 5.89e-28 | 1.13e+00 | -0.1207 |
| 3898 | LAD1 | HTA11_83_2000001011 | Human | Colorectum | SER | 2.06e-19 | 1.08e+00 | -0.1526 |
| 3898 | LAD1 | HTA11_696_2000001011 | Human | Colorectum | AD | 1.14e-33 | 9.56e-01 | -0.1464 |
| 3898 | LAD1 | HTA11_866_2000001011 | Human | Colorectum | AD | 2.82e-23 | 6.47e-01 | -0.1001 |
| 3898 | LAD1 | HTA11_1391_2000001011 | Human | Colorectum | AD | 3.88e-42 | 1.46e+00 | -0.059 |
| 3898 | LAD1 | HTA11_2992_2000001011 | Human | Colorectum | SER | 1.76e-08 | 9.96e-01 | -0.1706 |
| 3898 | LAD1 | HTA11_5212_2000001011 | Human | Colorectum | AD | 2.85e-10 | 9.07e-01 | -0.2061 |
| Page: 1 2 3 4 5 6 7 8 |
| Tissue | Expression Dynamics | Abbreviation |
| Cervix |  | CC: Cervix cancer |
| HSIL_HPV: HPV-infected high-grade squamous intraepithelial lesions | ||
| N_HPV: HPV-infected normal cervix | ||
| Colorectum (GSE201348) |  | FAP: Familial adenomatous polyposis |
| CRC: Colorectal cancer | ||
| Colorectum (HTA11) | 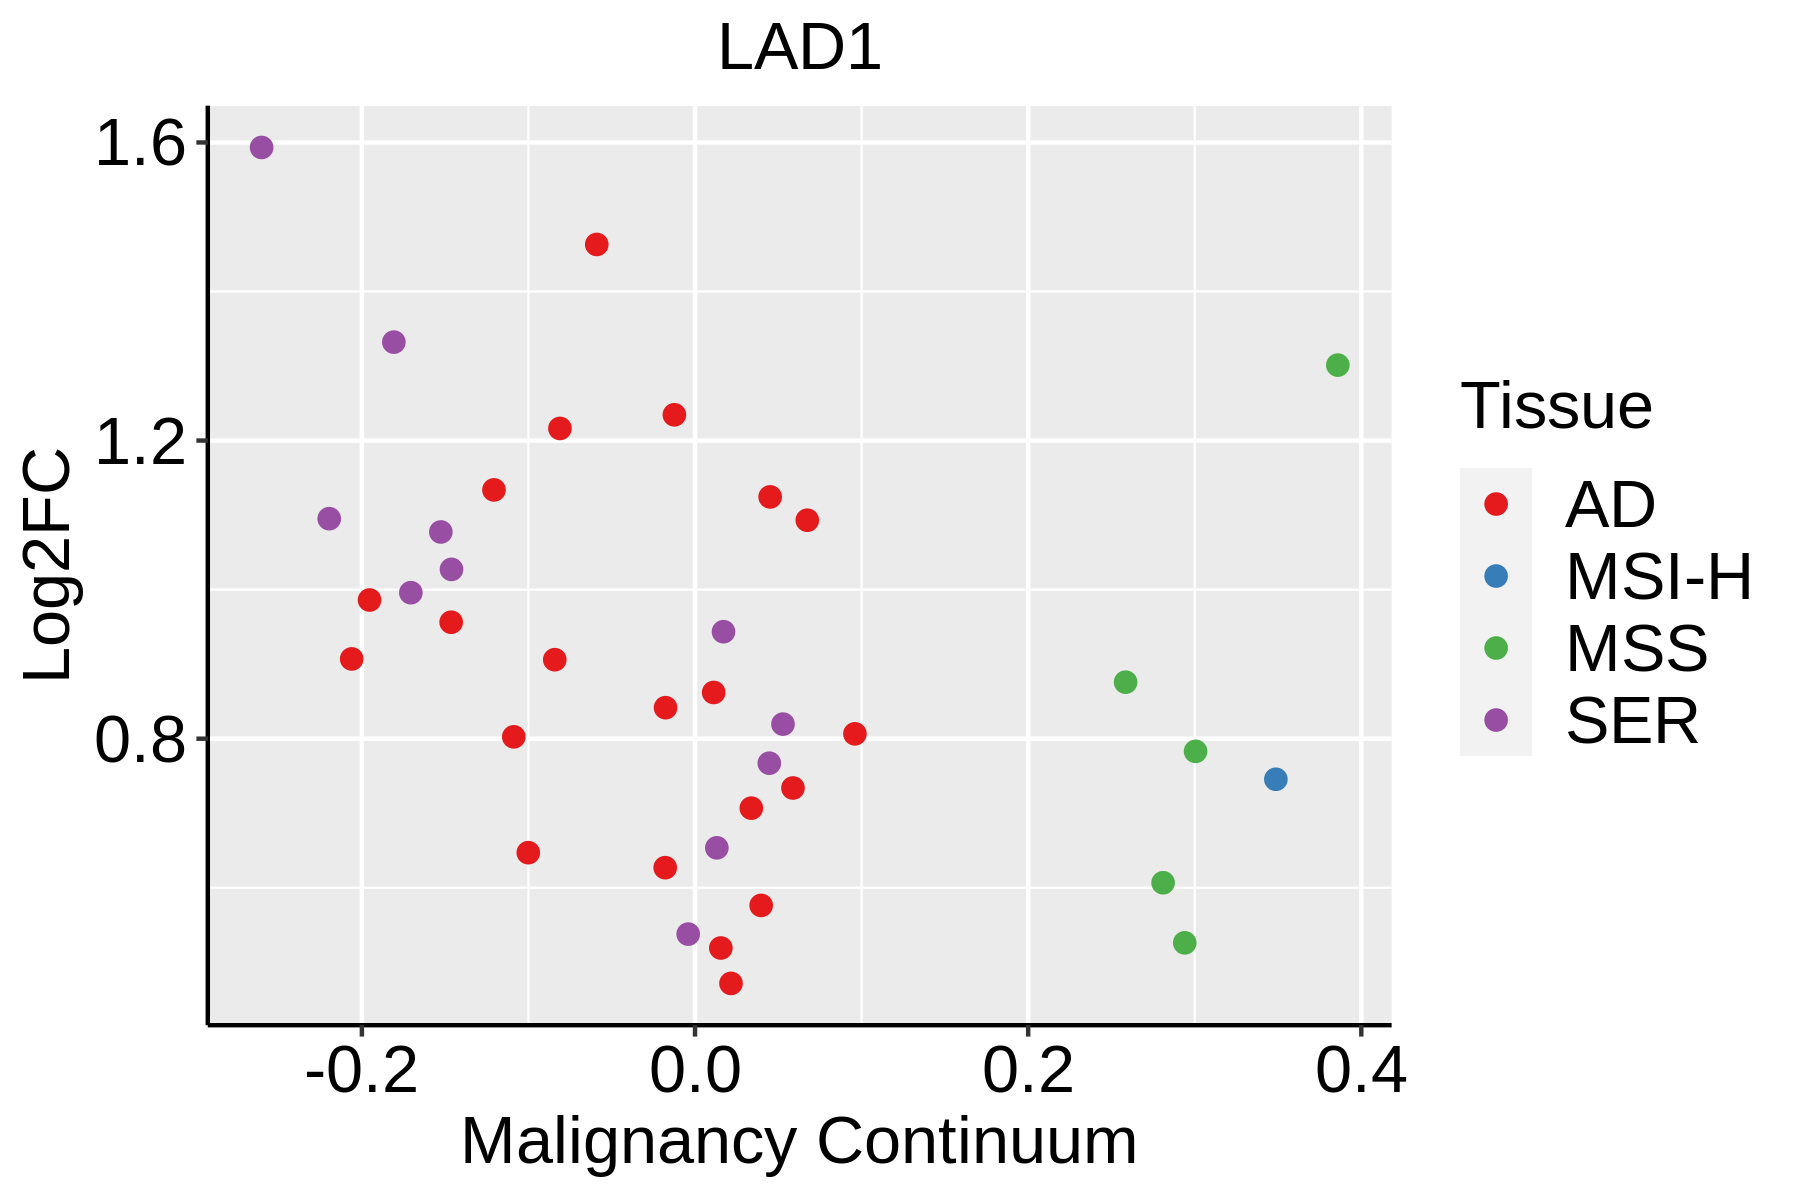 | AD: Adenomas |
| SER: Sessile serrated lesions | ||
| MSI-H: Microsatellite-high colorectal cancer | ||
| MSS: Microsatellite stable colorectal cancer | ||
| Esophagus | 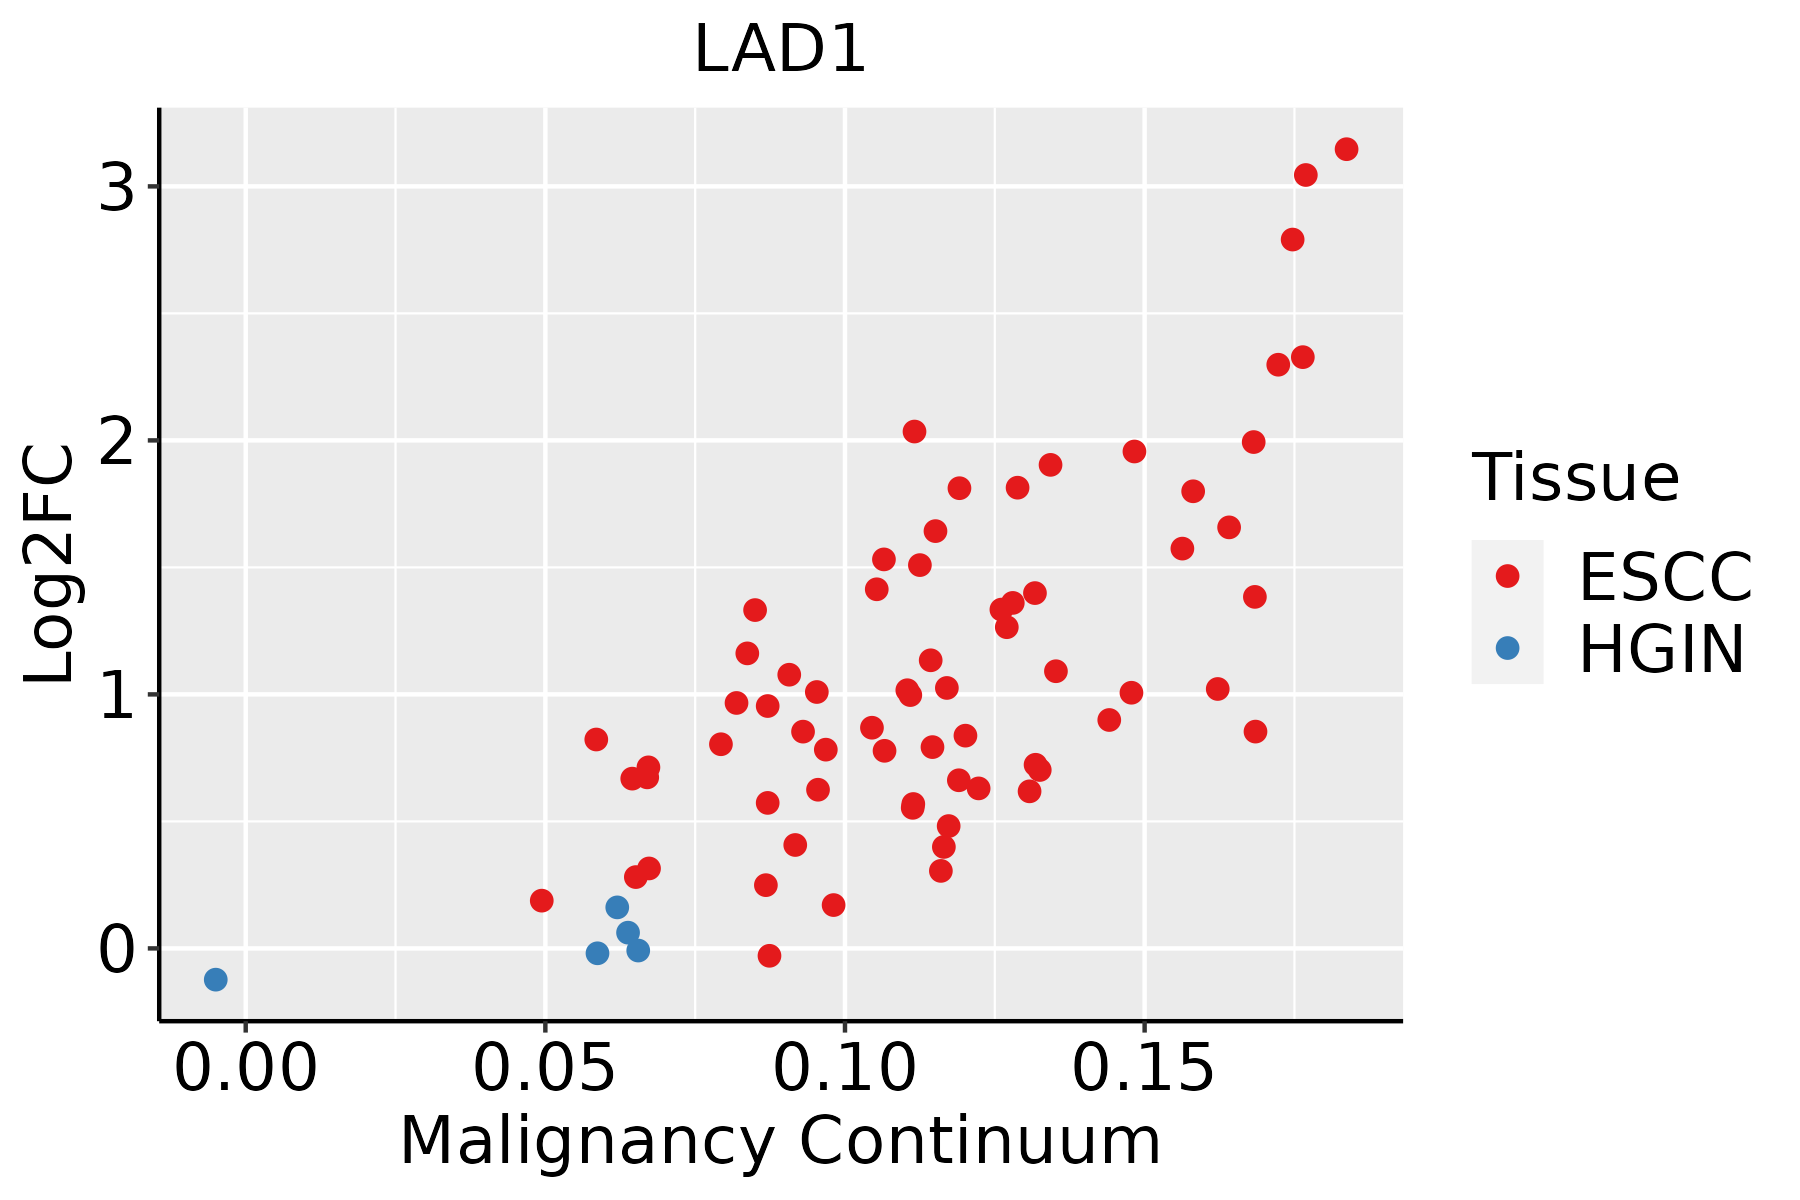 | ESCC: Esophageal squamous cell carcinoma |
| HGIN: High-grade intraepithelial neoplasias | ||
| LGIN: Low-grade intraepithelial neoplasias | ||
| Liver |  | HCC: Hepatocellular carcinoma |
| NAFLD: Non-alcoholic fatty liver disease | ||
| Oral Cavity |  | EOLP: Erosive Oral lichen planus |
| LP: leukoplakia | ||
| NEOLP: Non-erosive oral lichen planus | ||
| OSCC: Oral squamous cell carcinoma | ||
| Skin | 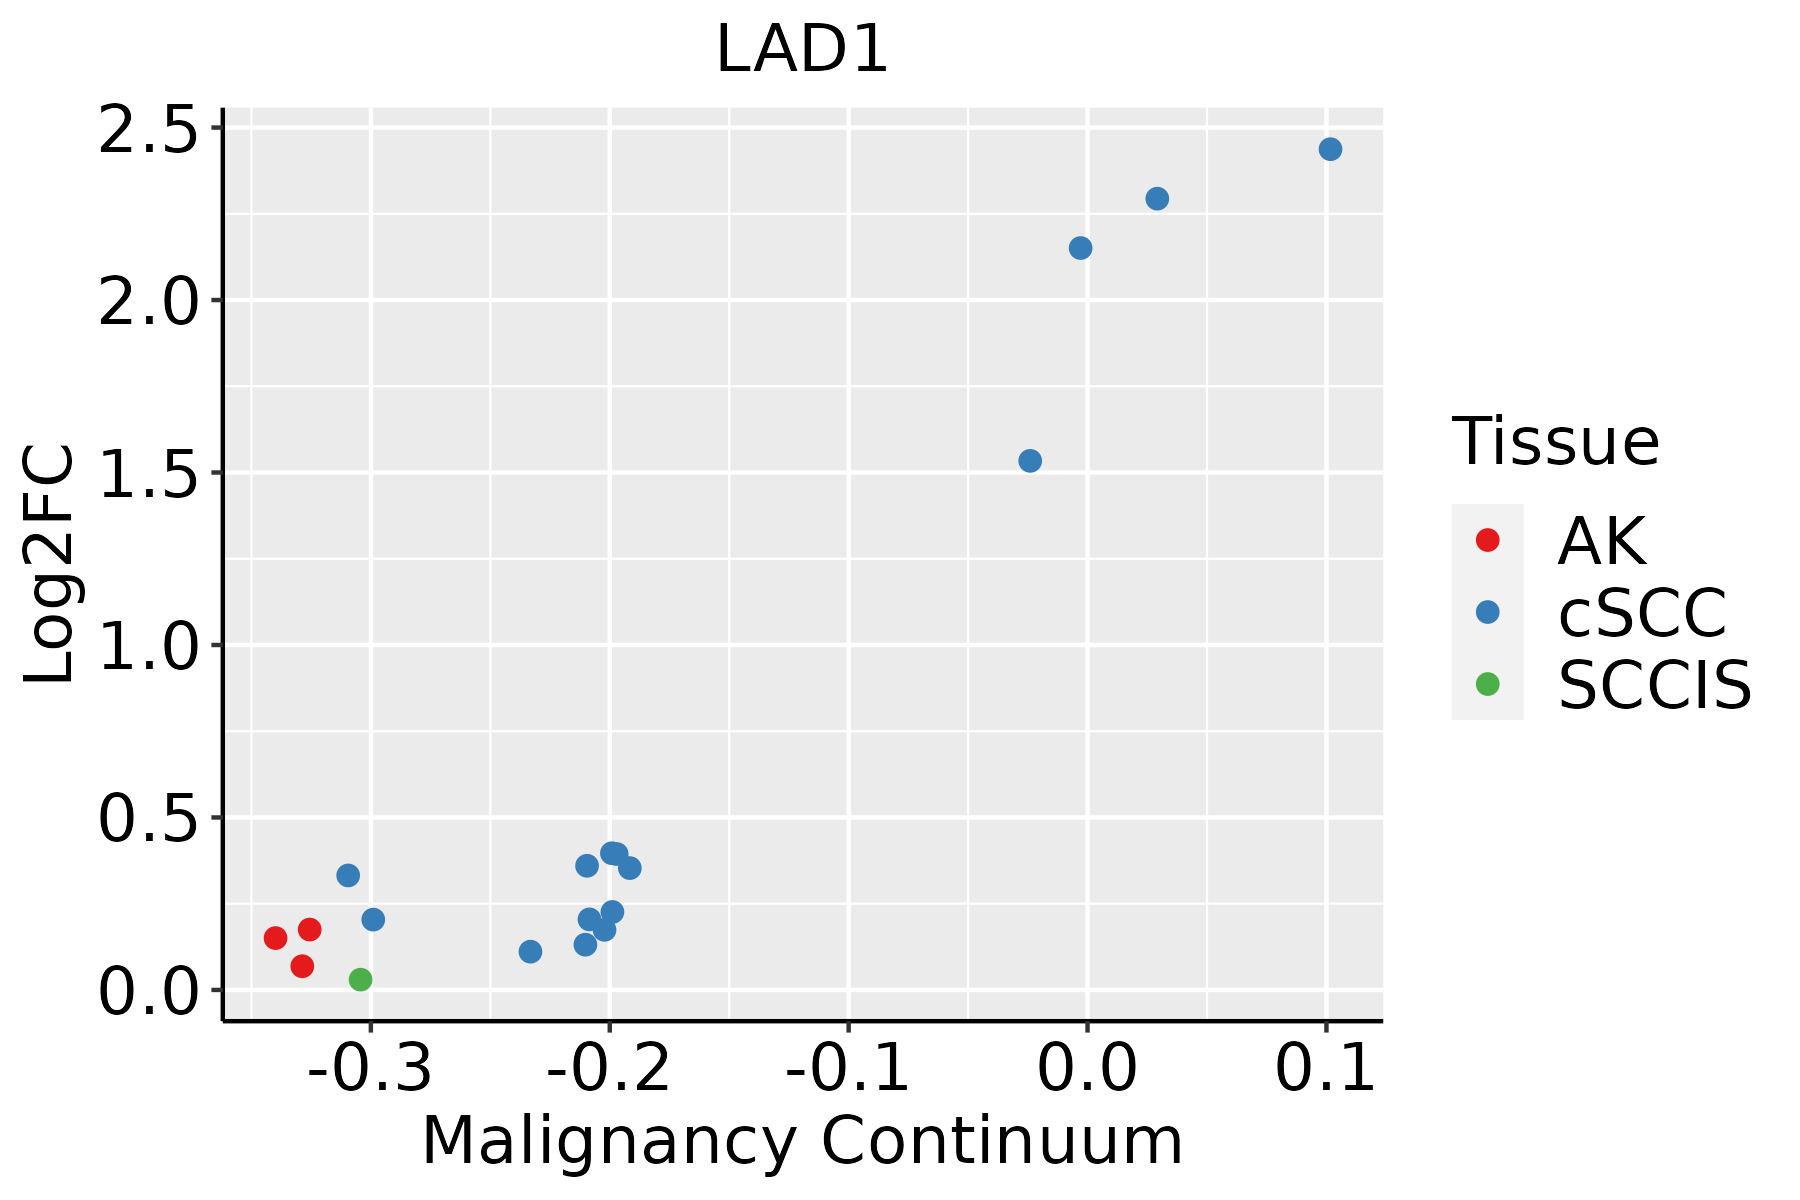 | AK: Actinic keratosis |
| cSCC: Cutaneous squamous cell carcinoma | ||
| SCCIS:squamous cell carcinoma in situ |
| ∗log2FC in expression of this searched gene in stem-like cells from each diseased tissue sample relative to stem-like cells in normal samples in each tissue plotted against the malignancy continuum. Samples are colored based on if they are from different disease stage. |
Top |
Malignant transformation related pathway analysis |
| Find out the enriched GO biological processes and KEGG pathways involved in transition from healthy to precancer to cancer |
| Tissue | Disease Stage | Enriched GO biological Processes |
| Colorectum | AD |  |
| Colorectum | SER |  |
| Colorectum | MSS |  |
| Colorectum | MSI-H |  |
| Colorectum | FAP |  |
| ∗Top 15 enriched GO BP terms are showed in the bar plot of each disease state in each tissue. Each row represents a significant GO biological process which is colored according to the -log10(p.adjust). |
| Page: 1 2 3 4 5 6 7 8 9 |
| GO ID | Tissue | Disease Stage | Description | Gene Ratio | Bg Ratio | pvalue | p.adjust | Count |
| GO:0006753110 | Esophagus | ESCC | nucleoside phosphate metabolic process | 288/8552 | 497/18723 | 1.80e-08 | 3.50e-07 | 288 |
| GO:0009117111 | Esophagus | ESCC | nucleotide metabolic process | 282/8552 | 489/18723 | 4.70e-08 | 8.50e-07 | 282 |
| GO:000916516 | Esophagus | ESCC | nucleotide biosynthetic process | 150/8552 | 254/18723 | 1.12e-05 | 1.06e-04 | 150 |
| GO:190129316 | Esophagus | ESCC | nucleoside phosphate biosynthetic process | 151/8552 | 256/18723 | 1.15e-05 | 1.08e-04 | 151 |
| GO:00067671 | Esophagus | ESCC | water-soluble vitamin metabolic process | 41/8552 | 59/18723 | 1.84e-04 | 1.17e-03 | 41 |
| GO:00067661 | Esophagus | ESCC | vitamin metabolic process | 67/8552 | 106/18723 | 2.03e-04 | 1.28e-03 | 67 |
| GO:000911722 | Liver | HCC | nucleotide metabolic process | 300/7958 | 489/18723 | 1.61e-17 | 1.71e-15 | 300 |
| GO:000675322 | Liver | HCC | nucleoside phosphate metabolic process | 304/7958 | 497/18723 | 1.78e-17 | 1.85e-15 | 304 |
| GO:000916512 | Liver | HCC | nucleotide biosynthetic process | 150/7958 | 254/18723 | 6.79e-08 | 1.40e-06 | 150 |
| GO:190129312 | Liver | HCC | nucleoside phosphate biosynthetic process | 151/7958 | 256/18723 | 6.84e-08 | 1.41e-06 | 151 |
| GO:0006767 | Liver | HCC | water-soluble vitamin metabolic process | 39/7958 | 59/18723 | 2.14e-04 | 1.63e-03 | 39 |
| GO:0006766 | Liver | HCC | vitamin metabolic process | 57/7958 | 106/18723 | 1.25e-02 | 4.53e-02 | 57 |
| GO:000675318 | Oral cavity | OSCC | nucleoside phosphate metabolic process | 247/7305 | 497/18723 | 6.28e-07 | 8.96e-06 | 247 |
| GO:000911719 | Oral cavity | OSCC | nucleotide metabolic process | 243/7305 | 489/18723 | 7.80e-07 | 1.09e-05 | 243 |
| GO:19012938 | Oral cavity | OSCC | nucleoside phosphate biosynthetic process | 125/7305 | 256/18723 | 8.32e-04 | 4.41e-03 | 125 |
| GO:00091658 | Oral cavity | OSCC | nucleotide biosynthetic process | 124/7305 | 254/18723 | 8.79e-04 | 4.63e-03 | 124 |
| GO:000675319 | Oral cavity | LP | nucleoside phosphate metabolic process | 161/4623 | 497/18723 | 5.31e-05 | 7.39e-04 | 161 |
| GO:0009117110 | Oral cavity | LP | nucleotide metabolic process | 158/4623 | 489/18723 | 7.17e-05 | 9.49e-04 | 158 |
| GO:190129315 | Oral cavity | LP | nucleoside phosphate biosynthetic process | 84/4623 | 256/18723 | 1.98e-03 | 1.47e-02 | 84 |
| GO:000916515 | Oral cavity | LP | nucleotide biosynthetic process | 83/4623 | 254/18723 | 2.38e-03 | 1.71e-02 | 83 |
| Page: 1 2 |
| Pathway ID | Tissue | Disease Stage | Description | Gene Ratio | Bg Ratio | pvalue | p.adjust | qvalue | Count |
| Page: 1 |
Top |
Cell-cell communication analysis |
| Identification of potential cell-cell interactions between two cell types and their ligand-receptor pairs for different disease states |
| Ligand | Receptor | LRpair | Pathway | Tissue | Disease Stage |
| Page: 1 |
Top |
Single-cell gene regulatory network inference analysis |
| Find out the significant the regulons (TFs) and the target genes of each regulon across cell types for different disease states |
| TF | Cell Type | Tissue | Disease Stage | Target Gene | RSS | Regulon Activity |
| ∗The dot plots of a searched regulon are shown for all cell subpopulations in each disease state of each tissue based on the regulon specific score inferred using pySCENIC and by calculating the average expression. |
| Page: 1 |
Top |
Somatic mutation of malignant transformation related genes |
| Annotation of somatic variants for genes involved in malignant transformation |
| Hugo Symbol | Variant Class | Variant Classification | dbSNP RS | HGVSc | HGVSp | HGVSp Short | SWISSPROT | BIOTYPE | SIFT | PolyPhen | Tumor Sample Barcode | Tissue | Histology | Sex | Age | Stage | Therapy Types | Drugs | Outcome |
| LAD1 | SNV | Missense_Mutation | rs762400082 | c.1270N>T | p.Arg424Trp | p.R424W | O00515 | protein_coding | deleterious(0) | possibly_damaging(0.627) | TCGA-E2-A1LE-01 | Breast | breast invasive carcinoma | Female | >=65 | III/IV | Chemotherapy | herceptin | PD |
| LAD1 | SNV | Missense_Mutation | novel | c.763N>A | p.Leu255Met | p.L255M | O00515 | protein_coding | tolerated(0.08) | benign(0.203) | TCGA-A6-3809-01 | Colorectum | colon adenocarcinoma | Female | >=65 | I/II | Unknown | Unknown | SD |
| LAD1 | SNV | Missense_Mutation | novel | c.53N>A | p.Arg18Lys | p.R18K | O00515 | protein_coding | tolerated(0.84) | benign(0.201) | TCGA-AA-3872-01 | Colorectum | colon adenocarcinoma | Male | <65 | III/IV | Unknown | Unknown | SD |
| LAD1 | SNV | Missense_Mutation | rs764119320 | c.1501N>A | p.Glu501Lys | p.E501K | O00515 | protein_coding | tolerated(0.82) | benign(0) | TCGA-AA-A010-01 | Colorectum | colon adenocarcinoma | Female | <65 | I/II | Chemotherapy | folinic | CR |
| LAD1 | SNV | Missense_Mutation | novel | c.547N>G | p.Ser183Ala | p.S183A | O00515 | protein_coding | tolerated(0.3) | benign(0.005) | TCGA-AA-A029-01 | Colorectum | colon adenocarcinoma | Male | >=65 | I/II | Unknown | Unknown | SD |
| LAD1 | SNV | Missense_Mutation | rs754757676 | c.451N>T | p.Arg151Trp | p.R151W | O00515 | protein_coding | deleterious(0.02) | benign(0.011) | TCGA-G4-6320-01 | Colorectum | colon adenocarcinoma | Male | >=65 | III/IV | Chemotherapy | oxaliplatin | SD |
| LAD1 | SNV | Missense_Mutation | rs138881525 | c.127G>A | p.Asp43Asn | p.D43N | O00515 | protein_coding | tolerated(0.06) | possibly_damaging(0.883) | TCGA-AG-3591-01 | Colorectum | rectum adenocarcinoma | Female | >=65 | I/II | Unspecific | Complete Response | |
| LAD1 | SNV | Missense_Mutation | novel | c.671G>T | p.Arg224Ile | p.R224I | O00515 | protein_coding | tolerated(0.09) | benign(0.124) | TCGA-AG-A002-01 | Colorectum | rectum adenocarcinoma | Male | <65 | I/II | Unknown | Unknown | SD |
| LAD1 | SNV | Missense_Mutation | rs779029242 | c.193N>A | p.Val65Met | p.V65M | O00515 | protein_coding | tolerated(0.1) | possibly_damaging(0.783) | TCGA-EI-6882-01 | Colorectum | rectum adenocarcinoma | Male | <65 | I/II | Unknown | Unknown | SD |
| LAD1 | deletion | Frame_Shift_Del | c.976delN | p.Ala326LeufsTer18 | p.A326Lfs*18 | O00515 | protein_coding | TCGA-EI-6882-01 | Colorectum | rectum adenocarcinoma | Male | <65 | I/II | Unknown | Unknown | SD |
| Page: 1 2 3 4 5 |
Top |
Related drugs of malignant transformation related genes |
| Identification of chemicals and drugs interact with genes involved in malignant transfromation |
| (DGIdb 4.0) |
| Entrez ID | Symbol | Category | Interaction Types | Drug Claim Name | Drug Name | PMIDs |
| Page: 1 |

Copyright 2023-Present -The University of Texas Health Science Center at Houston |