
|
|||||
|
 | |
| |
| |
| |
| |
| |
|
Gene: LACTB2 |
Gene summary for LACTB2 |
| Gene information | Species | Human | Gene symbol | LACTB2 | Gene ID | 51110 |
| Gene name | lactamase beta 2 | |
| Gene Alias | CGI-83 | |
| Cytomap | 8q13.3 | |
| Gene Type | protein-coding | GO ID | GO:0006139 | UniProtAcc | A0A024R811 |
Top |
Malignant transformation analysis |
| Identification of the aberrant gene expression in precancerous and cancerous lesions by comparing the gene expression of stem-like cells in diseased tissues with normal stem cells |
| Entrez ID | Symbol | Replicates | Species | Organ | Tissue | Adj P-value | Log2FC | Malignancy |
| 51110 | LACTB2 | LZE4T | Human | Esophagus | ESCC | 3.69e-08 | 3.53e-01 | 0.0811 |
| 51110 | LACTB2 | LZE5T | Human | Esophagus | ESCC | 7.45e-09 | 5.85e-01 | 0.0514 |
| 51110 | LACTB2 | LZE8T | Human | Esophagus | ESCC | 4.22e-04 | 9.94e-02 | 0.067 |
| 51110 | LACTB2 | LZE20T | Human | Esophagus | ESCC | 1.42e-11 | 3.64e-01 | 0.0662 |
| 51110 | LACTB2 | LZE22T | Human | Esophagus | ESCC | 6.25e-04 | 4.45e-01 | 0.068 |
| 51110 | LACTB2 | LZE24T | Human | Esophagus | ESCC | 1.85e-16 | 4.05e-01 | 0.0596 |
| 51110 | LACTB2 | LZE21T | Human | Esophagus | ESCC | 8.79e-10 | 2.99e-01 | 0.0655 |
| 51110 | LACTB2 | LZE6T | Human | Esophagus | ESCC | 9.25e-03 | 1.43e-01 | 0.0845 |
| 51110 | LACTB2 | P1T-E | Human | Esophagus | ESCC | 1.64e-05 | 2.14e-01 | 0.0875 |
| 51110 | LACTB2 | P2T-E | Human | Esophagus | ESCC | 1.55e-18 | 4.17e-01 | 0.1177 |
| 51110 | LACTB2 | P4T-E | Human | Esophagus | ESCC | 3.87e-29 | 7.23e-01 | 0.1323 |
| 51110 | LACTB2 | P5T-E | Human | Esophagus | ESCC | 2.42e-27 | 6.06e-01 | 0.1327 |
| 51110 | LACTB2 | P8T-E | Human | Esophagus | ESCC | 1.00e-22 | 5.69e-01 | 0.0889 |
| 51110 | LACTB2 | P9T-E | Human | Esophagus | ESCC | 3.04e-15 | 3.40e-01 | 0.1131 |
| 51110 | LACTB2 | P10T-E | Human | Esophagus | ESCC | 8.06e-20 | 4.56e-01 | 0.116 |
| 51110 | LACTB2 | P11T-E | Human | Esophagus | ESCC | 3.08e-08 | 4.21e-01 | 0.1426 |
| 51110 | LACTB2 | P12T-E | Human | Esophagus | ESCC | 3.77e-28 | 4.96e-01 | 0.1122 |
| 51110 | LACTB2 | P15T-E | Human | Esophagus | ESCC | 2.35e-18 | 4.17e-01 | 0.1149 |
| 51110 | LACTB2 | P16T-E | Human | Esophagus | ESCC | 6.07e-22 | 5.13e-01 | 0.1153 |
| 51110 | LACTB2 | P17T-E | Human | Esophagus | ESCC | 5.93e-09 | 4.24e-01 | 0.1278 |
| Page: 1 2 3 4 5 6 |
| Tissue | Expression Dynamics | Abbreviation |
| Esophagus |  | ESCC: Esophageal squamous cell carcinoma |
| HGIN: High-grade intraepithelial neoplasias | ||
| LGIN: Low-grade intraepithelial neoplasias | ||
| GC |  | CAG: Chronic atrophic gastritis |
| CAG with IM: Chronic atrophic gastritis with intestinal metaplasia | ||
| CSG: Chronic superficial gastritis | ||
| GC: Gastric cancer | ||
| SIM: Severe intestinal metaplasia | ||
| WIM: Wild intestinal metaplasia | ||
| Liver | 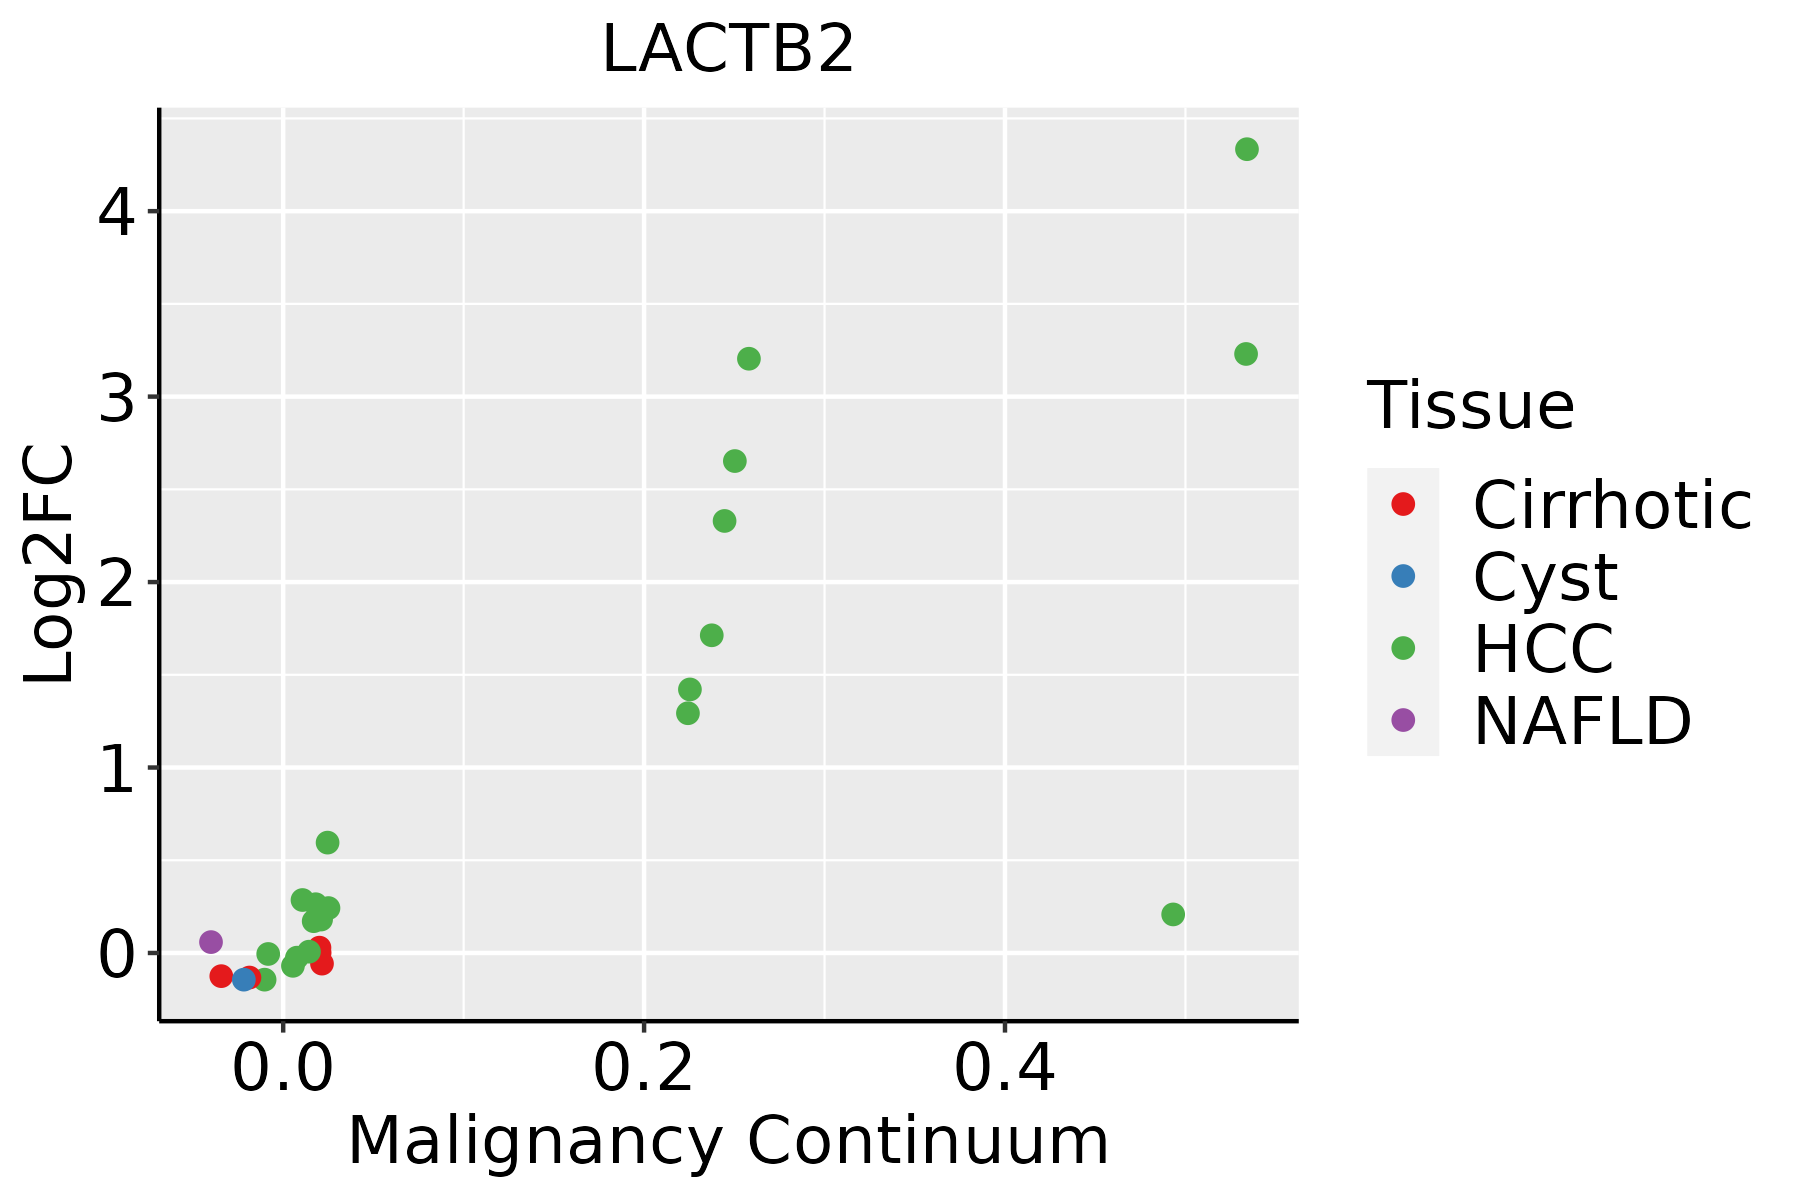 | HCC: Hepatocellular carcinoma |
| NAFLD: Non-alcoholic fatty liver disease | ||
| Oral Cavity | 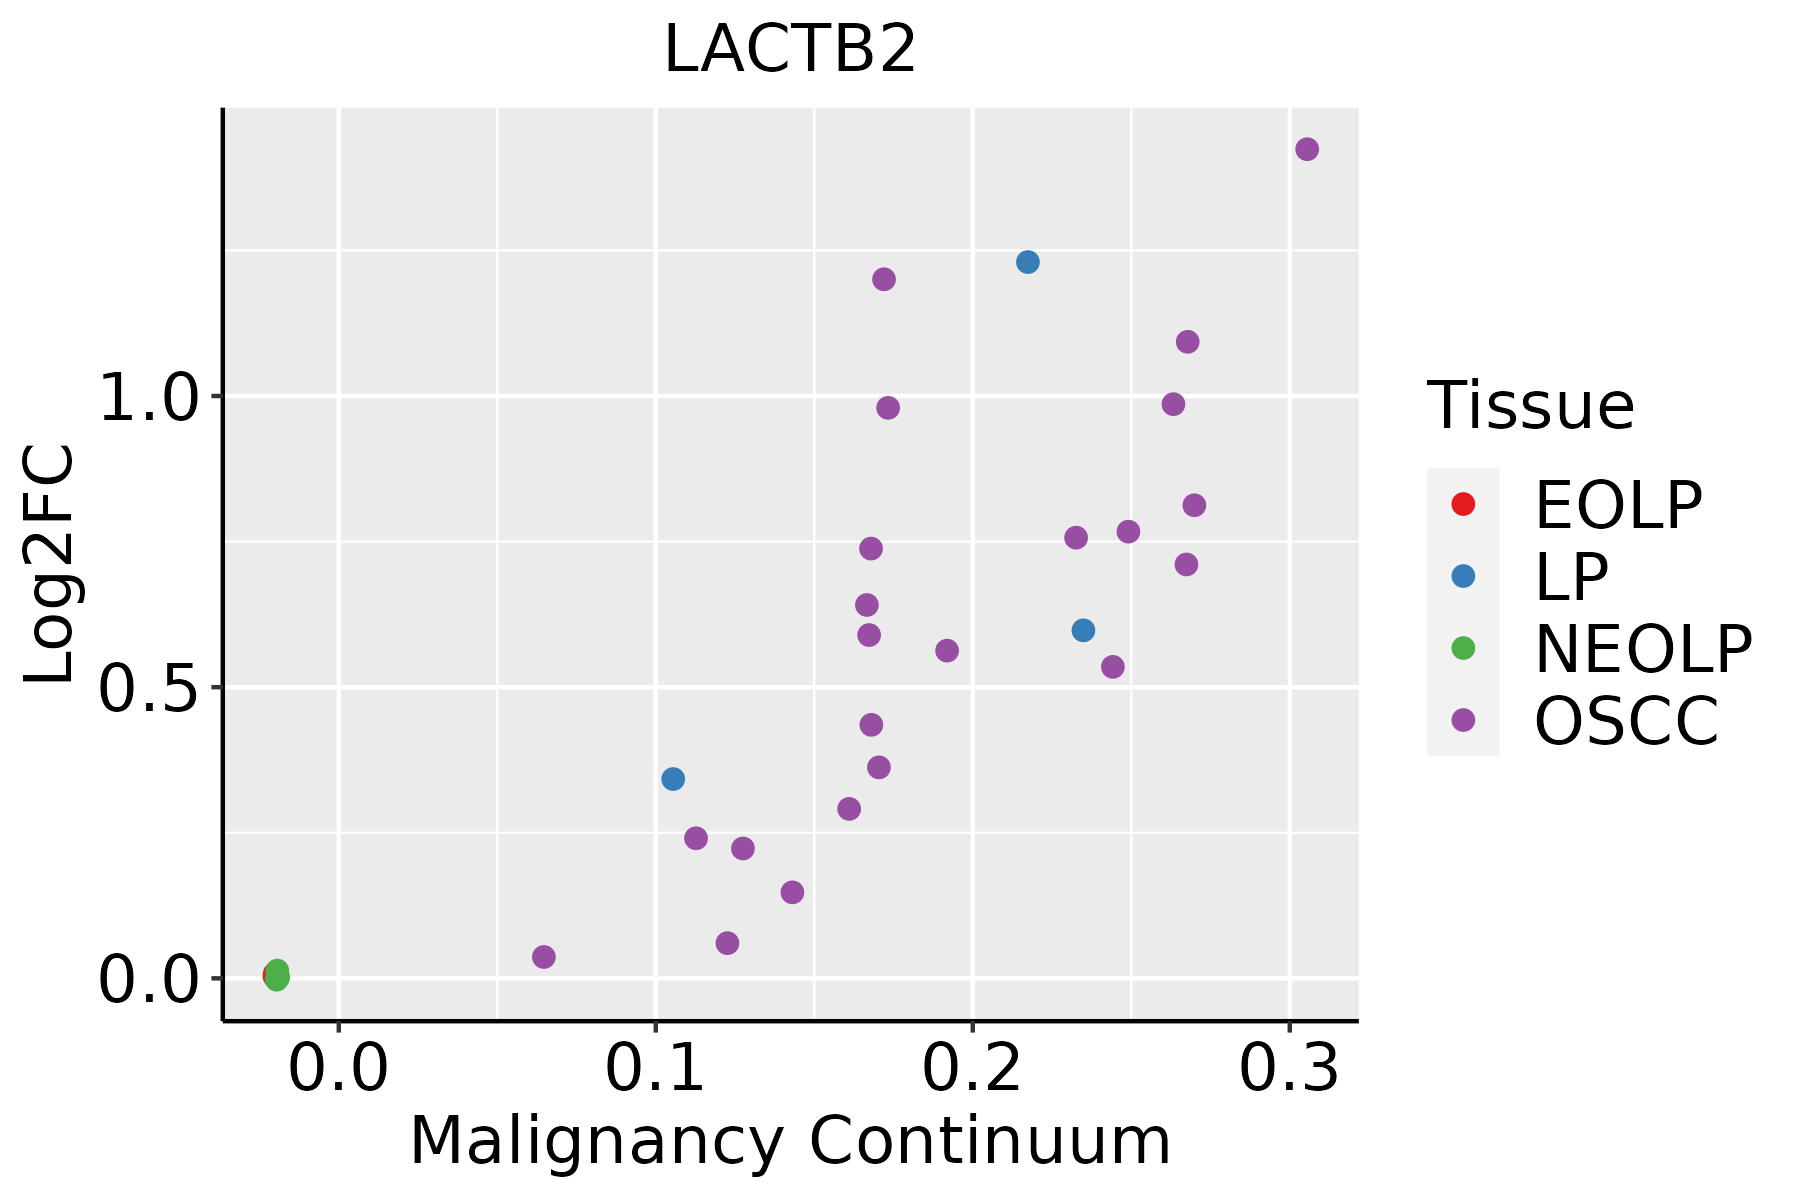 | EOLP: Erosive Oral lichen planus |
| LP: leukoplakia | ||
| NEOLP: Non-erosive oral lichen planus | ||
| OSCC: Oral squamous cell carcinoma | ||
| Skin |  | AK: Actinic keratosis |
| cSCC: Cutaneous squamous cell carcinoma | ||
| SCCIS:squamous cell carcinoma in situ |
| ∗log2FC in expression of this searched gene in stem-like cells from each diseased tissue sample relative to stem-like cells in normal samples in each tissue plotted against the malignancy continuum. Samples are colored based on if they are from different disease stage. |
Top |
Malignant transformation related pathway analysis |
| Find out the enriched GO biological processes and KEGG pathways involved in transition from healthy to precancer to cancer |
| Tissue | Disease Stage | Enriched GO biological Processes |
| Colorectum | AD |  |
| Colorectum | SER |  |
| Colorectum | MSS |  |
| Colorectum | MSI-H |  |
| Colorectum | FAP |  |
| ∗Top 15 enriched GO BP terms are showed in the bar plot of each disease state in each tissue. Each row represents a significant GO biological process which is colored according to the -log10(p.adjust). |
| Page: 1 2 3 4 5 6 7 8 9 |
| GO ID | Tissue | Disease Stage | Description | Gene Ratio | Bg Ratio | pvalue | p.adjust | Count |
| GO:00905013 | Esophagus | ESCC | RNA phosphodiester bond hydrolysis | 110/8552 | 152/18723 | 1.95e-11 | 6.81e-10 | 110 |
| GO:00903053 | Esophagus | ESCC | nucleic acid phosphodiester bond hydrolysis | 163/8552 | 261/18723 | 3.07e-08 | 5.73e-07 | 163 |
| GO:00905023 | Esophagus | ESCC | RNA phosphodiester bond hydrolysis, endonucleolytic | 55/8552 | 82/18723 | 7.34e-05 | 5.51e-04 | 55 |
| GO:0090501 | Liver | Cirrhotic | RNA phosphodiester bond hydrolysis | 54/4634 | 152/18723 | 1.89e-03 | 1.19e-02 | 54 |
| GO:00905011 | Liver | HCC | RNA phosphodiester bond hydrolysis | 101/7958 | 152/18723 | 1.99e-09 | 5.63e-08 | 101 |
| GO:0090305 | Liver | HCC | nucleic acid phosphodiester bond hydrolysis | 152/7958 | 261/18723 | 1.90e-07 | 3.46e-06 | 152 |
| GO:0090502 | Liver | HCC | RNA phosphodiester bond hydrolysis, endonucleolytic | 52/7958 | 82/18723 | 1.06e-04 | 9.08e-04 | 52 |
| GO:00905012 | Oral cavity | OSCC | RNA phosphodiester bond hydrolysis | 95/7305 | 152/18723 | 3.65e-09 | 8.22e-08 | 95 |
| GO:00903052 | Oral cavity | OSCC | nucleic acid phosphodiester bond hydrolysis | 142/7305 | 261/18723 | 2.90e-07 | 4.43e-06 | 142 |
| GO:00905022 | Oral cavity | OSCC | RNA phosphodiester bond hydrolysis, endonucleolytic | 44/7305 | 82/18723 | 4.95e-03 | 1.94e-02 | 44 |
| GO:009050111 | Oral cavity | LP | RNA phosphodiester bond hydrolysis | 63/4623 | 152/18723 | 3.88e-06 | 8.13e-05 | 63 |
| GO:00903051 | Oral cavity | LP | nucleic acid phosphodiester bond hydrolysis | 92/4623 | 261/18723 | 8.07e-05 | 1.04e-03 | 92 |
| GO:00905021 | Oral cavity | LP | RNA phosphodiester bond hydrolysis, endonucleolytic | 31/4623 | 82/18723 | 5.66e-03 | 3.41e-02 | 31 |
| GO:00905014 | Skin | cSCC | RNA phosphodiester bond hydrolysis | 71/4864 | 152/18723 | 2.72e-08 | 7.41e-07 | 71 |
| GO:00903054 | Skin | cSCC | nucleic acid phosphodiester bond hydrolysis | 97/4864 | 261/18723 | 4.08e-05 | 4.34e-04 | 97 |
| GO:00905024 | Skin | cSCC | RNA phosphodiester bond hydrolysis, endonucleolytic | 34/4864 | 82/18723 | 1.58e-03 | 9.75e-03 | 34 |
| Page: 1 |
| Pathway ID | Tissue | Disease Stage | Description | Gene Ratio | Bg Ratio | pvalue | p.adjust | qvalue | Count |
| Page: 1 |
Top |
Cell-cell communication analysis |
| Identification of potential cell-cell interactions between two cell types and their ligand-receptor pairs for different disease states |
| Ligand | Receptor | LRpair | Pathway | Tissue | Disease Stage |
| Page: 1 |
Top |
Single-cell gene regulatory network inference analysis |
| Find out the significant the regulons (TFs) and the target genes of each regulon across cell types for different disease states |
| TF | Cell Type | Tissue | Disease Stage | Target Gene | RSS | Regulon Activity |
| ∗The dot plots of a searched regulon are shown for all cell subpopulations in each disease state of each tissue based on the regulon specific score inferred using pySCENIC and by calculating the average expression. |
| Page: 1 |
Top |
Somatic mutation of malignant transformation related genes |
| Annotation of somatic variants for genes involved in malignant transformation |
| Hugo Symbol | Variant Class | Variant Classification | dbSNP RS | HGVSc | HGVSp | HGVSp Short | SWISSPROT | BIOTYPE | SIFT | PolyPhen | Tumor Sample Barcode | Tissue | Histology | Sex | Age | Stage | Therapy Types | Drugs | Outcome |
| LACTB2 | SNV | Missense_Mutation | c.741G>T | p.Lys247Asn | p.K247N | Q53H82 | protein_coding | deleterious(0.01) | possibly_damaging(0.462) | TCGA-AN-A0AK-01 | Breast | breast invasive carcinoma | Female | >=65 | I/II | Unknown | Unknown | SD | |
| LACTB2 | SNV | Missense_Mutation | novel | c.41N>C | p.Arg14Pro | p.R14P | Q53H82 | protein_coding | deleterious(0) | probably_damaging(0.979) | TCGA-AR-A1AI-01 | Breast | breast invasive carcinoma | Female | <65 | I/II | Chemotherapy | cytoxan | PD |
| LACTB2 | SNV | Missense_Mutation | rs752606703 | c.148N>T | p.Pro50Ser | p.P50S | Q53H82 | protein_coding | tolerated(0.13) | benign(0.234) | TCGA-2W-A8YY-01 | Cervix | cervical & endocervical cancer | Female | <65 | I/II | Chemotherapy | cisplatin | CR |
| LACTB2 | SNV | Missense_Mutation | novel | c.241G>C | p.Asp81His | p.D81H | Q53H82 | protein_coding | deleterious(0) | probably_damaging(1) | TCGA-MA-AA3W-01 | Cervix | cervical & endocervical cancer | Female | <65 | I/II | Chemotherapy | cisplatin | CR |
| LACTB2 | deletion | Frame_Shift_Del | novel | c.862_863delCT | p.Ter289ValfsTer4 | p.*289Vfs*4 | Q53H82 | protein_coding | TCGA-VS-A8EK-01 | Cervix | cervical & endocervical cancer | Female | >=65 | I/II | Chemotherapy | cisplatin | PD | ||
| LACTB2 | SNV | Missense_Mutation | c.258A>G | p.Ile86Met | p.I86M | Q53H82 | protein_coding | tolerated(0.05) | probably_damaging(0.954) | TCGA-AA-3966-01 | Colorectum | colon adenocarcinoma | Female | >=65 | I/II | Unknown | Unknown | SD | |
| LACTB2 | SNV | Missense_Mutation | c.673C>T | p.Leu225Phe | p.L225F | Q53H82 | protein_coding | tolerated(0.08) | possibly_damaging(0.646) | TCGA-CK-5912-01 | Colorectum | colon adenocarcinoma | Male | >=65 | I/II | Unknown | Unknown | SD | |
| LACTB2 | insertion | Frame_Shift_Ins | rs773915769 | c.309_310insA | p.Leu104ThrfsTer28 | p.L104Tfs*28 | Q53H82 | protein_coding | TCGA-AA-3713-01 | Colorectum | colon adenocarcinoma | Male | >=65 | III/IV | Chemotherapy | 5-fluorouracil | PR | ||
| LACTB2 | insertion | Frame_Shift_Ins | rs773915769 | c.309dupA | p.Leu104ThrfsTer28 | p.L104Tfs*28 | Q53H82 | protein_coding | TCGA-AA-A022-01 | Colorectum | colon adenocarcinoma | Female | >=65 | I/II | Unknown | Unknown | SD | ||
| LACTB2 | SNV | Missense_Mutation | c.548N>A | p.Ser183Tyr | p.S183Y | Q53H82 | protein_coding | deleterious(0) | probably_damaging(0.995) | TCGA-AP-A056-01 | Endometrium | uterine corpus endometrioid carcinoma | Female | <65 | I/II | Unknown | Unknown | SD |
| Page: 1 2 3 4 |
Top |
Related drugs of malignant transformation related genes |
| Identification of chemicals and drugs interact with genes involved in malignant transfromation |
| (DGIdb 4.0) |
| Entrez ID | Symbol | Category | Interaction Types | Drug Claim Name | Drug Name | PMIDs |
| Page: 1 |

Copyright 2023-Present -The University of Texas Health Science Center at Houston |