
|
|||||
|
 | |
| |
| |
| |
| |
| |
|
Gene: L3HYPDH |
Gene summary for L3HYPDH |
| Gene information | Species | Human | Gene symbol | L3HYPDH | Gene ID | 112849 |
| Gene name | trans-L-3-hydroxyproline dehydratase | |
| Gene Alias | C14orf149 | |
| Cytomap | 14q23.1 | |
| Gene Type | protein-coding | GO ID | GO:0003674 | UniProtAcc | Q96EM0 |
Top |
Malignant transformation analysis |
| Identification of the aberrant gene expression in precancerous and cancerous lesions by comparing the gene expression of stem-like cells in diseased tissues with normal stem cells |
| Entrez ID | Symbol | Replicates | Species | Organ | Tissue | Adj P-value | Log2FC | Malignancy |
| 112849 | L3HYPDH | LZE4T | Human | Esophagus | ESCC | 1.11e-07 | 2.35e-01 | 0.0811 |
| 112849 | L3HYPDH | LZE22T | Human | Esophagus | ESCC | 5.98e-03 | 3.09e-01 | 0.068 |
| 112849 | L3HYPDH | LZE24T | Human | Esophagus | ESCC | 4.24e-10 | 1.99e-01 | 0.0596 |
| 112849 | L3HYPDH | P2T-E | Human | Esophagus | ESCC | 1.89e-16 | 1.06e-01 | 0.1177 |
| 112849 | L3HYPDH | P4T-E | Human | Esophagus | ESCC | 6.71e-14 | 3.31e-01 | 0.1323 |
| 112849 | L3HYPDH | P5T-E | Human | Esophagus | ESCC | 1.08e-08 | 1.92e-01 | 0.1327 |
| 112849 | L3HYPDH | P8T-E | Human | Esophagus | ESCC | 4.79e-06 | 9.30e-02 | 0.0889 |
| 112849 | L3HYPDH | P9T-E | Human | Esophagus | ESCC | 2.64e-09 | 2.51e-01 | 0.1131 |
| 112849 | L3HYPDH | P10T-E | Human | Esophagus | ESCC | 2.74e-15 | 3.13e-01 | 0.116 |
| 112849 | L3HYPDH | P11T-E | Human | Esophagus | ESCC | 3.93e-07 | 3.88e-01 | 0.1426 |
| 112849 | L3HYPDH | P12T-E | Human | Esophagus | ESCC | 5.70e-13 | 2.62e-01 | 0.1122 |
| 112849 | L3HYPDH | P15T-E | Human | Esophagus | ESCC | 6.75e-27 | 6.63e-01 | 0.1149 |
| 112849 | L3HYPDH | P16T-E | Human | Esophagus | ESCC | 6.31e-06 | 1.31e-01 | 0.1153 |
| 112849 | L3HYPDH | P17T-E | Human | Esophagus | ESCC | 7.04e-03 | 2.27e-01 | 0.1278 |
| 112849 | L3HYPDH | P19T-E | Human | Esophagus | ESCC | 5.36e-05 | 7.18e-01 | 0.1662 |
| 112849 | L3HYPDH | P20T-E | Human | Esophagus | ESCC | 2.25e-10 | 2.87e-01 | 0.1124 |
| 112849 | L3HYPDH | P21T-E | Human | Esophagus | ESCC | 8.11e-12 | 3.27e-01 | 0.1617 |
| 112849 | L3HYPDH | P22T-E | Human | Esophagus | ESCC | 2.72e-10 | 1.79e-01 | 0.1236 |
| 112849 | L3HYPDH | P23T-E | Human | Esophagus | ESCC | 2.28e-07 | 2.36e-01 | 0.108 |
| 112849 | L3HYPDH | P24T-E | Human | Esophagus | ESCC | 3.00e-21 | 4.60e-01 | 0.1287 |
| Page: 1 2 3 4 |
| Tissue | Expression Dynamics | Abbreviation |
| Esophagus | 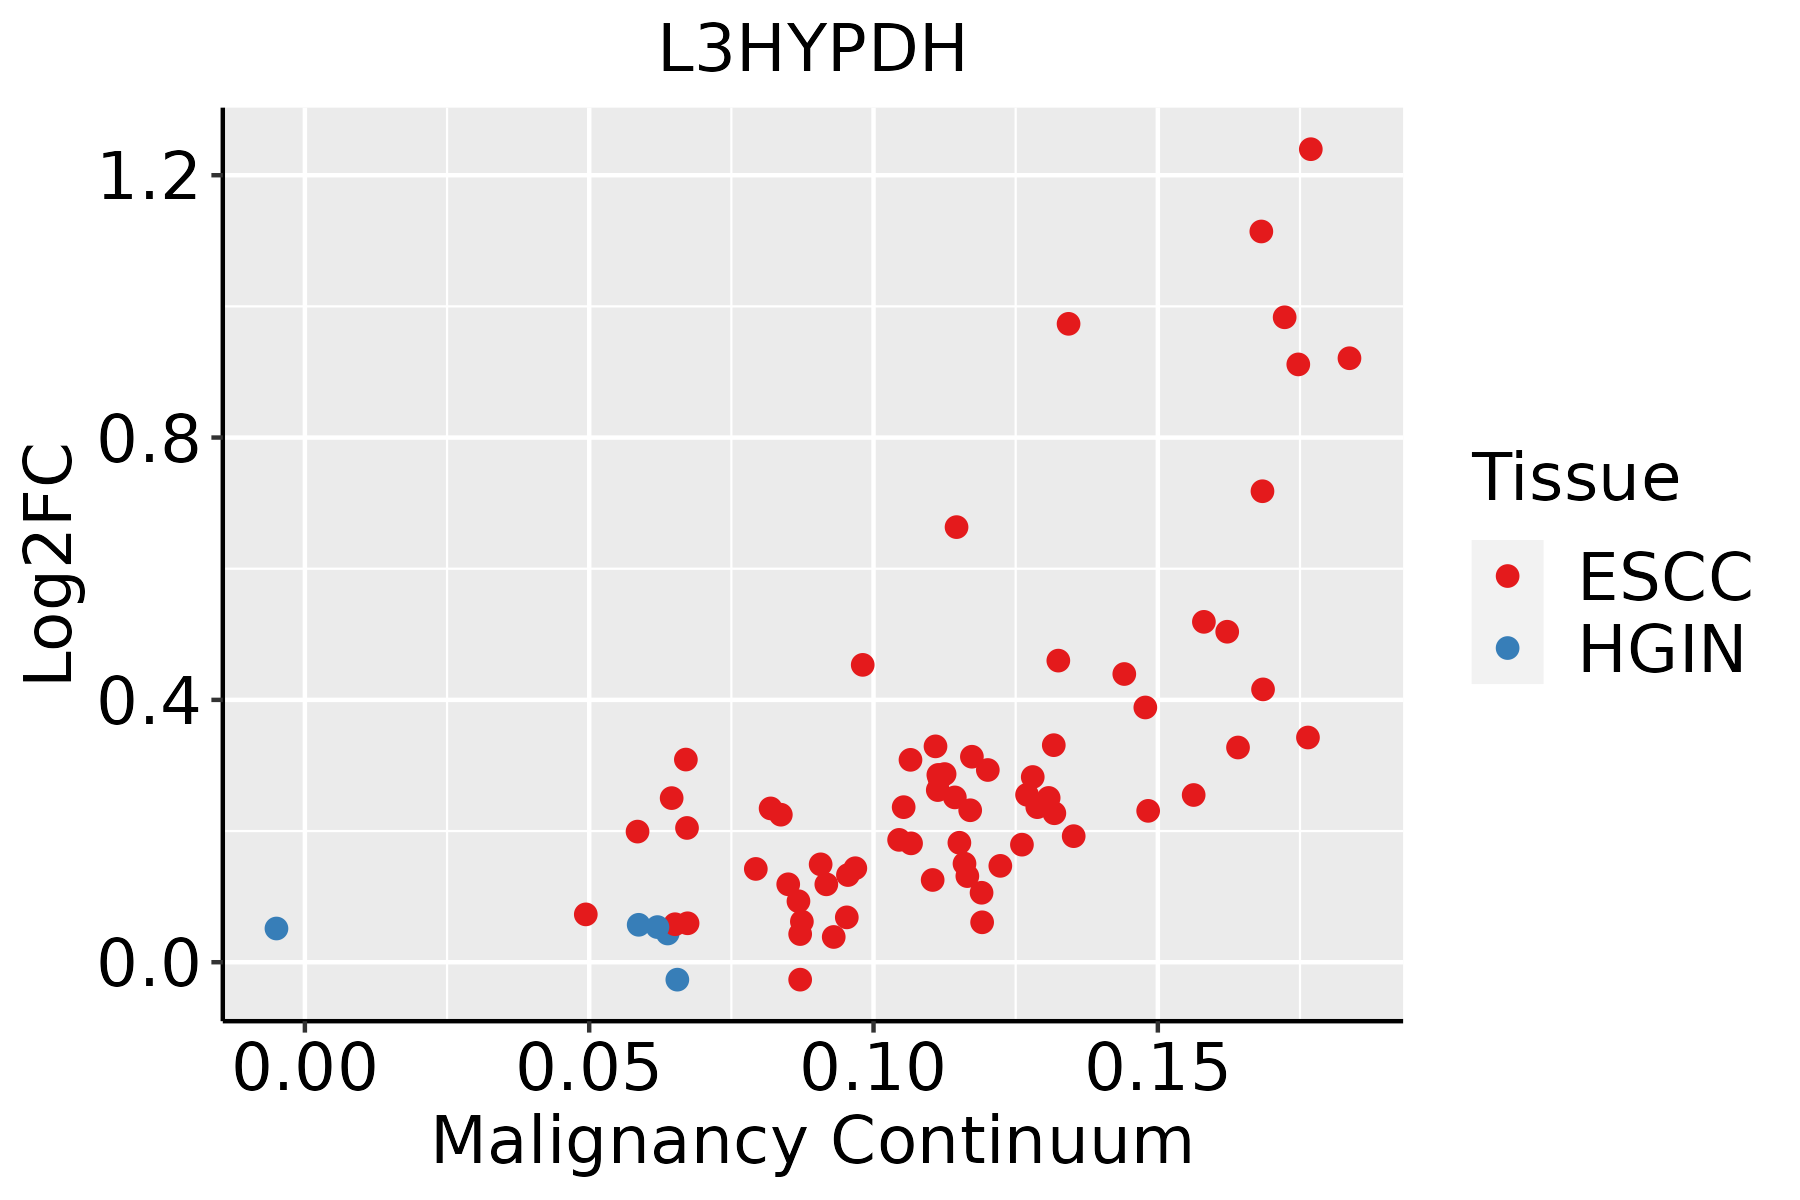 | ESCC: Esophageal squamous cell carcinoma |
| HGIN: High-grade intraepithelial neoplasias | ||
| LGIN: Low-grade intraepithelial neoplasias | ||
| Oral Cavity | 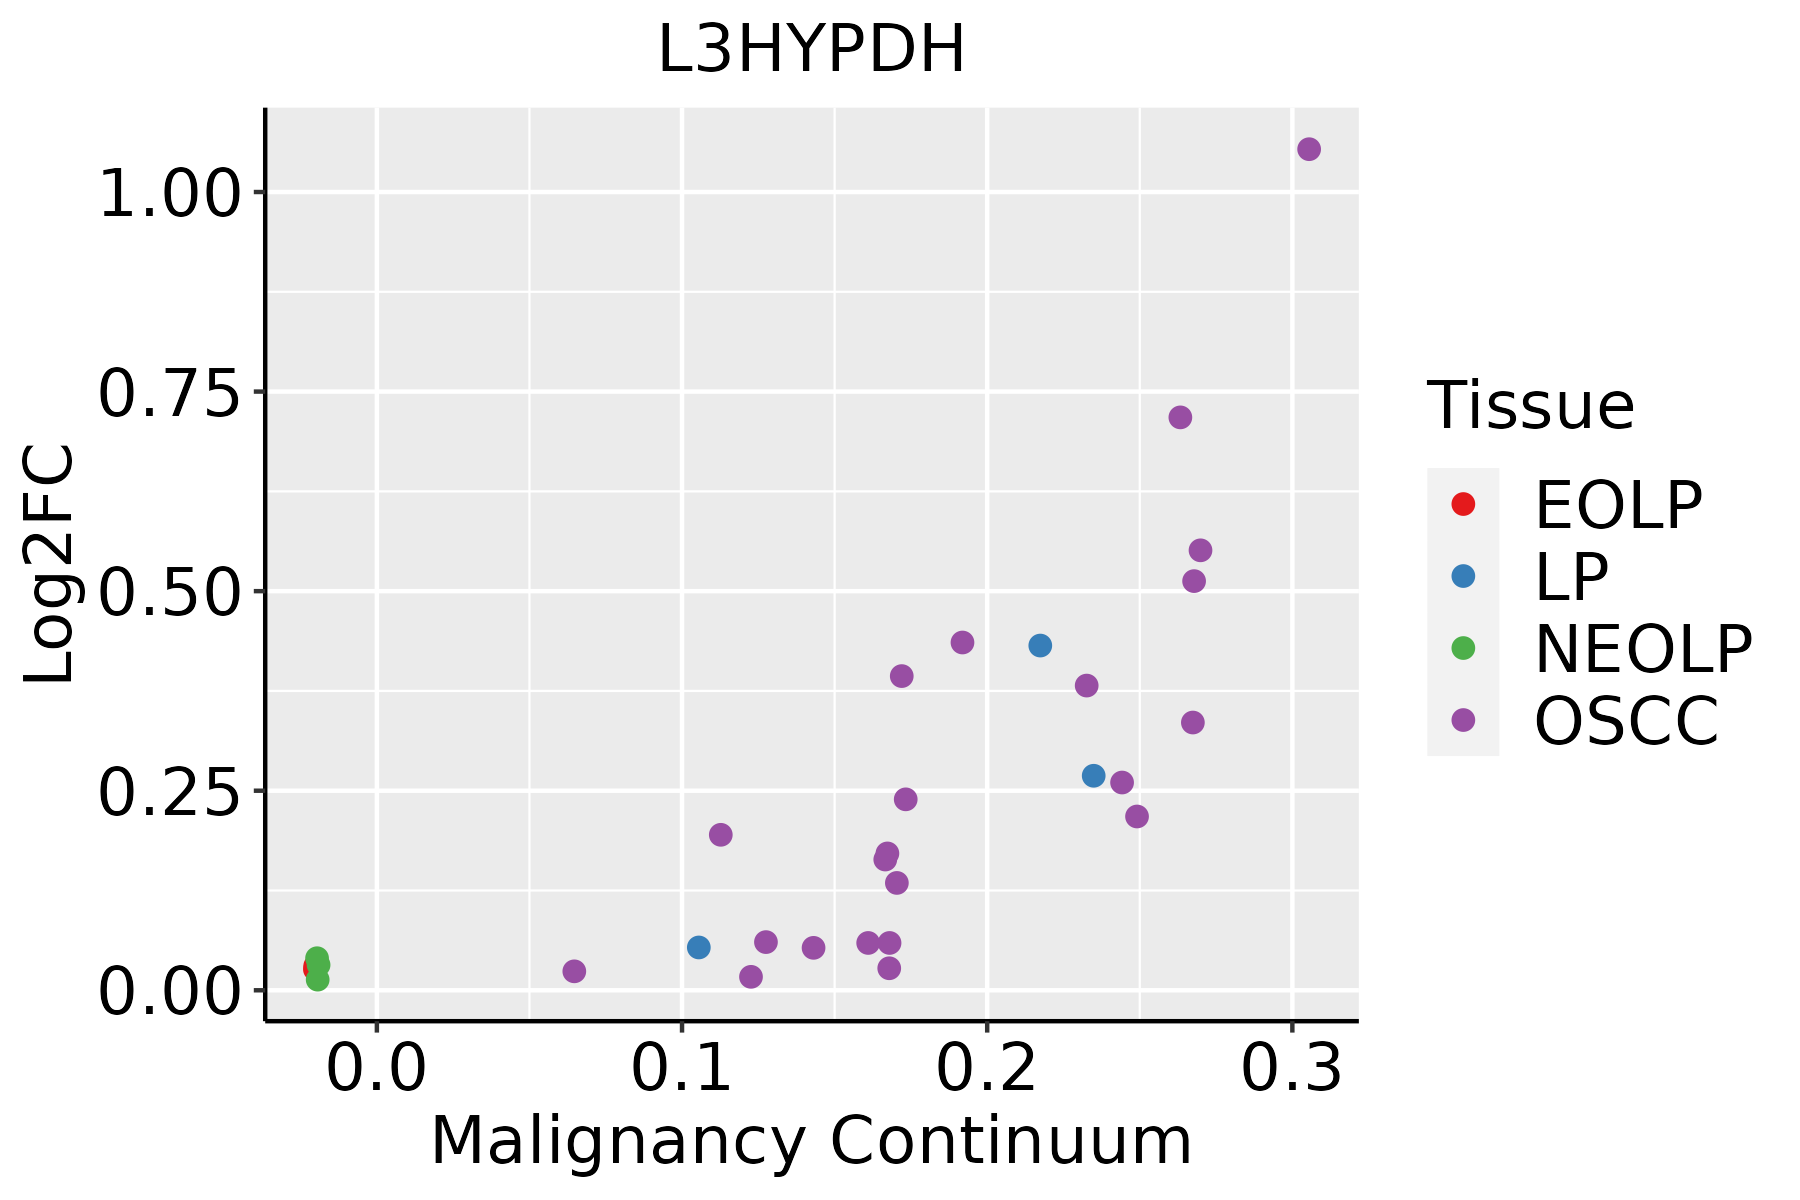 | EOLP: Erosive Oral lichen planus |
| LP: leukoplakia | ||
| NEOLP: Non-erosive oral lichen planus | ||
| OSCC: Oral squamous cell carcinoma |
| ∗log2FC in expression of this searched gene in stem-like cells from each diseased tissue sample relative to stem-like cells in normal samples in each tissue plotted against the malignancy continuum. Samples are colored based on if they are from different disease stage. |
Top |
Malignant transformation related pathway analysis |
| Find out the enriched GO biological processes and KEGG pathways involved in transition from healthy to precancer to cancer |
| Tissue | Disease Stage | Enriched GO biological Processes |
| Colorectum | AD |  |
| Colorectum | SER |  |
| Colorectum | MSS |  |
| Colorectum | MSI-H |  |
| Colorectum | FAP |  |
| ∗Top 15 enriched GO BP terms are showed in the bar plot of each disease state in each tissue. Each row represents a significant GO biological process which is colored according to the -log10(p.adjust). |
| Page: 1 2 3 4 5 6 7 8 9 |
| GO ID | Tissue | Disease Stage | Description | Gene Ratio | Bg Ratio | pvalue | p.adjust | Count |
| Page: 1 |
| Pathway ID | Tissue | Disease Stage | Description | Gene Ratio | Bg Ratio | pvalue | p.adjust | qvalue | Count |
| hsa0033010 | Oral cavity | OSCC | Arginine and proline metabolism | 30/3704 | 50/8465 | 1.50e-02 | 3.26e-02 | 1.66e-02 | 30 |
| hsa0033013 | Oral cavity | OSCC | Arginine and proline metabolism | 30/3704 | 50/8465 | 1.50e-02 | 3.26e-02 | 1.66e-02 | 30 |
| Page: 1 |
Top |
Cell-cell communication analysis |
| Identification of potential cell-cell interactions between two cell types and their ligand-receptor pairs for different disease states |
| Ligand | Receptor | LRpair | Pathway | Tissue | Disease Stage |
| Page: 1 |
Top |
Single-cell gene regulatory network inference analysis |
| Find out the significant the regulons (TFs) and the target genes of each regulon across cell types for different disease states |
| TF | Cell Type | Tissue | Disease Stage | Target Gene | RSS | Regulon Activity |
| ∗The dot plots of a searched regulon are shown for all cell subpopulations in each disease state of each tissue based on the regulon specific score inferred using pySCENIC and by calculating the average expression. |
| Page: 1 |
Top |
Somatic mutation of malignant transformation related genes |
| Annotation of somatic variants for genes involved in malignant transformation |
| Hugo Symbol | Variant Class | Variant Classification | dbSNP RS | HGVSc | HGVSp | HGVSp Short | SWISSPROT | BIOTYPE | SIFT | PolyPhen | Tumor Sample Barcode | Tissue | Histology | Sex | Age | Stage | Therapy Types | Drugs | Outcome |
| L3HYPDH | SNV | Missense_Mutation | c.1041N>C | p.Leu347Phe | p.L347F | Q96EM0 | protein_coding | deleterious(0.01) | possibly_damaging(0.763) | TCGA-A2-A25A-01 | Breast | breast invasive carcinoma | Female | <65 | I/II | Unspecific | Cytoxan | SD | |
| L3HYPDH | SNV | Missense_Mutation | c.862N>T | p.Gly288Trp | p.G288W | Q96EM0 | protein_coding | deleterious(0) | probably_damaging(1) | TCGA-AD-6964-01 | Colorectum | colon adenocarcinoma | Male | <65 | III/IV | Chemotherapy | folfox | PD | |
| L3HYPDH | SNV | Missense_Mutation | c.430N>A | p.Ala144Thr | p.A144T | Q96EM0 | protein_coding | tolerated(0.06) | benign(0.184) | TCGA-G4-6586-01 | Colorectum | colon adenocarcinoma | Female | >=65 | I/II | Unknown | Unknown | SD | |
| L3HYPDH | SNV | Missense_Mutation | rs774827441 | c.524N>C | p.Val175Ala | p.V175A | Q96EM0 | protein_coding | deleterious(0.03) | possibly_damaging(0.811) | TCGA-AX-A2HC-01 | Endometrium | uterine corpus endometrioid carcinoma | Female | <65 | III/IV | Chemotherapy | paclitaxel | PD |
| L3HYPDH | SNV | Missense_Mutation | rs770475089 | c.684N>C | p.Lys228Asn | p.K228N | Q96EM0 | protein_coding | tolerated(0.06) | benign(0.06) | TCGA-B5-A1MR-01 | Endometrium | uterine corpus endometrioid carcinoma | Female | >=65 | III/IV | Unknown | Unknown | SD |
| L3HYPDH | SNV | Missense_Mutation | novel | c.499N>A | p.Leu167Met | p.L167M | Q96EM0 | protein_coding | deleterious(0.02) | benign(0.113) | TCGA-DF-A2KU-01 | Endometrium | uterine corpus endometrioid carcinoma | Female | Unknown | I/II | Unknown | Unknown | SD |
| L3HYPDH | SNV | Missense_Mutation | rs371673690 | c.839N>A | p.Arg280Gln | p.R280Q | Q96EM0 | protein_coding | deleterious(0) | probably_damaging(0.998) | TCGA-EO-A22X-01 | Endometrium | uterine corpus endometrioid carcinoma | Female | <65 | III/IV | Unspecific | Carboplatin | Complete Response |
| L3HYPDH | SNV | Missense_Mutation | novel | c.505A>G | p.Thr169Ala | p.T169A | Q96EM0 | protein_coding | tolerated(0.67) | benign(0.006) | TCGA-4R-AA8I-01 | Liver | liver hepatocellular carcinoma | Male | >=65 | I/II | Unknown | Unknown | PD |
| L3HYPDH | SNV | Missense_Mutation | c.551N>G | p.Asp184Gly | p.D184G | Q96EM0 | protein_coding | deleterious(0.02) | probably_damaging(0.998) | TCGA-35-5375-01 | Lung | lung adenocarcinoma | Male | <65 | III/IV | Unknown | Unknown | SD | |
| L3HYPDH | SNV | Missense_Mutation | novel | c.516N>A | p.Met172Ile | p.M172I | Q96EM0 | protein_coding | tolerated(0.15) | benign(0.001) | TCGA-44-3396-01 | Lung | lung adenocarcinoma | Female | >=65 | III/IV | Chemotherapy | alimta | SD |
| Page: 1 2 3 |
Top |
Related drugs of malignant transformation related genes |
| Identification of chemicals and drugs interact with genes involved in malignant transfromation |
| (DGIdb 4.0) |
| Entrez ID | Symbol | Category | Interaction Types | Drug Claim Name | Drug Name | PMIDs |
| Page: 1 |

Copyright 2023-Present -The University of Texas Health Science Center at Houston |