
|
|||||
|
 | |
| |
| |
| |
| |
| |
|
Gene: L2HGDH |
Gene summary for L2HGDH |
| Gene information | Species | Human | Gene symbol | L2HGDH | Gene ID | 79944 |
| Gene name | L-2-hydroxyglutarate dehydrogenase | |
| Gene Alias | C14orf160 | |
| Cytomap | 14q21.3 | |
| Gene Type | protein-coding | GO ID | GO:0006082 | UniProtAcc | Q9H9P8 |
Top |
Malignant transformation analysis |
| Identification of the aberrant gene expression in precancerous and cancerous lesions by comparing the gene expression of stem-like cells in diseased tissues with normal stem cells |
| Entrez ID | Symbol | Replicates | Species | Organ | Tissue | Adj P-value | Log2FC | Malignancy |
| 79944 | L2HGDH | P1T-E | Human | Esophagus | ESCC | 9.25e-04 | 1.97e-01 | 0.0875 |
| 79944 | L2HGDH | P2T-E | Human | Esophagus | ESCC | 1.88e-04 | 1.13e-01 | 0.1177 |
| 79944 | L2HGDH | P4T-E | Human | Esophagus | ESCC | 8.24e-11 | 2.66e-01 | 0.1323 |
| 79944 | L2HGDH | P8T-E | Human | Esophagus | ESCC | 3.50e-02 | 7.41e-02 | 0.0889 |
| 79944 | L2HGDH | P10T-E | Human | Esophagus | ESCC | 4.12e-11 | 1.92e-01 | 0.116 |
| 79944 | L2HGDH | P11T-E | Human | Esophagus | ESCC | 5.90e-05 | 1.52e-01 | 0.1426 |
| 79944 | L2HGDH | P12T-E | Human | Esophagus | ESCC | 2.05e-07 | 1.37e-01 | 0.1122 |
| 79944 | L2HGDH | P15T-E | Human | Esophagus | ESCC | 4.41e-08 | 1.72e-01 | 0.1149 |
| 79944 | L2HGDH | P16T-E | Human | Esophagus | ESCC | 5.95e-08 | 1.32e-01 | 0.1153 |
| 79944 | L2HGDH | P17T-E | Human | Esophagus | ESCC | 3.94e-02 | 2.13e-01 | 0.1278 |
| 79944 | L2HGDH | P20T-E | Human | Esophagus | ESCC | 5.20e-04 | 1.40e-01 | 0.1124 |
| 79944 | L2HGDH | P21T-E | Human | Esophagus | ESCC | 7.30e-04 | 8.33e-02 | 0.1617 |
| 79944 | L2HGDH | P22T-E | Human | Esophagus | ESCC | 4.17e-05 | 1.11e-01 | 0.1236 |
| 79944 | L2HGDH | P23T-E | Human | Esophagus | ESCC | 4.23e-05 | 1.31e-01 | 0.108 |
| 79944 | L2HGDH | P24T-E | Human | Esophagus | ESCC | 1.96e-05 | 1.47e-01 | 0.1287 |
| 79944 | L2HGDH | P26T-E | Human | Esophagus | ESCC | 9.35e-10 | 1.83e-01 | 0.1276 |
| 79944 | L2HGDH | P27T-E | Human | Esophagus | ESCC | 3.71e-15 | 2.98e-01 | 0.1055 |
| 79944 | L2HGDH | P28T-E | Human | Esophagus | ESCC | 1.76e-12 | 2.31e-01 | 0.1149 |
| 79944 | L2HGDH | P30T-E | Human | Esophagus | ESCC | 2.84e-08 | 3.18e-01 | 0.137 |
| 79944 | L2HGDH | P31T-E | Human | Esophagus | ESCC | 2.06e-08 | 1.57e-01 | 0.1251 |
| Page: 1 2 3 |
| Tissue | Expression Dynamics | Abbreviation |
| Esophagus | 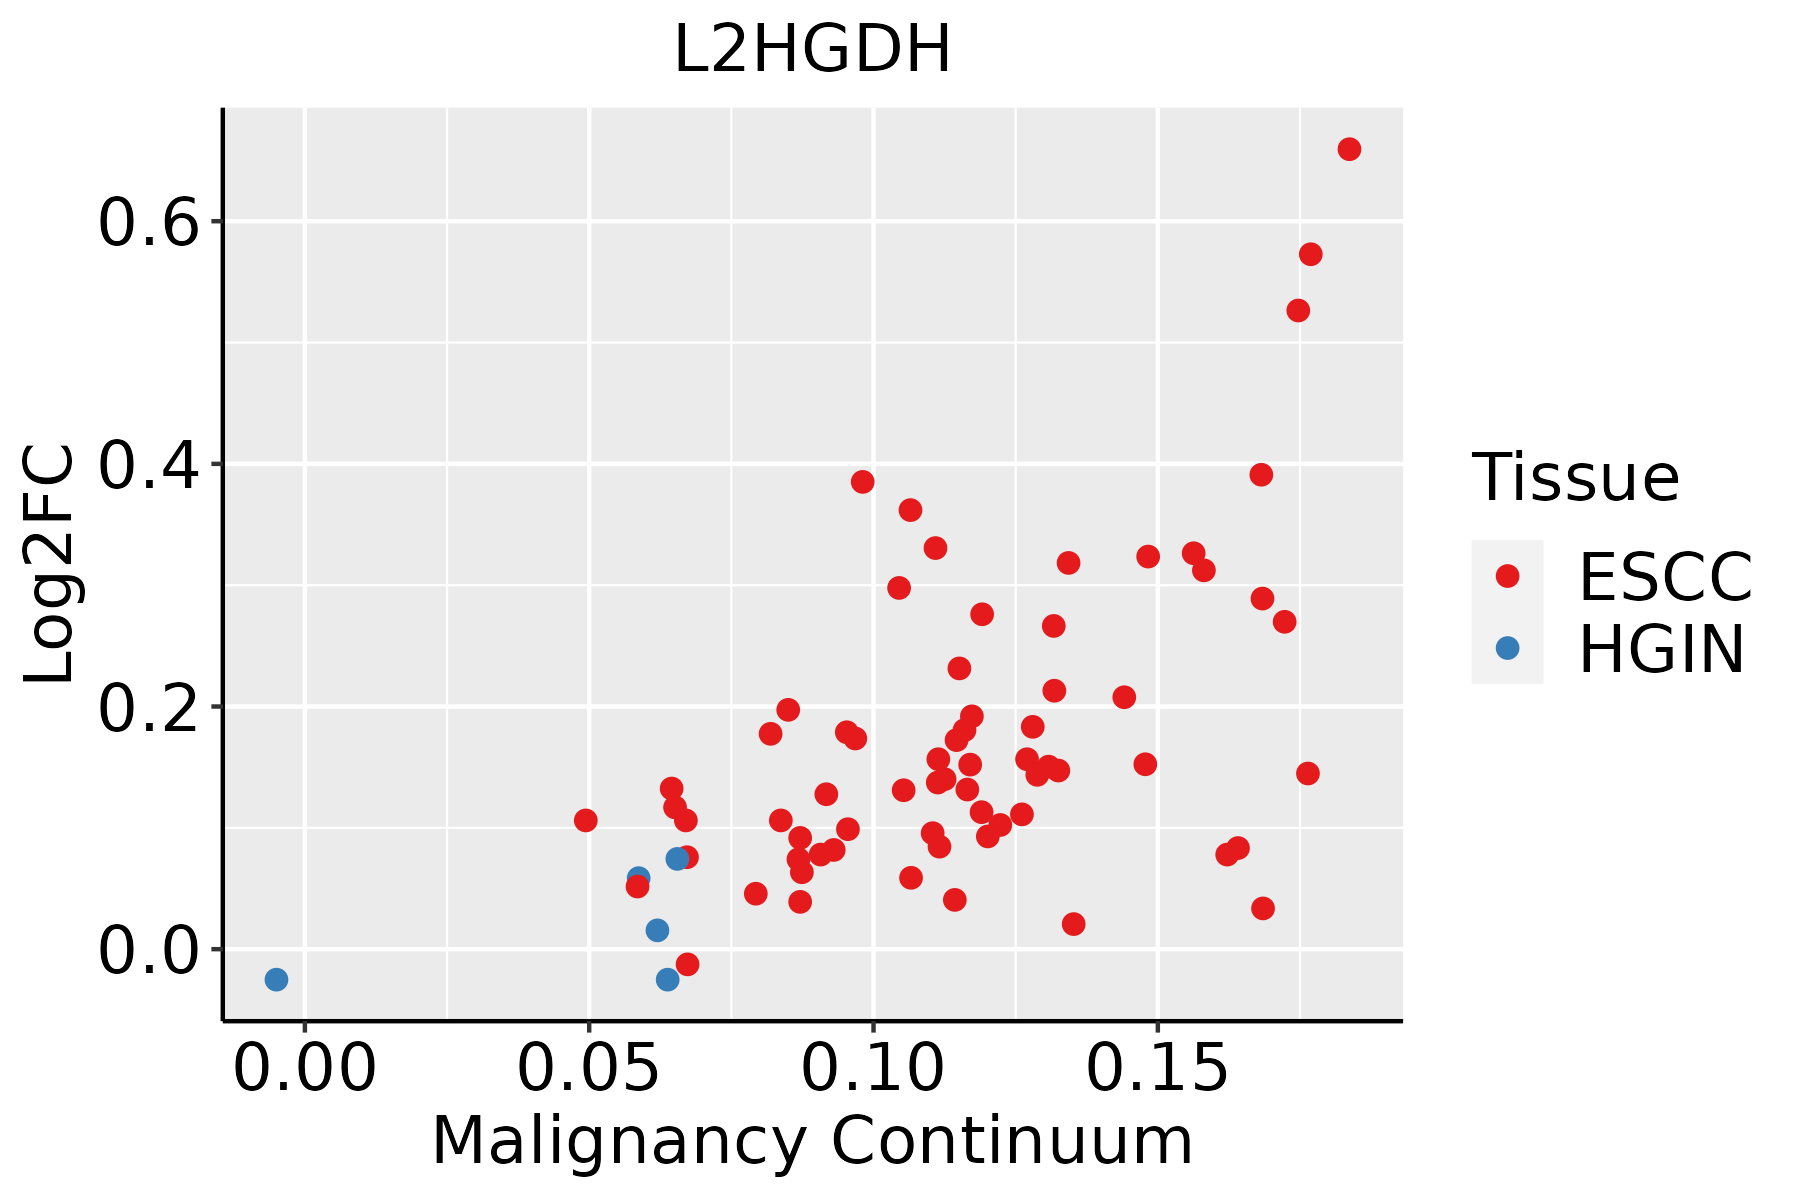 | ESCC: Esophageal squamous cell carcinoma |
| HGIN: High-grade intraepithelial neoplasias | ||
| LGIN: Low-grade intraepithelial neoplasias | ||
| Liver | 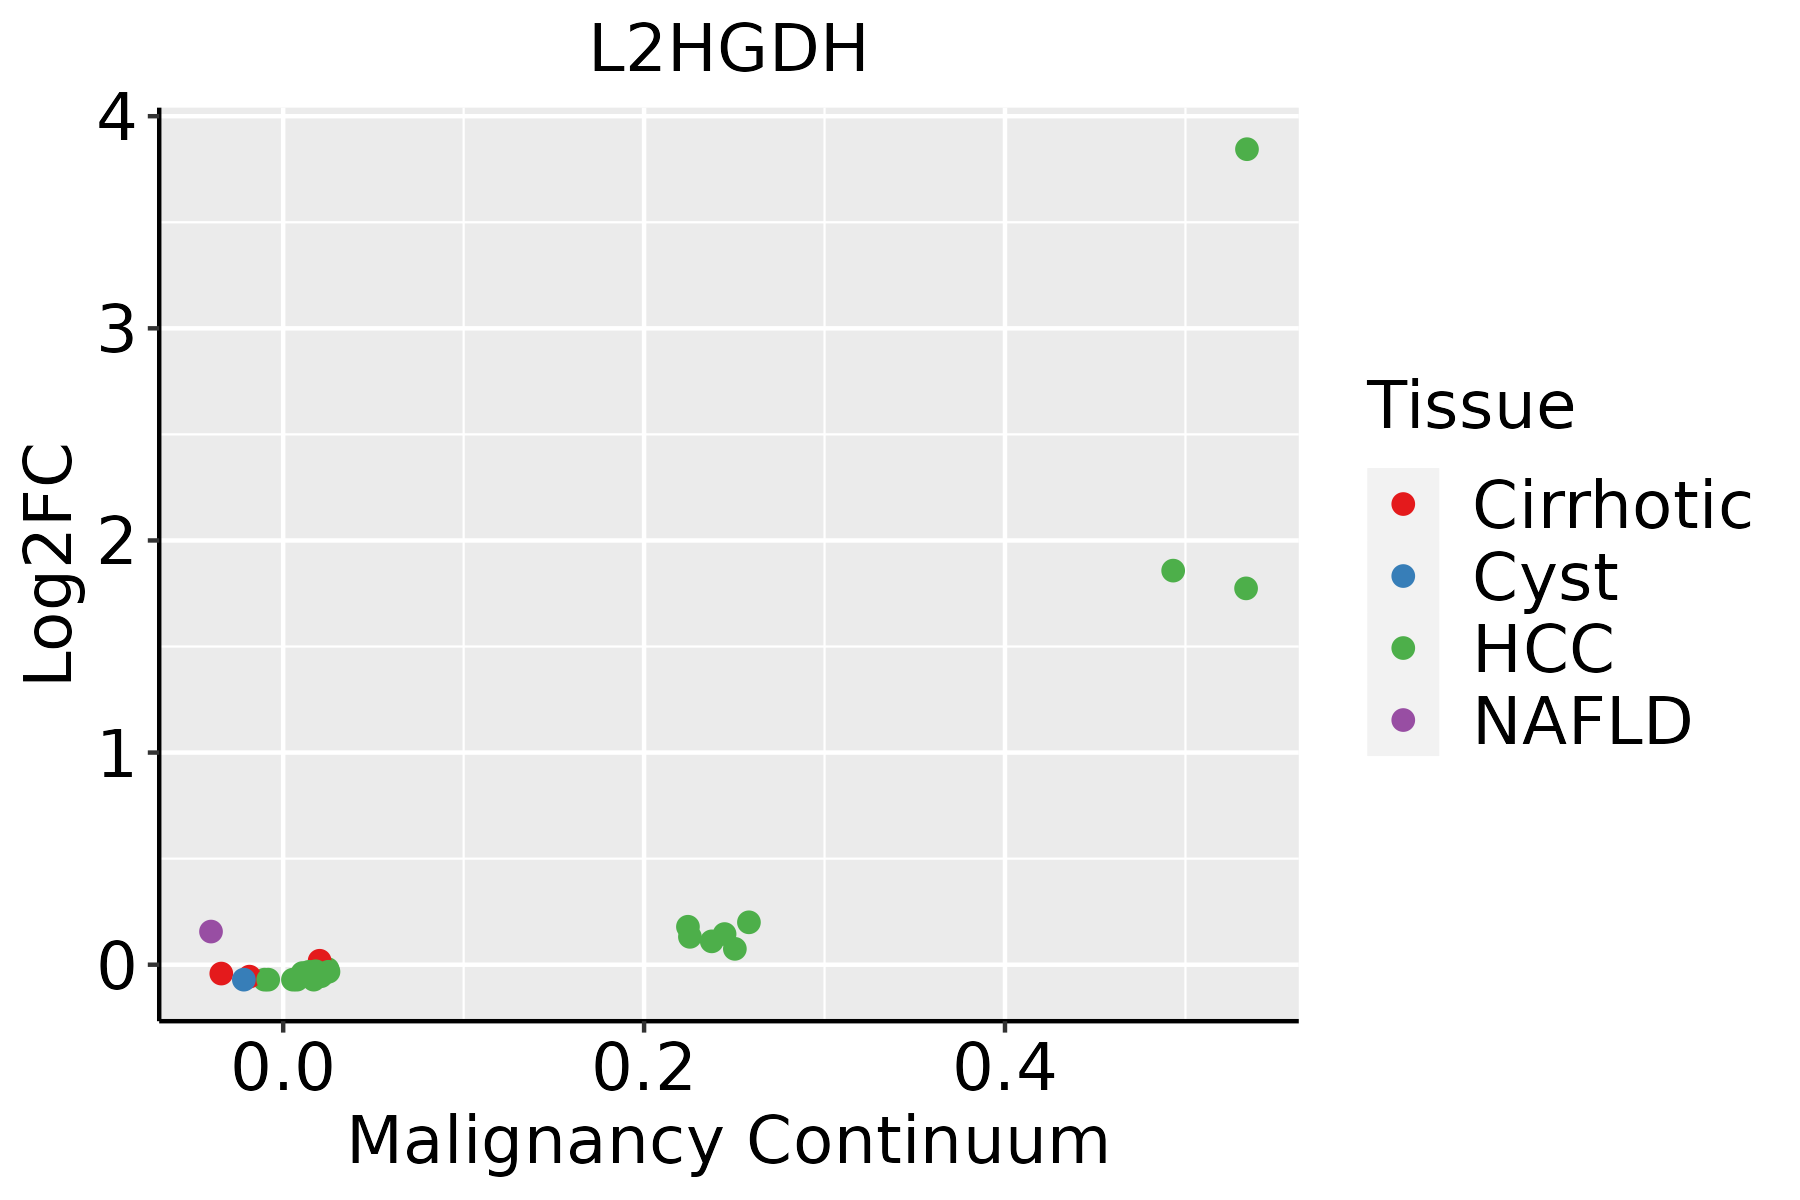 | HCC: Hepatocellular carcinoma |
| NAFLD: Non-alcoholic fatty liver disease |
| ∗log2FC in expression of this searched gene in stem-like cells from each diseased tissue sample relative to stem-like cells in normal samples in each tissue plotted against the malignancy continuum. Samples are colored based on if they are from different disease stage. |
Top |
Malignant transformation related pathway analysis |
| Find out the enriched GO biological processes and KEGG pathways involved in transition from healthy to precancer to cancer |
| Tissue | Disease Stage | Enriched GO biological Processes |
| Colorectum | AD |  |
| Colorectum | SER |  |
| Colorectum | MSS |  |
| Colorectum | MSI-H |  |
| Colorectum | FAP |  |
| ∗Top 15 enriched GO BP terms are showed in the bar plot of each disease state in each tissue. Each row represents a significant GO biological process which is colored according to the -log10(p.adjust). |
| Page: 1 2 3 4 5 6 7 8 9 |
| GO ID | Tissue | Disease Stage | Description | Gene Ratio | Bg Ratio | pvalue | p.adjust | Count |
| GO:00436485 | Esophagus | ESCC | dicarboxylic acid metabolic process | 58/8552 | 96/18723 | 2.55e-03 | 1.09e-02 | 58 |
| GO:00436482 | Liver | HCC | dicarboxylic acid metabolic process | 68/7958 | 96/18723 | 1.73e-08 | 4.14e-07 | 68 |
| GO:00061031 | Liver | HCC | 2-oxoglutarate metabolic process | 14/7958 | 18/18723 | 2.57e-03 | 1.23e-02 | 14 |
| Page: 1 |
| Pathway ID | Tissue | Disease Stage | Description | Gene Ratio | Bg Ratio | pvalue | p.adjust | qvalue | Count |
| hsa006504 | Liver | HCC | Butanoate metabolism | 19/4020 | 27/8465 | 1.37e-02 | 3.33e-02 | 1.85e-02 | 19 |
| hsa006505 | Liver | HCC | Butanoate metabolism | 19/4020 | 27/8465 | 1.37e-02 | 3.33e-02 | 1.85e-02 | 19 |
| Page: 1 |
Top |
Cell-cell communication analysis |
| Identification of potential cell-cell interactions between two cell types and their ligand-receptor pairs for different disease states |
| Ligand | Receptor | LRpair | Pathway | Tissue | Disease Stage |
| Page: 1 |
Top |
Single-cell gene regulatory network inference analysis |
| Find out the significant the regulons (TFs) and the target genes of each regulon across cell types for different disease states |
| TF | Cell Type | Tissue | Disease Stage | Target Gene | RSS | Regulon Activity |
| ∗The dot plots of a searched regulon are shown for all cell subpopulations in each disease state of each tissue based on the regulon specific score inferred using pySCENIC and by calculating the average expression. |
| Page: 1 |
Top |
Somatic mutation of malignant transformation related genes |
| Annotation of somatic variants for genes involved in malignant transformation |
| Hugo Symbol | Variant Class | Variant Classification | dbSNP RS | HGVSc | HGVSp | HGVSp Short | SWISSPROT | BIOTYPE | SIFT | PolyPhen | Tumor Sample Barcode | Tissue | Histology | Sex | Age | Stage | Therapy Types | Drugs | Outcome |
| L2HGDH | SNV | Missense_Mutation | c.322N>A | p.Leu108Met | p.L108M | Q9H9P8 | protein_coding | tolerated(0.12) | probably_damaging(0.971) | TCGA-A2-A0EY-01 | Breast | breast invasive carcinoma | Female | <65 | I/II | Chemotherapy | adriamycin | SD | |
| L2HGDH | insertion | Frame_Shift_Ins | novel | c.747_748insTCCCCAT | p.Ile250SerfsTer28 | p.I250Sfs*28 | Q9H9P8 | protein_coding | TCGA-A2-A0CX-01 | Breast | breast invasive carcinoma | Female | <65 | I/II | Chemotherapy | adriamycin | SD | ||
| L2HGDH | insertion | Nonsense_Mutation | novel | c.745_746insTCTTTCTTGATACTCTACTTATTGGGTA | p.Glu249ValfsTer10 | p.E249Vfs*10 | Q9H9P8 | protein_coding | TCGA-A2-A0CX-01 | Breast | breast invasive carcinoma | Female | <65 | I/II | Chemotherapy | adriamycin | SD | ||
| L2HGDH | SNV | Missense_Mutation | novel | c.1377N>C | p.Gln459His | p.Q459H | Q9H9P8 | protein_coding | tolerated(0.17) | benign(0.003) | TCGA-2W-A8YY-01 | Cervix | cervical & endocervical cancer | Female | <65 | I/II | Chemotherapy | cisplatin | CR |
| L2HGDH | SNV | Missense_Mutation | rs767037296 | c.752N>A | p.Arg251Gln | p.R251Q | Q9H9P8 | protein_coding | tolerated(0.38) | benign(0.009) | TCGA-C5-A8XJ-01 | Cervix | cervical & endocervical cancer | Female | >=65 | I/II | Chemotherapy | cisplatin | SD |
| L2HGDH | SNV | Missense_Mutation | novel | c.424N>A | p.Glu142Lys | p.E142K | Q9H9P8 | protein_coding | tolerated(0.13) | benign(0.168) | TCGA-Q1-A5R2-01 | Cervix | cervical & endocervical cancer | Female | <65 | I/II | Chemotherapy | cisplatin | PR |
| L2HGDH | SNV | Missense_Mutation | novel | c.1196G>A | p.Arg399Lys | p.R399K | Q9H9P8 | protein_coding | tolerated(0.11) | possibly_damaging(0.627) | TCGA-VS-A9V3-01 | Cervix | cervical & endocervical cancer | Female | <65 | I/II | Chemotherapy | cisplatin | PD |
| L2HGDH | SNV | Missense_Mutation | novel | c.816N>G | p.Cys272Trp | p.C272W | Q9H9P8 | protein_coding | deleterious(0) | probably_damaging(0.999) | TCGA-AA-3685-01 | Colorectum | colon adenocarcinoma | Male | >=65 | I/II | Unknown | Unknown | SD |
| L2HGDH | SNV | Missense_Mutation | c.794N>A | p.Arg265His | p.R265H | Q9H9P8 | protein_coding | deleterious(0.01) | probably_damaging(0.998) | TCGA-AA-A01X-01 | Colorectum | colon adenocarcinoma | Female | >=65 | III/IV | Unknown | Unknown | PD | |
| L2HGDH | SNV | Missense_Mutation | rs777273857 | c.798T>G | p.Ile266Met | p.I266M | Q9H9P8 | protein_coding | tolerated(0.08) | benign(0.142) | TCGA-EI-6917-01 | Colorectum | rectum adenocarcinoma | Male | <65 | III/IV | Chemotherapy | 5fluorouracil+oxaciplatina+l-folinian | SD |
| Page: 1 2 3 4 |
Top |
Related drugs of malignant transformation related genes |
| Identification of chemicals and drugs interact with genes involved in malignant transfromation |
| (DGIdb 4.0) |
| Entrez ID | Symbol | Category | Interaction Types | Drug Claim Name | Drug Name | PMIDs |
| Page: 1 |

Copyright 2023-Present -The University of Texas Health Science Center at Houston |