
|
|||||
|
 | |
| |
| |
| |
| |
| |
|
Gene: L1CAM |
Gene summary for L1CAM |
| Gene information | Species | Human | Gene symbol | L1CAM | Gene ID | 3897 |
| Gene name | L1 cell adhesion molecule | |
| Gene Alias | CAML1 | |
| Cytomap | Xq28 | |
| Gene Type | protein-coding | GO ID | GO:0000902 | UniProtAcc | P32004 |
Top |
Malignant transformation analysis |
| Identification of the aberrant gene expression in precancerous and cancerous lesions by comparing the gene expression of stem-like cells in diseased tissues with normal stem cells |
| Entrez ID | Symbol | Replicates | Species | Organ | Tissue | Adj P-value | Log2FC | Malignancy |
| 3897 | L1CAM | P11T-E | Human | Esophagus | ESCC | 1.78e-13 | 1.06e+00 | 0.1426 |
| 3897 | L1CAM | P19T-E | Human | Esophagus | ESCC | 1.53e-21 | 1.64e+00 | 0.1662 |
| 3897 | L1CAM | P21T-E | Human | Esophagus | ESCC | 2.86e-20 | 5.37e-01 | 0.1617 |
| 3897 | L1CAM | P24T-E | Human | Esophagus | ESCC | 1.88e-04 | 2.79e-01 | 0.1287 |
| 3897 | L1CAM | P32T-E | Human | Esophagus | ESCC | 9.44e-07 | 2.22e-01 | 0.1666 |
| 3897 | L1CAM | P37T-E | Human | Esophagus | ESCC | 4.27e-06 | 1.59e-01 | 0.1371 |
| 3897 | L1CAM | P44T-E | Human | Esophagus | ESCC | 4.95e-07 | 4.32e-01 | 0.1096 |
| 3897 | L1CAM | P76T-E | Human | Esophagus | ESCC | 2.02e-06 | 2.67e-01 | 0.1207 |
| 3897 | L1CAM | P89T-E | Human | Esophagus | ESCC | 5.33e-06 | 6.05e-01 | 0.1752 |
| 3897 | L1CAM | P107T-E | Human | Esophagus | ESCC | 2.29e-16 | 4.05e-01 | 0.171 |
| 3897 | L1CAM | P126T-E | Human | Esophagus | ESCC | 5.94e-06 | 3.96e-01 | 0.1125 |
| 3897 | L1CAM | P130T-E | Human | Esophagus | ESCC | 3.90e-42 | 7.11e-01 | 0.1676 |
| 3897 | L1CAM | ATC11 | Human | Thyroid | ATC | 7.49e-03 | 8.53e-01 | 0.3386 |
| 3897 | L1CAM | ATC1 | Human | Thyroid | ATC | 4.70e-02 | 2.20e-01 | 0.2878 |
| 3897 | L1CAM | ATC3 | Human | Thyroid | ATC | 6.30e-07 | 8.98e-01 | 0.338 |
| Page: 1 |
| Tissue | Expression Dynamics | Abbreviation |
| Esophagus |  | ESCC: Esophageal squamous cell carcinoma |
| HGIN: High-grade intraepithelial neoplasias | ||
| LGIN: Low-grade intraepithelial neoplasias | ||
| Thyroid | 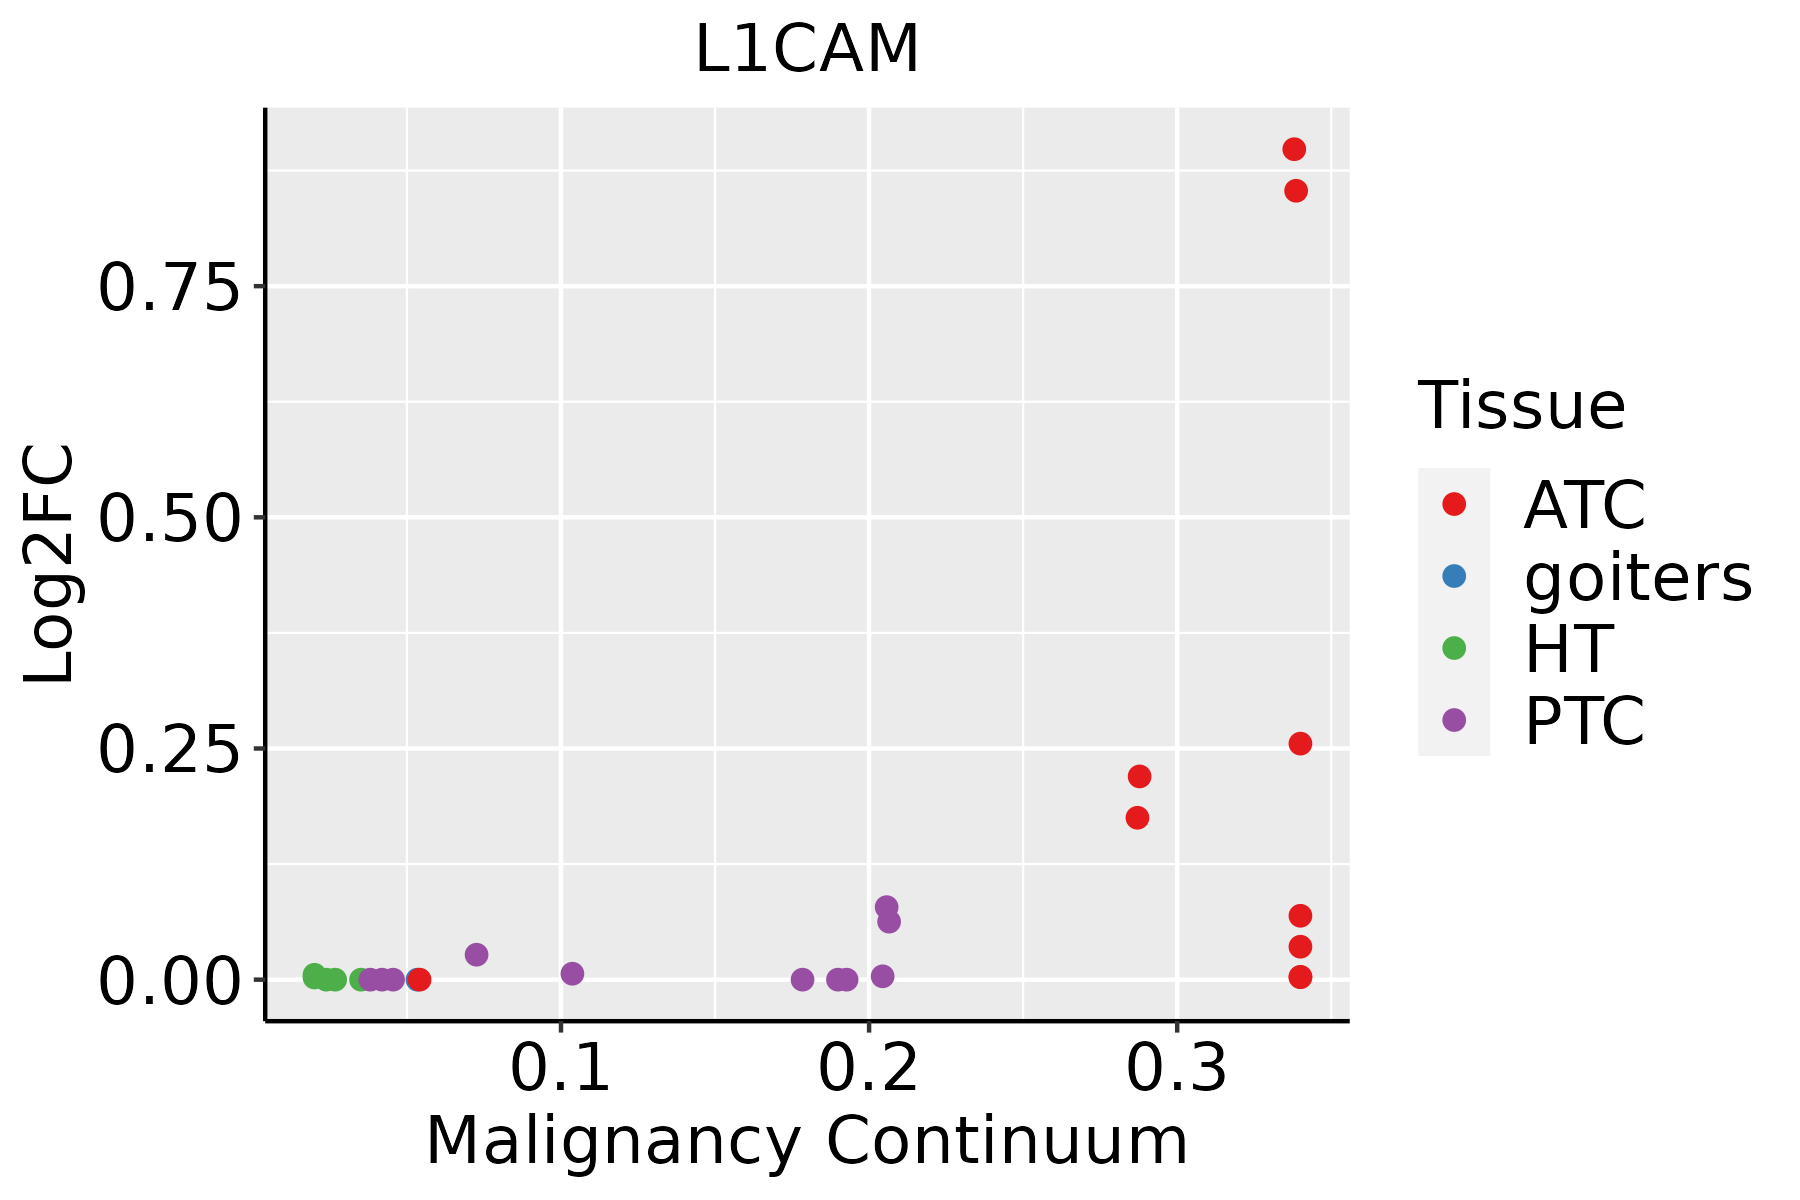 | ATC: Anaplastic thyroid cancer |
| HT: Hashimoto's thyroiditis | ||
| PTC: Papillary thyroid cancer |
| ∗log2FC in expression of this searched gene in stem-like cells from each diseased tissue sample relative to stem-like cells in normal samples in each tissue plotted against the malignancy continuum. Samples are colored based on if they are from different disease stage. |
Top |
Malignant transformation related pathway analysis |
| Find out the enriched GO biological processes and KEGG pathways involved in transition from healthy to precancer to cancer |
| Tissue | Disease Stage | Enriched GO biological Processes |
| Colorectum | AD |  |
| Colorectum | SER |  |
| Colorectum | MSS |  |
| Colorectum | MSI-H |  |
| Colorectum | FAP |  |
| ∗Top 15 enriched GO BP terms are showed in the bar plot of each disease state in each tissue. Each row represents a significant GO biological process which is colored according to the -log10(p.adjust). |
| Page: 1 2 3 4 5 6 7 8 9 |
| GO ID | Tissue | Disease Stage | Description | Gene Ratio | Bg Ratio | pvalue | p.adjust | Count |
| GO:0016049110 | Esophagus | ESCC | cell growth | 289/8552 | 482/18723 | 1.29e-10 | 3.77e-09 | 289 |
| GO:000155819 | Esophagus | ESCC | regulation of cell growth | 248/8552 | 414/18723 | 2.97e-09 | 6.45e-08 | 248 |
| GO:003158919 | Esophagus | ESCC | cell-substrate adhesion | 221/8552 | 363/18723 | 3.06e-09 | 6.62e-08 | 221 |
| GO:003253520 | Esophagus | ESCC | regulation of cellular component size | 227/8552 | 383/18723 | 4.77e-08 | 8.60e-07 | 227 |
| GO:000716018 | Esophagus | ESCC | cell-matrix adhesion | 141/8552 | 233/18723 | 3.33e-06 | 3.71e-05 | 141 |
| GO:003134616 | Esophagus | ESCC | positive regulation of cell projection organization | 201/8552 | 353/18723 | 1.19e-05 | 1.11e-04 | 201 |
| GO:001072010 | Esophagus | ESCC | positive regulation of cell development | 172/8552 | 298/18723 | 1.74e-05 | 1.55e-04 | 172 |
| GO:005076710 | Esophagus | ESCC | regulation of neurogenesis | 203/8552 | 364/18723 | 6.10e-05 | 4.68e-04 | 203 |
| GO:00507697 | Esophagus | ESCC | positive regulation of neurogenesis | 131/8552 | 225/18723 | 9.71e-05 | 6.90e-04 | 131 |
| GO:003030710 | Esophagus | ESCC | positive regulation of cell growth | 100/8552 | 166/18723 | 1.07e-04 | 7.55e-04 | 100 |
| GO:00083619 | Esophagus | ESCC | regulation of cell size | 107/8552 | 181/18723 | 1.81e-04 | 1.16e-03 | 107 |
| GO:006156415 | Esophagus | ESCC | axon development | 251/8552 | 467/18723 | 2.41e-04 | 1.49e-03 | 251 |
| GO:001097516 | Esophagus | ESCC | regulation of neuron projection development | 240/8552 | 445/18723 | 2.48e-04 | 1.53e-03 | 240 |
| GO:00519606 | Esophagus | ESCC | regulation of nervous system development | 237/8552 | 443/18723 | 5.02e-04 | 2.78e-03 | 237 |
| GO:006056010 | Esophagus | ESCC | developmental growth involved in morphogenesis | 131/8552 | 234/18723 | 9.28e-04 | 4.73e-03 | 131 |
| GO:00519625 | Esophagus | ESCC | positive regulation of nervous system development | 149/8552 | 272/18723 | 1.50e-03 | 7.06e-03 | 149 |
| GO:00457738 | Esophagus | ESCC | positive regulation of axon extension | 29/8552 | 42/18723 | 1.87e-03 | 8.46e-03 | 29 |
| GO:000740915 | Esophagus | ESCC | axonogenesis | 219/8552 | 418/18723 | 3.14e-03 | 1.31e-02 | 219 |
| GO:00507728 | Esophagus | ESCC | positive regulation of axonogenesis | 48/8552 | 79/18723 | 4.93e-03 | 1.89e-02 | 48 |
| GO:004858810 | Esophagus | ESCC | developmental cell growth | 125/8552 | 234/18723 | 1.01e-02 | 3.46e-02 | 125 |
| Page: 1 2 3 |
| Pathway ID | Tissue | Disease Stage | Description | Gene Ratio | Bg Ratio | pvalue | p.adjust | qvalue | Count |
| hsa0436016 | Esophagus | ESCC | Axon guidance | 108/4205 | 182/8465 | 5.13e-03 | 1.30e-02 | 6.67e-03 | 108 |
| hsa0436017 | Esophagus | ESCC | Axon guidance | 108/4205 | 182/8465 | 5.13e-03 | 1.30e-02 | 6.67e-03 | 108 |
| Page: 1 |
Top |
Cell-cell communication analysis |
| Identification of potential cell-cell interactions between two cell types and their ligand-receptor pairs for different disease states |
| Ligand | Receptor | LRpair | Pathway | Tissue | Disease Stage |
| NCAM1 | L1CAM | NCAM1_L1CAM | NCAM | Esophagus | ESCC |
| NCAM2 | L1CAM | NCAM2_L1CAM | NCAM | Esophagus | ESCC |
| L1CAM | L1CAM | L1CAM_L1CAM | L1CAM | Esophagus | ESCC |
| NCAM1 | L1CAM | NCAM1_L1CAM | NCAM | Prostate | BPH |
| L1CAM | ITGA4_ITGB7 | L1CAM_ITGA4_ITGB7 | L1CAM | Prostate | BPH |
| L1CAM | L1CAM | L1CAM_L1CAM | L1CAM | Prostate | BPH |
| NCAM1 | L1CAM | NCAM1_L1CAM | NCAM | Prostate | Healthy |
| L1CAM | L1CAM | L1CAM_L1CAM | L1CAM | Prostate | Healthy |
| NCAM1 | L1CAM | NCAM1_L1CAM | NCAM | Prostate | Tumor |
| L1CAM | ITGA4_ITGB7 | L1CAM_ITGA4_ITGB7 | L1CAM | Prostate | Tumor |
| L1CAM | L1CAM | L1CAM_L1CAM | L1CAM | Prostate | Tumor |
| NCAM1 | L1CAM | NCAM1_L1CAM | NCAM | Skin | SCCIS |
| NCAM2 | L1CAM | NCAM2_L1CAM | NCAM | Skin | SCCIS |
| L1CAM | L1CAM | L1CAM_L1CAM | L1CAM | Skin | SCCIS |
| Page: 1 |
Top |
Single-cell gene regulatory network inference analysis |
| Find out the significant the regulons (TFs) and the target genes of each regulon across cell types for different disease states |
| TF | Cell Type | Tissue | Disease Stage | Target Gene | RSS | Regulon Activity |
| ∗The dot plots of a searched regulon are shown for all cell subpopulations in each disease state of each tissue based on the regulon specific score inferred using pySCENIC and by calculating the average expression. |
| Page: 1 |
Top |
Somatic mutation of malignant transformation related genes |
| Annotation of somatic variants for genes involved in malignant transformation |
| Hugo Symbol | Variant Class | Variant Classification | dbSNP RS | HGVSc | HGVSp | HGVSp Short | SWISSPROT | BIOTYPE | SIFT | PolyPhen | Tumor Sample Barcode | Tissue | Histology | Sex | Age | Stage | Therapy Types | Drugs | Outcome |
| L1CAM | SNV | Missense_Mutation | rs137852525 | c.2254N>A | p.Val752Met | p.V752M | P32004 | protein_coding | deleterious(0) | probably_damaging(1) | TCGA-A1-A0SD-01 | Breast | breast invasive carcinoma | Female | <65 | I/II | Unknown | Unknown | SD |
| L1CAM | SNV | Missense_Mutation | c.461N>C | p.Val154Ala | p.V154A | P32004 | protein_coding | tolerated(0.09) | benign(0.413) | TCGA-A8-A08R-01 | Breast | breast invasive carcinoma | Female | <65 | I/II | Unknown | Unknown | SD | |
| L1CAM | SNV | Missense_Mutation | novel | c.1606N>C | p.Thr536Pro | p.T536P | P32004 | protein_coding | deleterious(0.03) | possibly_damaging(0.713) | TCGA-AC-A3W5-01 | Breast | breast invasive carcinoma | Female | >=65 | I/II | Chemotherapy | docetaxel | CR |
| L1CAM | SNV | Missense_Mutation | c.2608C>T | p.His870Tyr | p.H870Y | P32004 | protein_coding | tolerated(0.32) | benign(0.021) | TCGA-B6-A1KN-01 | Breast | breast invasive carcinoma | Female | <65 | III/IV | Unknown | Unknown | SD | |
| L1CAM | SNV | Missense_Mutation | rs886039408 | c.1417N>T | p.Arg473Cys | p.R473C | P32004 | protein_coding | deleterious(0) | probably_damaging(0.995) | TCGA-BH-A0C7-01 | Breast | breast invasive carcinoma | Female | <65 | I/II | Chemotherapy | adriamycin | CR |
| L1CAM | SNV | Missense_Mutation | c.3706N>A | p.Glu1236Lys | p.E1236K | P32004 | protein_coding | deleterious(0.05) | benign(0.012) | TCGA-C8-A26Y-01 | Breast | breast invasive carcinoma | Female | >=65 | I/II | Unknown | Unknown | SD | |
| L1CAM | SNV | Missense_Mutation | rs782479917 | c.1669G>A | p.Gly557Ser | p.G557S | P32004 | protein_coding | deleterious(0.05) | possibly_damaging(0.654) | TCGA-D8-A1Y1-01 | Breast | breast invasive carcinoma | Female | >=65 | III/IV | Hormone Therapy | tamoxiphen | PD |
| L1CAM | SNV | Missense_Mutation | c.3245N>T | p.Pro1082Leu | p.P1082L | P32004 | protein_coding | deleterious(0) | benign(0.031) | TCGA-E2-A9RU-01 | Breast | breast invasive carcinoma | Female | >=65 | III/IV | Hormone Therapy | arimidex | SD | |
| L1CAM | SNV | Missense_Mutation | novel | c.1324A>C | p.Ser442Arg | p.S442R | P32004 | protein_coding | tolerated(0.06) | benign(0.015) | TCGA-OL-A5RW-01 | Breast | breast invasive carcinoma | Female | <65 | I/II | Chemotherapy | adriamycin | CR |
| L1CAM | SNV | Missense_Mutation | novel | c.1265N>C | p.Val422Ala | p.V422A | P32004 | protein_coding | deleterious(0) | possibly_damaging(0.748) | TCGA-2W-A8YY-01 | Cervix | cervical & endocervical cancer | Female | <65 | I/II | Chemotherapy | cisplatin | CR |
| Page: 1 2 3 4 5 6 7 8 9 10 11 12 13 14 15 16 17 18 19 |
Top |
Related drugs of malignant transformation related genes |
| Identification of chemicals and drugs interact with genes involved in malignant transfromation |
| (DGIdb 4.0) |
| Entrez ID | Symbol | Category | Interaction Types | Drug Claim Name | Drug Name | PMIDs |
| 3897 | L1CAM | CELL SURFACE, DRUGGABLE GENOME, KINASE | CD171 specific CAR T cells expressing EGFRt | |||
| 3897 | L1CAM | CELL SURFACE, DRUGGABLE GENOME, KINASE | JCAR023 |
| Page: 1 |

Copyright 2023-Present -The University of Texas Health Science Center at Houston |