
|
|||||
|
 | |
| |
| |
| |
| |
| |
|
Gene: KXD1 |
Gene summary for KXD1 |
| Gene information | Species | Human | Gene symbol | KXD1 | Gene ID | 79036 |
| Gene name | KxDL motif containing 1 | |
| Gene Alias | BORCS4 | |
| Cytomap | 19p13.11 | |
| Gene Type | protein-coding | GO ID | GO:0006810 | UniProtAcc | A0A024R7M2 |
Top |
Malignant transformation analysis |
| Identification of the aberrant gene expression in precancerous and cancerous lesions by comparing the gene expression of stem-like cells in diseased tissues with normal stem cells |
| Entrez ID | Symbol | Replicates | Species | Organ | Tissue | Adj P-value | Log2FC | Malignancy |
| 79036 | KXD1 | LZE4T | Human | Esophagus | ESCC | 1.87e-12 | 4.28e-01 | 0.0811 |
| 79036 | KXD1 | LZE5T | Human | Esophagus | ESCC | 9.66e-05 | 3.66e-01 | 0.0514 |
| 79036 | KXD1 | LZE7T | Human | Esophagus | ESCC | 2.96e-13 | 8.17e-01 | 0.0667 |
| 79036 | KXD1 | LZE8T | Human | Esophagus | ESCC | 1.45e-04 | 2.33e-01 | 0.067 |
| 79036 | KXD1 | LZE22T | Human | Esophagus | ESCC | 3.79e-09 | 8.11e-01 | 0.068 |
| 79036 | KXD1 | LZE24T | Human | Esophagus | ESCC | 8.67e-21 | 7.59e-01 | 0.0596 |
| 79036 | KXD1 | LZE6T | Human | Esophagus | ESCC | 4.68e-11 | 6.94e-01 | 0.0845 |
| 79036 | KXD1 | P1T-E | Human | Esophagus | ESCC | 4.08e-10 | 6.90e-01 | 0.0875 |
| 79036 | KXD1 | P2T-E | Human | Esophagus | ESCC | 8.47e-25 | 4.66e-01 | 0.1177 |
| 79036 | KXD1 | P4T-E | Human | Esophagus | ESCC | 1.36e-40 | 1.05e+00 | 0.1323 |
| 79036 | KXD1 | P5T-E | Human | Esophagus | ESCC | 6.92e-51 | 1.11e+00 | 0.1327 |
| 79036 | KXD1 | P8T-E | Human | Esophagus | ESCC | 7.29e-46 | 8.75e-01 | 0.0889 |
| 79036 | KXD1 | P9T-E | Human | Esophagus | ESCC | 1.26e-33 | 1.04e+00 | 0.1131 |
| 79036 | KXD1 | P10T-E | Human | Esophagus | ESCC | 2.25e-56 | 1.10e+00 | 0.116 |
| 79036 | KXD1 | P11T-E | Human | Esophagus | ESCC | 4.39e-26 | 1.16e+00 | 0.1426 |
| 79036 | KXD1 | P12T-E | Human | Esophagus | ESCC | 1.60e-42 | 8.48e-01 | 0.1122 |
| 79036 | KXD1 | P15T-E | Human | Esophagus | ESCC | 1.02e-34 | 8.05e-01 | 0.1149 |
| 79036 | KXD1 | P16T-E | Human | Esophagus | ESCC | 2.86e-25 | 6.25e-01 | 0.1153 |
| 79036 | KXD1 | P17T-E | Human | Esophagus | ESCC | 1.90e-13 | 7.81e-01 | 0.1278 |
| 79036 | KXD1 | P19T-E | Human | Esophagus | ESCC | 4.60e-16 | 1.44e+00 | 0.1662 |
| Page: 1 2 3 4 5 6 7 |
| Tissue | Expression Dynamics | Abbreviation |
| Esophagus |  | ESCC: Esophageal squamous cell carcinoma |
| HGIN: High-grade intraepithelial neoplasias | ||
| LGIN: Low-grade intraepithelial neoplasias | ||
| Liver | 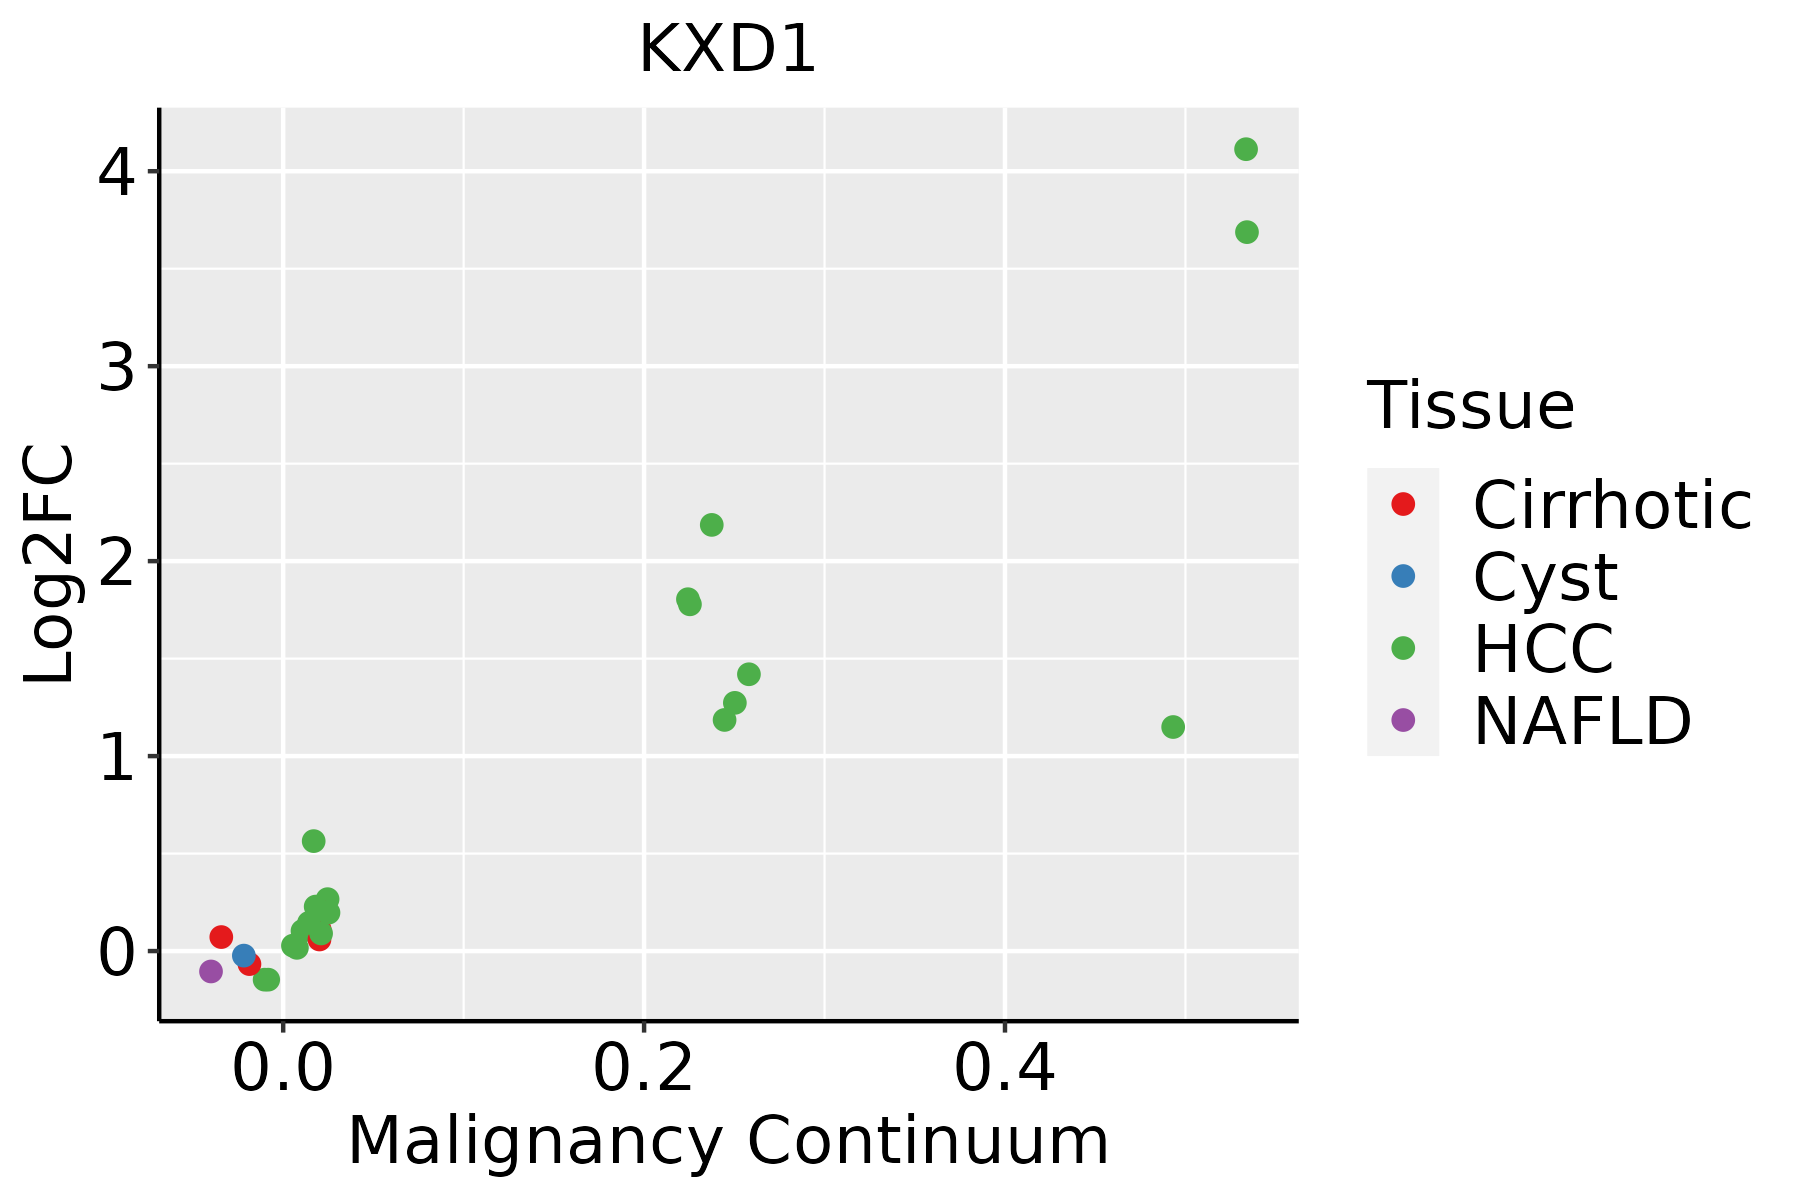 | HCC: Hepatocellular carcinoma |
| NAFLD: Non-alcoholic fatty liver disease | ||
| Oral Cavity | 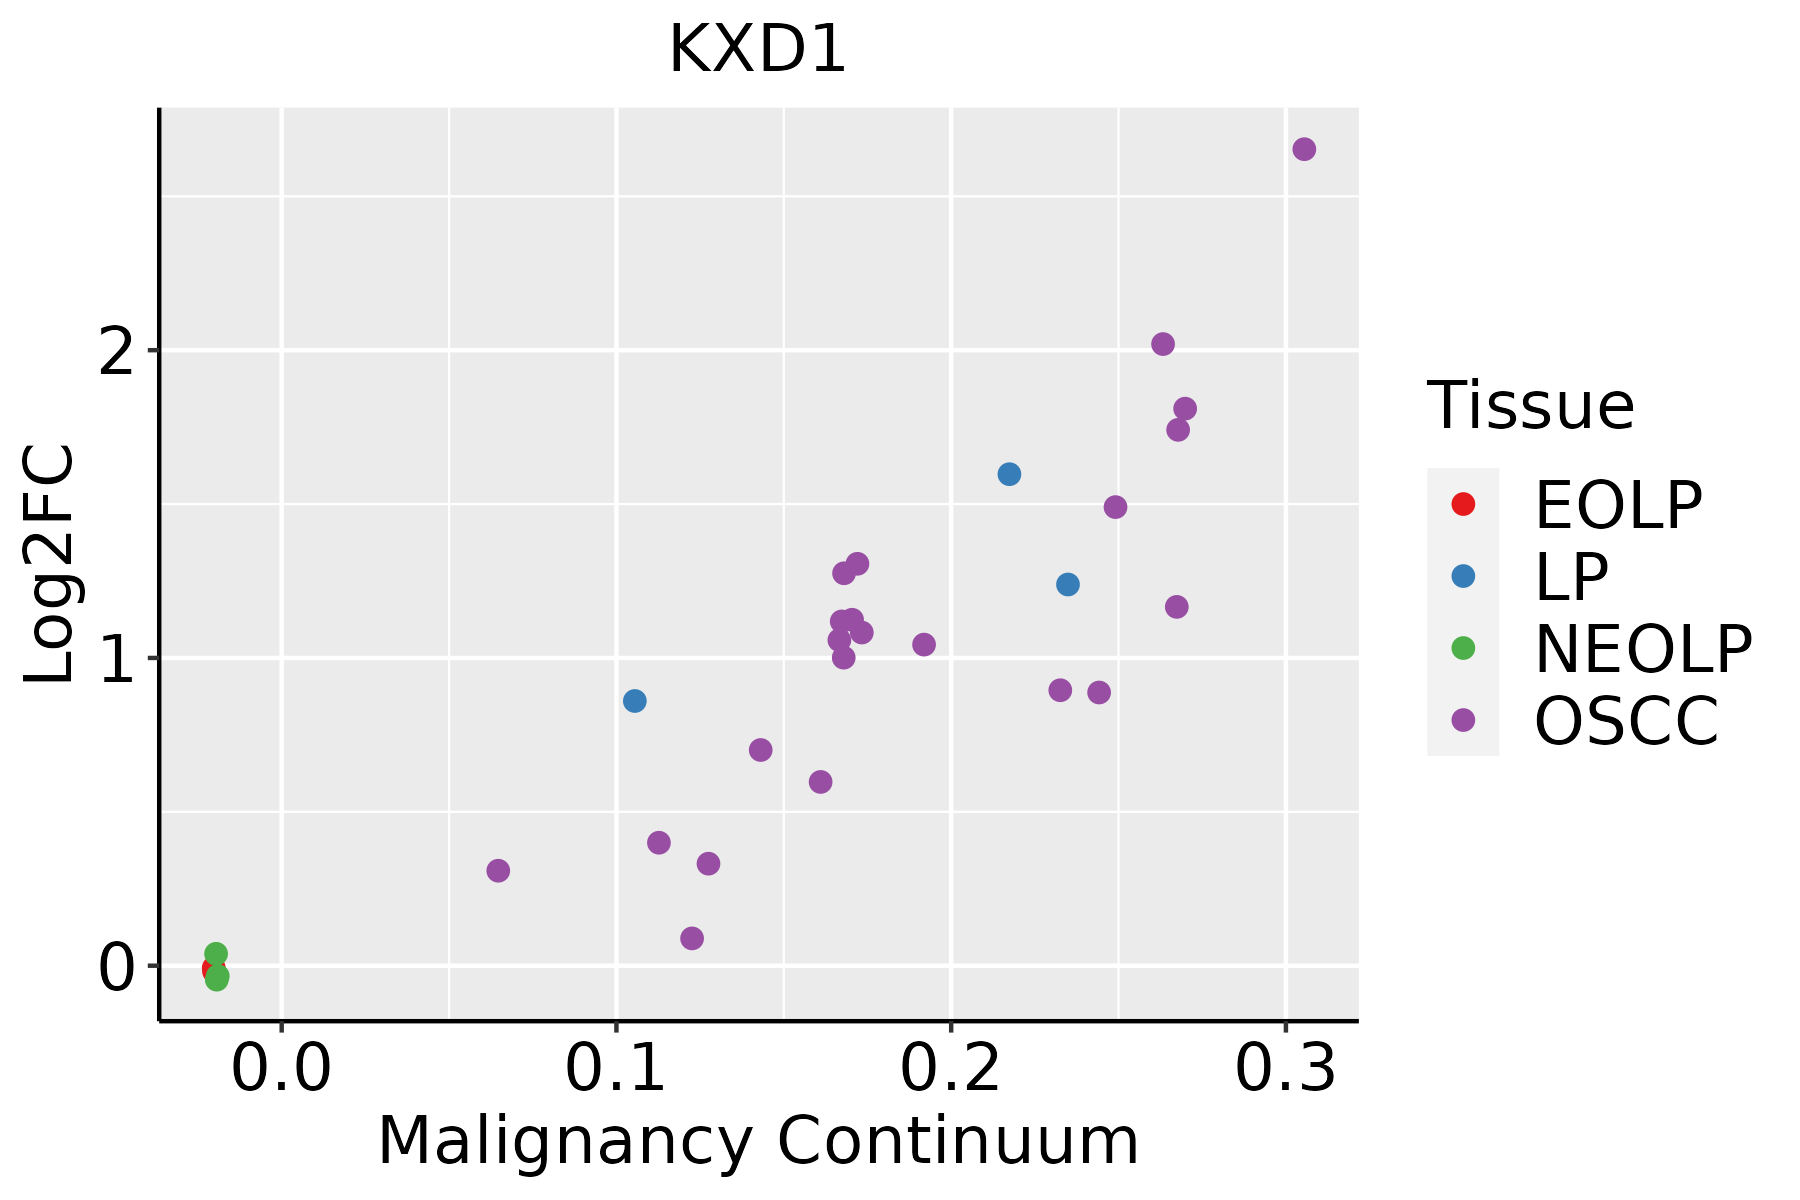 | EOLP: Erosive Oral lichen planus |
| LP: leukoplakia | ||
| NEOLP: Non-erosive oral lichen planus | ||
| OSCC: Oral squamous cell carcinoma | ||
| Skin |  | AK: Actinic keratosis |
| cSCC: Cutaneous squamous cell carcinoma | ||
| SCCIS:squamous cell carcinoma in situ | ||
| Thyroid |  | ATC: Anaplastic thyroid cancer |
| HT: Hashimoto's thyroiditis | ||
| PTC: Papillary thyroid cancer |
| ∗log2FC in expression of this searched gene in stem-like cells from each diseased tissue sample relative to stem-like cells in normal samples in each tissue plotted against the malignancy continuum. Samples are colored based on if they are from different disease stage. |
Top |
Malignant transformation related pathway analysis |
| Find out the enriched GO biological processes and KEGG pathways involved in transition from healthy to precancer to cancer |
| Tissue | Disease Stage | Enriched GO biological Processes |
| Colorectum | AD |  |
| Colorectum | SER |  |
| Colorectum | MSS |  |
| Colorectum | MSI-H |  |
| Colorectum | FAP |  |
| ∗Top 15 enriched GO BP terms are showed in the bar plot of each disease state in each tissue. Each row represents a significant GO biological process which is colored according to the -log10(p.adjust). |
| Page: 1 2 3 4 5 6 7 8 9 |
| GO ID | Tissue | Disease Stage | Description | Gene Ratio | Bg Ratio | pvalue | p.adjust | Count |
| Page: 1 |
| Pathway ID | Tissue | Disease Stage | Description | Gene Ratio | Bg Ratio | pvalue | p.adjust | qvalue | Count |
| Page: 1 |
Top |
Cell-cell communication analysis |
| Identification of potential cell-cell interactions between two cell types and their ligand-receptor pairs for different disease states |
| Ligand | Receptor | LRpair | Pathway | Tissue | Disease Stage |
| Page: 1 |
Top |
Single-cell gene regulatory network inference analysis |
| Find out the significant the regulons (TFs) and the target genes of each regulon across cell types for different disease states |
| TF | Cell Type | Tissue | Disease Stage | Target Gene | RSS | Regulon Activity |
| ∗The dot plots of a searched regulon are shown for all cell subpopulations in each disease state of each tissue based on the regulon specific score inferred using pySCENIC and by calculating the average expression. |
| Page: 1 |
Top |
Somatic mutation of malignant transformation related genes |
| Annotation of somatic variants for genes involved in malignant transformation |
| Hugo Symbol | Variant Class | Variant Classification | dbSNP RS | HGVSc | HGVSp | HGVSp Short | SWISSPROT | BIOTYPE | SIFT | PolyPhen | Tumor Sample Barcode | Tissue | Histology | Sex | Age | Stage | Therapy Types | Drugs | Outcome |
| KXD1 | SNV | Missense_Mutation | c.142N>G | p.Phe48Val | p.F48V | Q9BQD3 | protein_coding | tolerated(0.49) | probably_damaging(0.998) | TCGA-D8-A13Z-01 | Breast | breast invasive carcinoma | Female | <65 | I/II | Chemotherapy | doxorubicine | SD | |
| KXD1 | SNV | Missense_Mutation | c.115N>C | p.Glu39Gln | p.E39Q | Q9BQD3 | protein_coding | deleterious(0) | probably_damaging(0.999) | TCGA-D8-A140-01 | Breast | breast invasive carcinoma | Female | <65 | I/II | Chemotherapy | doxorubicin+cyclophosphamid | SD | |
| KXD1 | SNV | Missense_Mutation | c.484N>T | p.Ile162Phe | p.I162F | Q9BQD3 | protein_coding | tolerated_low_confidence(0.11) | benign(0.048) | TCGA-D8-A1Y0-01 | Breast | breast invasive carcinoma | Female | >=65 | III/IV | Chemotherapy | cyclophosphamide+methotrexatum+fluorouracillum | SD | |
| KXD1 | insertion | Frame_Shift_Ins | novel | c.41_42insAGGTAAAG | p.Ile15GlyfsTer5 | p.I15Gfs*5 | Q9BQD3 | protein_coding | TCGA-AN-A0FN-01 | Breast | breast invasive carcinoma | Female | <65 | I/II | Unknown | Unknown | SD | ||
| KXD1 | SNV | Missense_Mutation | novel | c.4N>A | p.Asp2Asn | p.D2N | Q9BQD3 | protein_coding | deleterious_low_confidence(0) | benign(0.179) | TCGA-VS-A8Q9-01 | Cervix | cervical & endocervical cancer | Female | >=65 | I/II | Unknown | Unknown | SD |
| KXD1 | SNV | Missense_Mutation | novel | c.275C>T | p.Ala92Val | p.A92V | Q9BQD3 | protein_coding | deleterious(0.01) | possibly_damaging(0.673) | TCGA-AD-6895-01 | Colorectum | colon adenocarcinoma | Male | >=65 | III/IV | Unknown | Unknown | SD |
| KXD1 | SNV | Missense_Mutation | c.467N>C | p.Gln156Pro | p.Q156P | Q9BQD3 | protein_coding | tolerated_low_confidence(0.38) | benign(0) | TCGA-AZ-6598-01 | Colorectum | colon adenocarcinoma | Female | >=65 | I/II | Unknown | Unknown | SD | |
| KXD1 | SNV | Missense_Mutation | rs745609014 | c.286N>T | p.Pro96Ser | p.P96S | Q9BQD3 | protein_coding | deleterious(0.01) | probably_damaging(0.971) | TCGA-CK-4951-01 | Colorectum | colon adenocarcinoma | Female | >=65 | I/II | Unknown | Unknown | PD |
| KXD1 | SNV | Missense_Mutation | novel | c.96G>T | p.Lys32Asn | p.K32N | Q9BQD3 | protein_coding | deleterious(0) | possibly_damaging(0.551) | TCGA-A5-A0G2-01 | Endometrium | uterine corpus endometrioid carcinoma | Female | <65 | III/IV | Unknown | Unknown | SD |
| KXD1 | SNV | Missense_Mutation | novel | c.476N>T | p.Ser159Phe | p.S159F | Q9BQD3 | protein_coding | tolerated_low_confidence(0.07) | benign(0.246) | TCGA-AJ-A3QS-01 | Endometrium | uterine corpus endometrioid carcinoma | Female | <65 | III/IV | Chemotherapy | cisplatin | CR |
| Page: 1 2 |
Top |
Related drugs of malignant transformation related genes |
| Identification of chemicals and drugs interact with genes involved in malignant transfromation |
| (DGIdb 4.0) |
| Entrez ID | Symbol | Category | Interaction Types | Drug Claim Name | Drug Name | PMIDs |
| Page: 1 |

Copyright 2023-Present -The University of Texas Health Science Center at Houston |