
|
|||||
|
 | |
| |
| |
| |
| |
| |
|
Gene: KTI12 |
Gene summary for KTI12 |
| Gene information | Species | Human | Gene symbol | KTI12 | Gene ID | 112970 |
| Gene name | KTI12 chromatin associated homolog | |
| Gene Alias | SBBI81 | |
| Cytomap | 1p32.3 | |
| Gene Type | protein-coding | GO ID | GO:0002097 | UniProtAcc | Q96EK9 |
Top |
Malignant transformation analysis |
| Identification of the aberrant gene expression in precancerous and cancerous lesions by comparing the gene expression of stem-like cells in diseased tissues with normal stem cells |
| Entrez ID | Symbol | Replicates | Species | Organ | Tissue | Adj P-value | Log2FC | Malignancy |
| 112970 | KTI12 | HCC1_Meng | Human | Liver | HCC | 7.86e-29 | 4.18e-02 | 0.0246 |
| 112970 | KTI12 | S014 | Human | Liver | HCC | 3.14e-19 | 4.47e-01 | 0.2254 |
| 112970 | KTI12 | S015 | Human | Liver | HCC | 2.98e-07 | 2.22e-01 | 0.2375 |
| 112970 | KTI12 | S016 | Human | Liver | HCC | 5.26e-11 | 3.16e-01 | 0.2243 |
| 112970 | KTI12 | S027 | Human | Liver | HCC | 3.00e-07 | 4.08e-01 | 0.2446 |
| 112970 | KTI12 | S028 | Human | Liver | HCC | 1.11e-12 | 5.04e-01 | 0.2503 |
| 112970 | KTI12 | S029 | Human | Liver | HCC | 3.88e-18 | 6.42e-01 | 0.2581 |
| 112970 | KTI12 | C04 | Human | Oral cavity | OSCC | 1.18e-15 | 6.47e-01 | 0.2633 |
| 112970 | KTI12 | C21 | Human | Oral cavity | OSCC | 3.66e-09 | 3.22e-01 | 0.2678 |
| 112970 | KTI12 | C30 | Human | Oral cavity | OSCC | 1.46e-09 | 5.31e-01 | 0.3055 |
| 112970 | KTI12 | C43 | Human | Oral cavity | OSCC | 9.47e-16 | 1.67e-01 | 0.1704 |
| 112970 | KTI12 | C46 | Human | Oral cavity | OSCC | 1.61e-04 | 1.31e-01 | 0.1673 |
| 112970 | KTI12 | C51 | Human | Oral cavity | OSCC | 1.64e-02 | 1.43e-01 | 0.2674 |
| 112970 | KTI12 | C57 | Human | Oral cavity | OSCC | 4.79e-07 | 2.57e-01 | 0.1679 |
| 112970 | KTI12 | C06 | Human | Oral cavity | OSCC | 4.90e-04 | 3.72e-01 | 0.2699 |
| 112970 | KTI12 | C08 | Human | Oral cavity | OSCC | 4.71e-06 | 9.64e-02 | 0.1919 |
| 112970 | KTI12 | LN46 | Human | Oral cavity | OSCC | 3.94e-03 | 1.47e-01 | 0.1666 |
| 112970 | KTI12 | SYSMH1 | Human | Oral cavity | OSCC | 1.34e-08 | 7.77e-02 | 0.1127 |
| 112970 | KTI12 | SYSMH2 | Human | Oral cavity | OSCC | 1.21e-04 | 1.29e-01 | 0.2326 |
| 112970 | KTI12 | SYSMH3 | Human | Oral cavity | OSCC | 8.47e-12 | 2.87e-01 | 0.2442 |
| Page: 1 |
| Tissue | Expression Dynamics | Abbreviation |
| Liver | 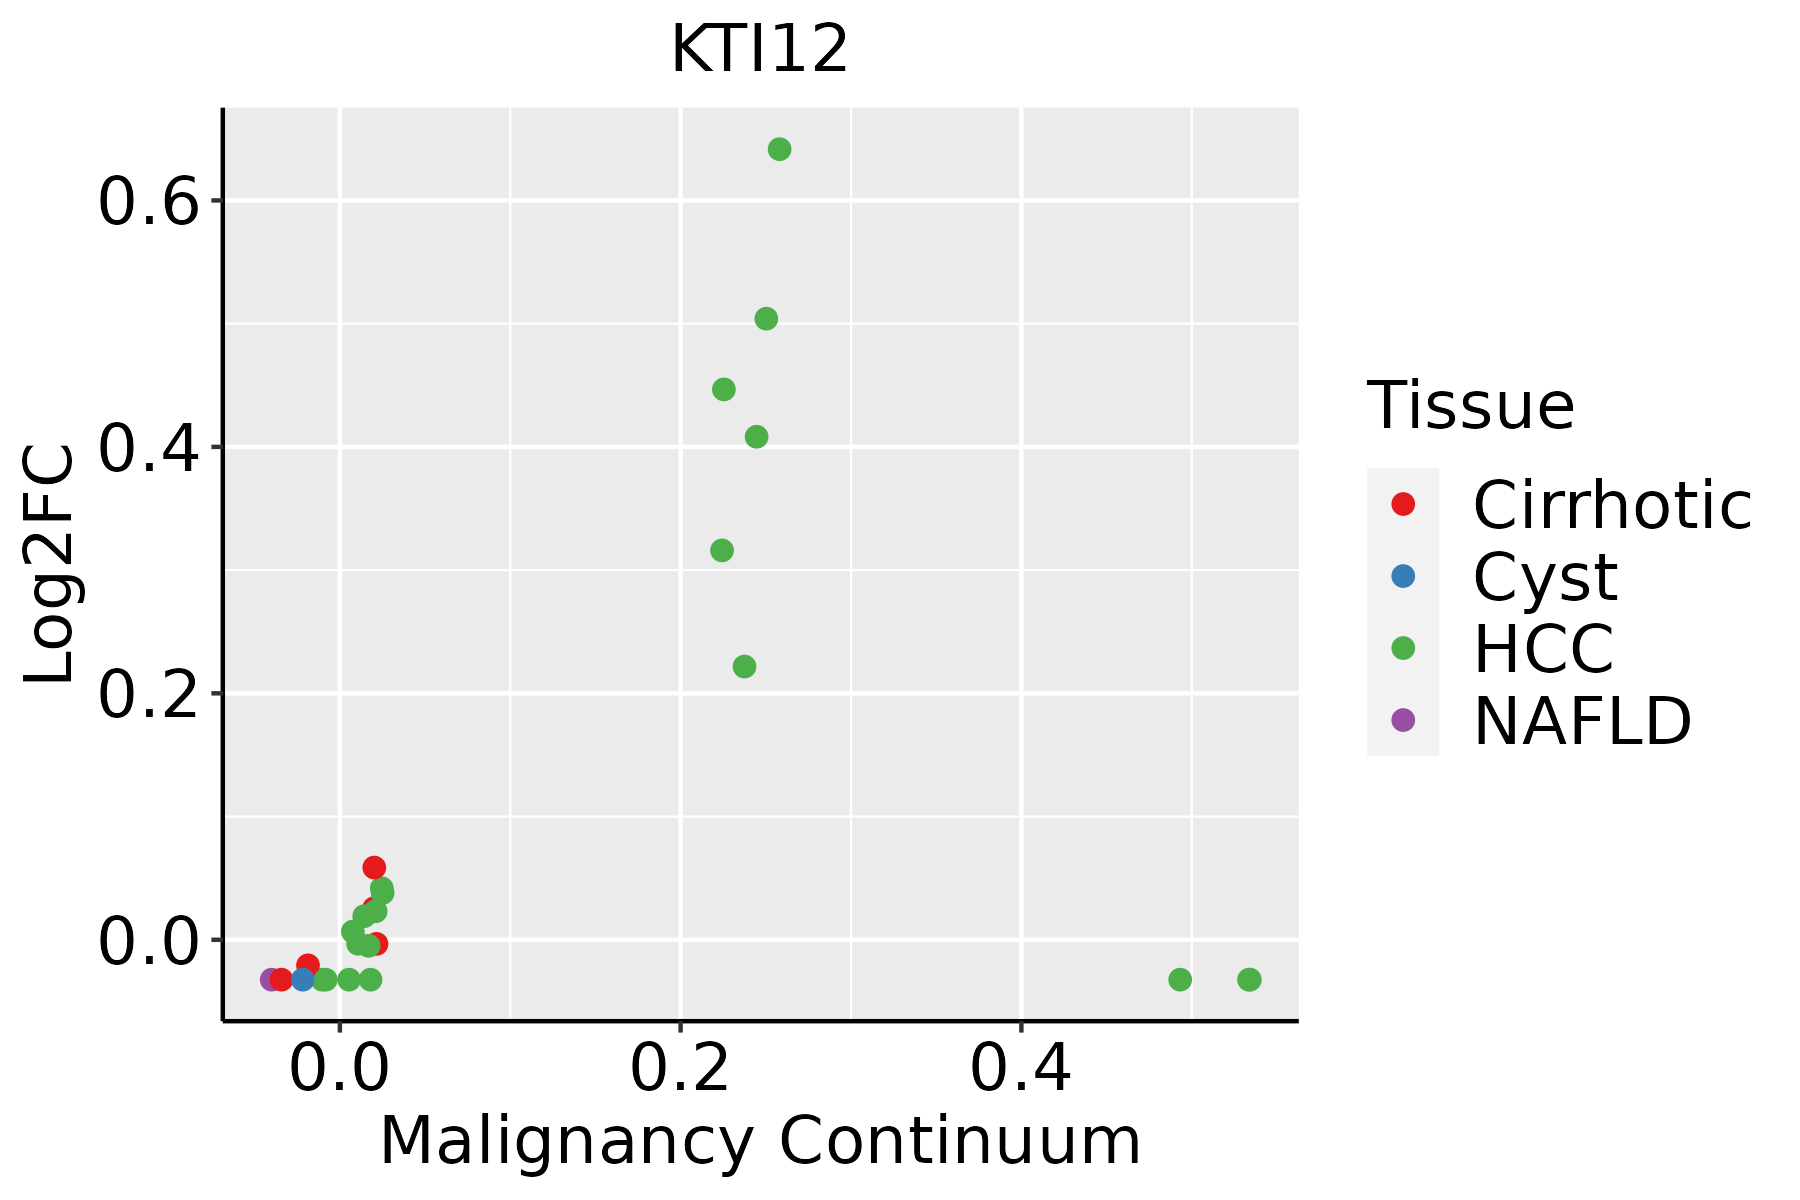 | HCC: Hepatocellular carcinoma |
| NAFLD: Non-alcoholic fatty liver disease | ||
| Oral Cavity | 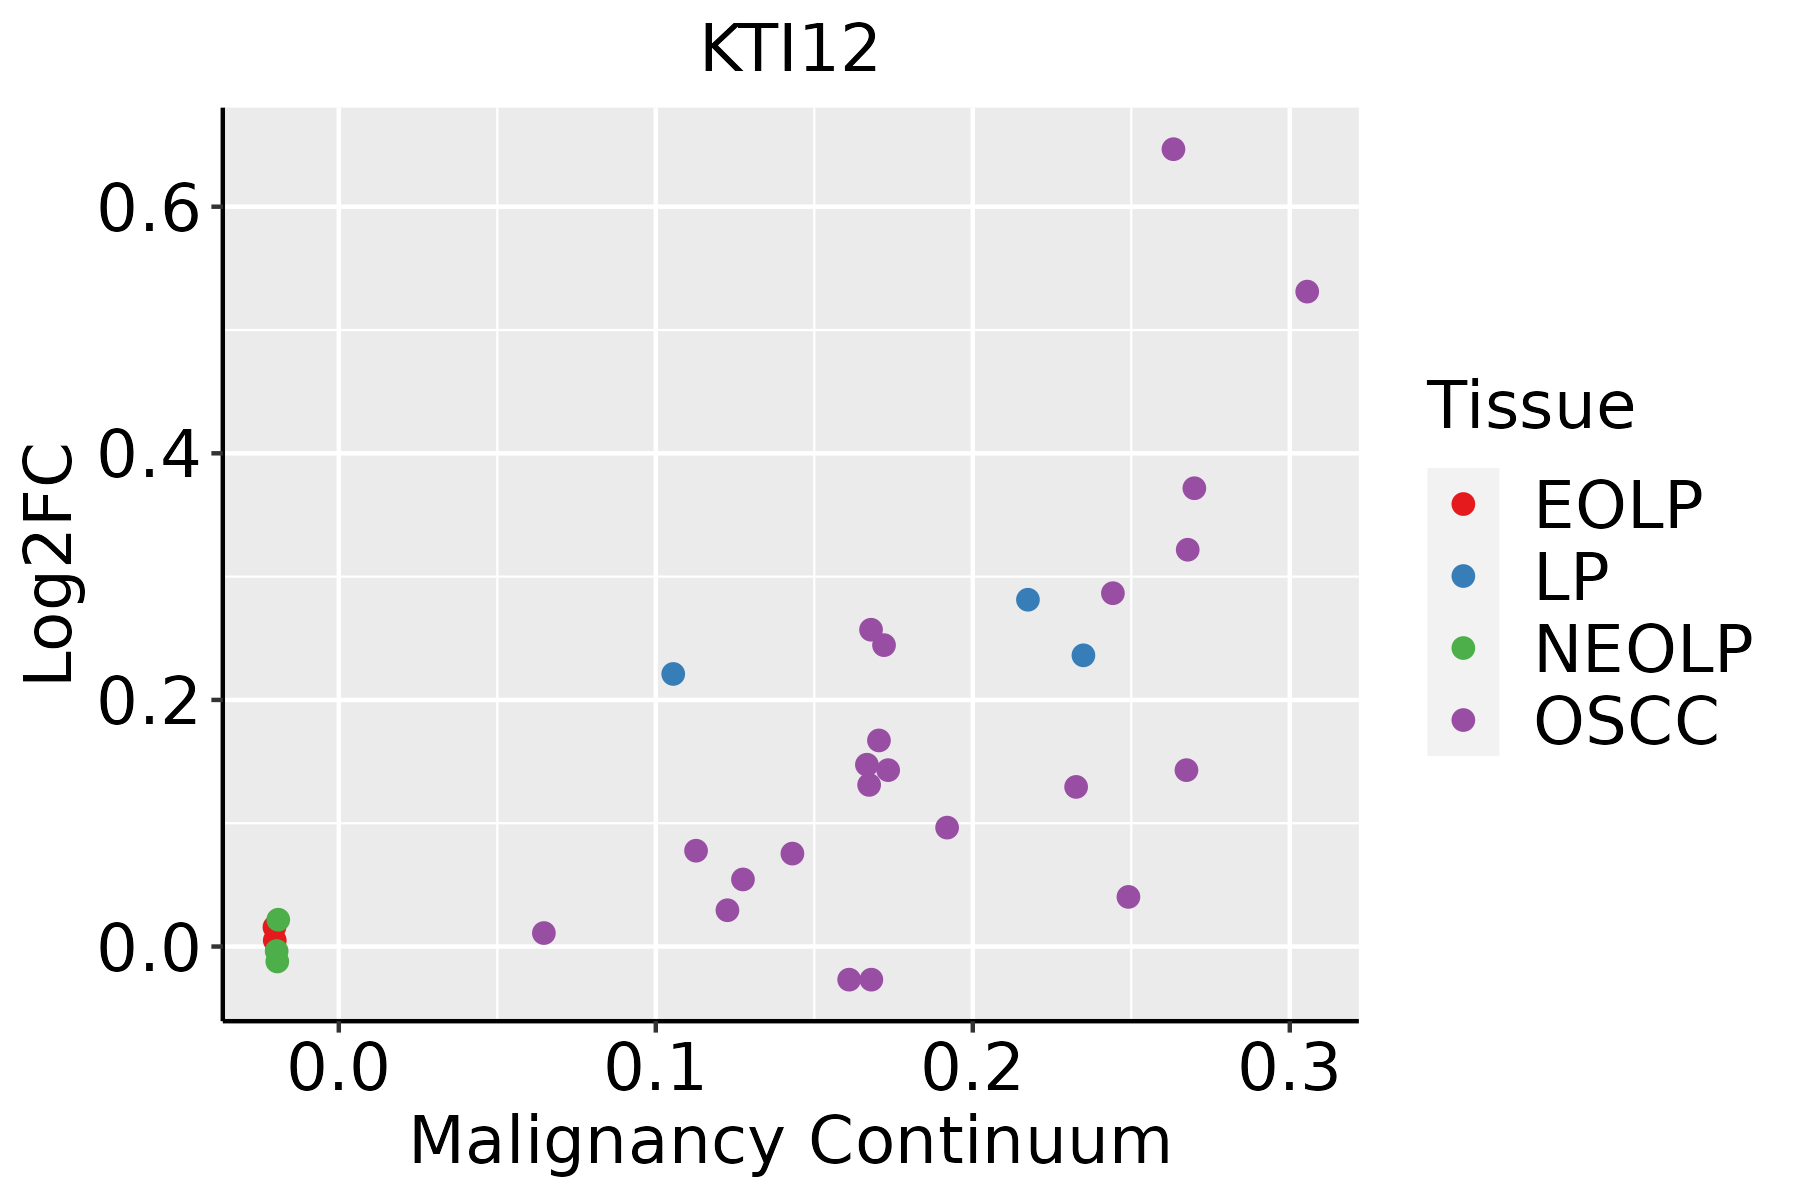 | EOLP: Erosive Oral lichen planus |
| LP: leukoplakia | ||
| NEOLP: Non-erosive oral lichen planus | ||
| OSCC: Oral squamous cell carcinoma |
| ∗log2FC in expression of this searched gene in stem-like cells from each diseased tissue sample relative to stem-like cells in normal samples in each tissue plotted against the malignancy continuum. Samples are colored based on if they are from different disease stage. |
Top |
Malignant transformation related pathway analysis |
| Find out the enriched GO biological processes and KEGG pathways involved in transition from healthy to precancer to cancer |
| Tissue | Disease Stage | Enriched GO biological Processes |
| Colorectum | AD |  |
| Colorectum | SER |  |
| Colorectum | MSS |  |
| Colorectum | MSI-H |  |
| Colorectum | FAP |  |
| ∗Top 15 enriched GO BP terms are showed in the bar plot of each disease state in each tissue. Each row represents a significant GO biological process which is colored according to the -log10(p.adjust). |
| Page: 1 2 3 4 5 6 7 8 9 |
| GO ID | Tissue | Disease Stage | Description | Gene Ratio | Bg Ratio | pvalue | p.adjust | Count |
| GO:00344702 | Liver | HCC | ncRNA processing | 293/7958 | 395/18723 | 4.26e-38 | 6.76e-35 | 293 |
| GO:00346601 | Liver | HCC | ncRNA metabolic process | 332/7958 | 485/18723 | 1.48e-31 | 7.80e-29 | 332 |
| GO:0008033 | Liver | HCC | tRNA processing | 87/7958 | 127/18723 | 2.66e-09 | 7.23e-08 | 87 |
| GO:0006399 | Liver | HCC | tRNA metabolic process | 108/7958 | 179/18723 | 1.07e-06 | 1.59e-05 | 108 |
| GO:0009451 | Liver | HCC | RNA modification | 101/7958 | 167/18723 | 2.02e-06 | 2.78e-05 | 101 |
| GO:0006400 | Liver | HCC | tRNA modification | 60/7958 | 90/18723 | 3.09e-06 | 4.09e-05 | 60 |
| GO:00344709 | Oral cavity | OSCC | ncRNA processing | 263/7305 | 395/18723 | 4.38e-29 | 2.78e-26 | 263 |
| GO:00346605 | Oral cavity | OSCC | ncRNA metabolic process | 296/7305 | 485/18723 | 2.94e-23 | 6.65e-21 | 296 |
| GO:00080332 | Oral cavity | OSCC | tRNA processing | 78/7305 | 127/18723 | 2.56e-07 | 4.00e-06 | 78 |
| GO:00063991 | Oral cavity | OSCC | tRNA metabolic process | 101/7305 | 179/18723 | 1.65e-06 | 2.15e-05 | 101 |
| GO:00094511 | Oral cavity | OSCC | RNA modification | 95/7305 | 167/18723 | 2.05e-06 | 2.62e-05 | 95 |
| GO:00064001 | Oral cavity | OSCC | tRNA modification | 53/7305 | 90/18723 | 1.04e-04 | 7.70e-04 | 53 |
| Page: 1 |
| Pathway ID | Tissue | Disease Stage | Description | Gene Ratio | Bg Ratio | pvalue | p.adjust | qvalue | Count |
| Page: 1 |
Top |
Cell-cell communication analysis |
| Identification of potential cell-cell interactions between two cell types and their ligand-receptor pairs for different disease states |
| Ligand | Receptor | LRpair | Pathway | Tissue | Disease Stage |
| Page: 1 |
Top |
Single-cell gene regulatory network inference analysis |
| Find out the significant the regulons (TFs) and the target genes of each regulon across cell types for different disease states |
| TF | Cell Type | Tissue | Disease Stage | Target Gene | RSS | Regulon Activity |
| ∗The dot plots of a searched regulon are shown for all cell subpopulations in each disease state of each tissue based on the regulon specific score inferred using pySCENIC and by calculating the average expression. |
| Page: 1 |
Top |
Somatic mutation of malignant transformation related genes |
| Annotation of somatic variants for genes involved in malignant transformation |
| Hugo Symbol | Variant Class | Variant Classification | dbSNP RS | HGVSc | HGVSp | HGVSp Short | SWISSPROT | BIOTYPE | SIFT | PolyPhen | Tumor Sample Barcode | Tissue | Histology | Sex | Age | Stage | Therapy Types | Drugs | Outcome |
| KTI12 | SNV | Missense_Mutation | rs201065316 | c.286N>T | p.Arg96Trp | p.R96W | Q96EK9 | protein_coding | deleterious(0) | probably_damaging(1) | TCGA-A8-A093-01 | Breast | breast invasive carcinoma | Female | <65 | I/II | Hormone Therapy | tamoxiphen | SD |
| KTI12 | SNV | Missense_Mutation | novel | c.958N>T | p.Arg320Cys | p.R320C | Q96EK9 | protein_coding | deleterious(0) | probably_damaging(0.989) | TCGA-E9-A3QA-01 | Breast | breast invasive carcinoma | Female | <65 | I/II | Unknown | Unknown | SD |
| KTI12 | SNV | Missense_Mutation | c.599C>A | p.Ser200Tyr | p.S200Y | Q96EK9 | protein_coding | tolerated(0.07) | possibly_damaging(0.694) | TCGA-2W-A8YY-01 | Cervix | cervical & endocervical cancer | Female | <65 | I/II | Chemotherapy | cisplatin | CR | |
| KTI12 | SNV | Missense_Mutation | novel | c.536C>G | p.Ser179Cys | p.S179C | Q96EK9 | protein_coding | tolerated(0.22) | benign(0.186) | TCGA-DS-A1OB-01 | Cervix | cervical & endocervical cancer | Female | <65 | I/II | Chemotherapy | carboplatin | PD |
| KTI12 | SNV | Missense_Mutation | c.1006G>A | p.Glu336Lys | p.E336K | Q96EK9 | protein_coding | deleterious(0.01) | probably_damaging(0.966) | TCGA-IR-A3LK-01 | Cervix | cervical & endocervical cancer | Female | >=65 | I/II | Chemotherapy | cisplatin | PD | |
| KTI12 | SNV | Missense_Mutation | rs774458515 | c.370N>A | p.Glu124Lys | p.E124K | Q96EK9 | protein_coding | deleterious_low_confidence(0.02) | benign(0.012) | TCGA-JX-A3Q0-01 | Cervix | cervical & endocervical cancer | Female | <65 | III/IV | Unknown | Unknown | SD |
| KTI12 | SNV | Missense_Mutation | c.938T>C | p.Leu313Ser | p.L313S | Q96EK9 | protein_coding | deleterious(0) | possibly_damaging(0.511) | TCGA-G4-6309-01 | Colorectum | colon adenocarcinoma | Female | <65 | III/IV | Chemotherapy | xeloda | PD | |
| KTI12 | SNV | Missense_Mutation | rs200200454 | c.254A>G | p.Lys85Arg | p.K85R | Q96EK9 | protein_coding | tolerated(0.07) | probably_damaging(0.987) | TCGA-G4-6317-01 | Colorectum | colon adenocarcinoma | Female | <65 | III/IV | Chemotherapy | fluorouracil | PD |
| KTI12 | deletion | Frame_Shift_Del | c.311delN | p.Leu104ArgfsTer29 | p.L104Rfs*29 | Q96EK9 | protein_coding | TCGA-A6-6653-01 | Colorectum | colon adenocarcinoma | Male | >=65 | I/II | Unknown | Unknown | SD | |||
| KTI12 | SNV | Missense_Mutation | c.997C>A | p.Pro333Thr | p.P333T | Q96EK9 | protein_coding | deleterious(0.02) | benign(0.307) | TCGA-AP-A0LI-01 | Endometrium | uterine corpus endometrioid carcinoma | Female | >=65 | III/IV | Chemotherapy | paclitaxel | SD |
| Page: 1 2 3 4 |
Top |
Related drugs of malignant transformation related genes |
| Identification of chemicals and drugs interact with genes involved in malignant transfromation |
| (DGIdb 4.0) |
| Entrez ID | Symbol | Category | Interaction Types | Drug Claim Name | Drug Name | PMIDs |
| Page: 1 |

Copyright 2023-Present -The University of Texas Health Science Center at Houston |