
|
|||||
|
 | |
| |
| |
| |
| |
| |
|
Gene: KSR1 |
Gene summary for KSR1 |
| Gene information | Species | Human | Gene symbol | KSR1 | Gene ID | 8844 |
| Gene name | kinase suppressor of ras 1 | |
| Gene Alias | KSR | |
| Cytomap | 17q11.2 | |
| Gene Type | protein-coding | GO ID | GO:0000165 | UniProtAcc | Q8IVT5 |
Top |
Malignant transformation analysis |
| Identification of the aberrant gene expression in precancerous and cancerous lesions by comparing the gene expression of stem-like cells in diseased tissues with normal stem cells |
| Entrez ID | Symbol | Replicates | Species | Organ | Tissue | Adj P-value | Log2FC | Malignancy |
| 8844 | KSR1 | P8T-E | Human | Esophagus | ESCC | 3.97e-05 | 1.23e-01 | 0.0889 |
| 8844 | KSR1 | P9T-E | Human | Esophagus | ESCC | 6.21e-03 | 5.15e-02 | 0.1131 |
| 8844 | KSR1 | P10T-E | Human | Esophagus | ESCC | 4.10e-02 | 2.31e-02 | 0.116 |
| 8844 | KSR1 | P23T-E | Human | Esophagus | ESCC | 1.19e-03 | 1.20e-01 | 0.108 |
| 8844 | KSR1 | P26T-E | Human | Esophagus | ESCC | 4.15e-03 | 7.88e-02 | 0.1276 |
| 8844 | KSR1 | P27T-E | Human | Esophagus | ESCC | 2.42e-04 | 9.64e-02 | 0.1055 |
| 8844 | KSR1 | P28T-E | Human | Esophagus | ESCC | 2.29e-08 | 2.21e-01 | 0.1149 |
| 8844 | KSR1 | P36T-E | Human | Esophagus | ESCC | 7.55e-04 | 1.77e-01 | 0.1187 |
| 8844 | KSR1 | P39T-E | Human | Esophagus | ESCC | 4.12e-06 | 7.34e-02 | 0.0894 |
| 8844 | KSR1 | P42T-E | Human | Esophagus | ESCC | 3.51e-06 | 1.05e-01 | 0.1175 |
| 8844 | KSR1 | P44T-E | Human | Esophagus | ESCC | 1.10e-02 | 7.23e-02 | 0.1096 |
| 8844 | KSR1 | P54T-E | Human | Esophagus | ESCC | 4.79e-13 | 3.55e-01 | 0.0975 |
| 8844 | KSR1 | P61T-E | Human | Esophagus | ESCC | 1.50e-02 | 1.17e-01 | 0.099 |
| 8844 | KSR1 | P82T-E | Human | Esophagus | ESCC | 1.96e-04 | 2.23e-01 | 0.1072 |
| 8844 | KSR1 | P107T-E | Human | Esophagus | ESCC | 7.03e-03 | 1.37e-01 | 0.171 |
| 8844 | KSR1 | P127T-E | Human | Esophagus | ESCC | 5.45e-06 | 1.34e-01 | 0.0826 |
| 8844 | KSR1 | P128T-E | Human | Esophagus | ESCC | 2.34e-12 | 5.81e-01 | 0.1241 |
| 8844 | KSR1 | P130T-E | Human | Esophagus | ESCC | 3.18e-24 | 5.74e-01 | 0.1676 |
| Page: 1 |
| Tissue | Expression Dynamics | Abbreviation |
| Esophagus | 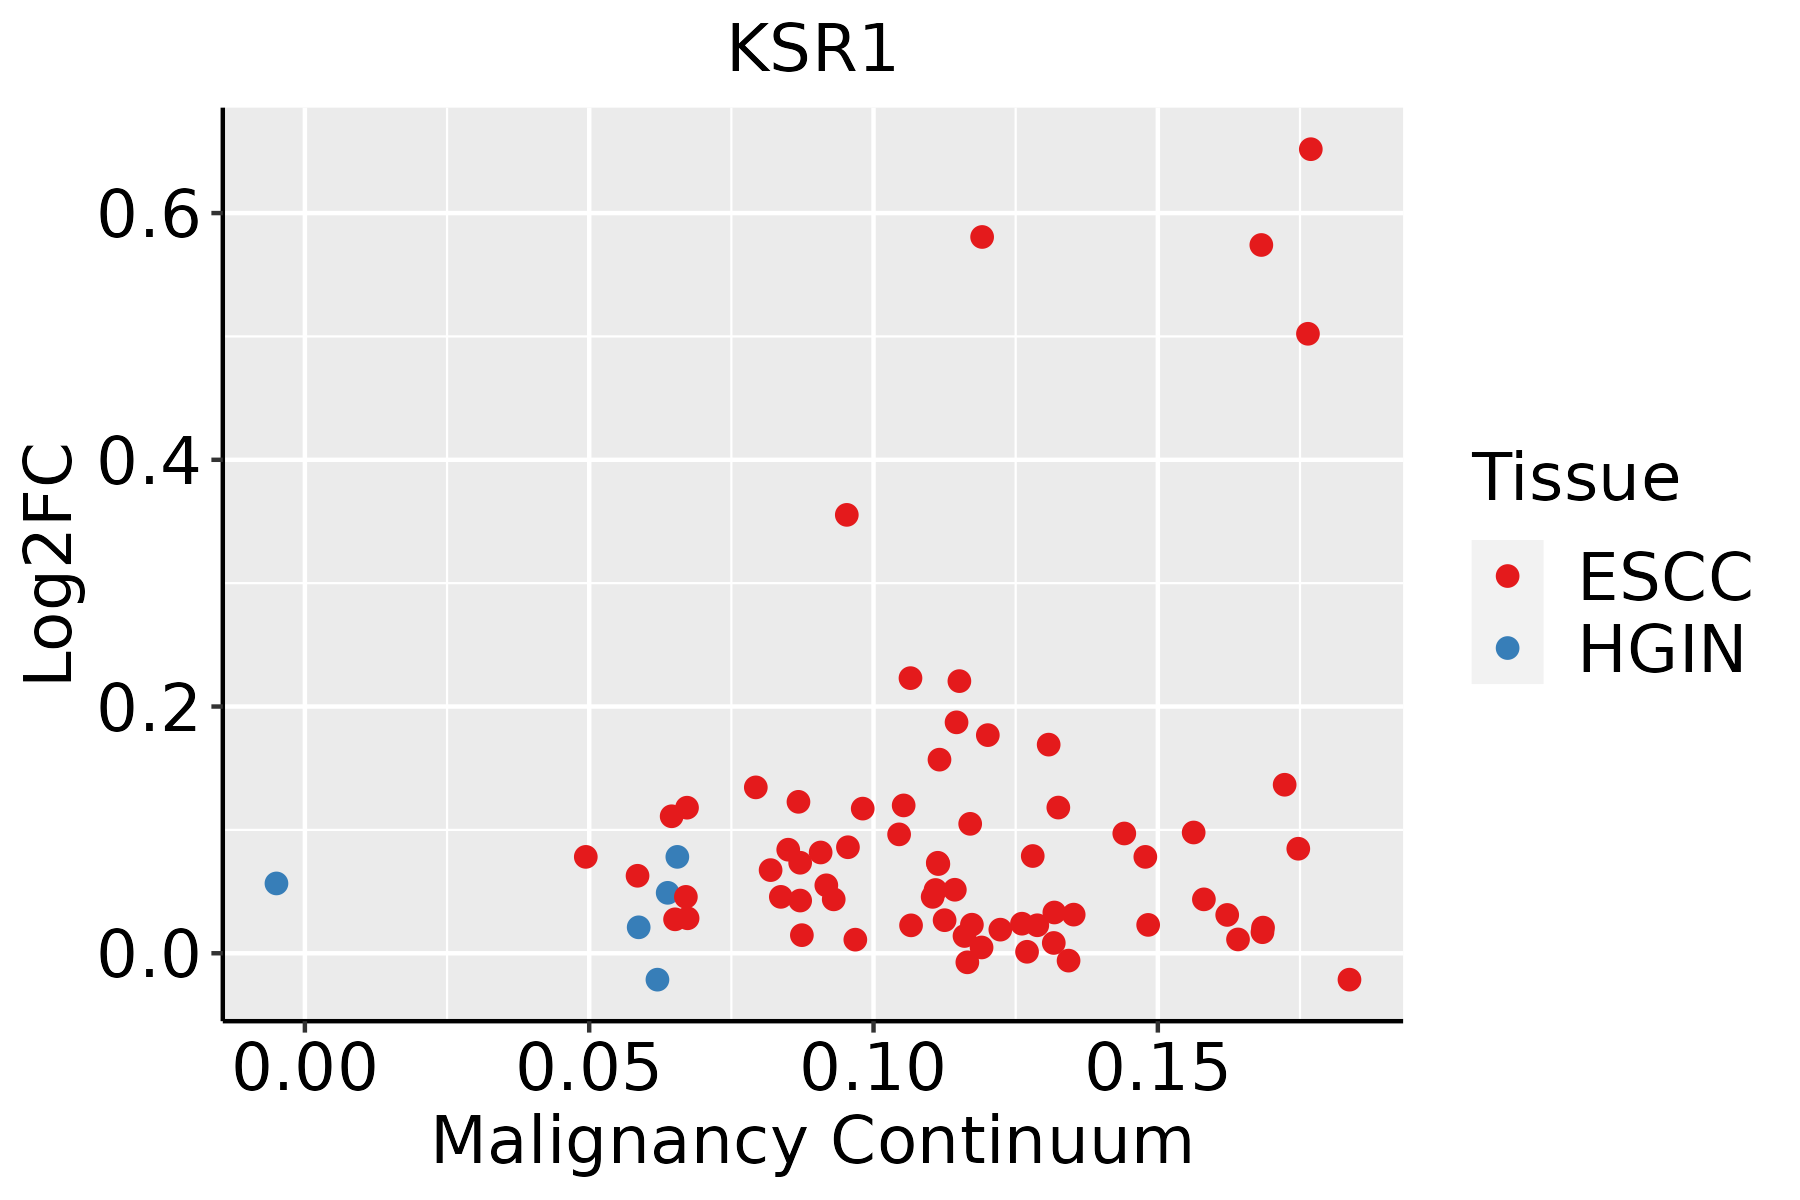 | ESCC: Esophageal squamous cell carcinoma |
| HGIN: High-grade intraepithelial neoplasias | ||
| LGIN: Low-grade intraepithelial neoplasias |
| ∗log2FC in expression of this searched gene in stem-like cells from each diseased tissue sample relative to stem-like cells in normal samples in each tissue plotted against the malignancy continuum. Samples are colored based on if they are from different disease stage. |
Top |
Malignant transformation related pathway analysis |
| Find out the enriched GO biological processes and KEGG pathways involved in transition from healthy to precancer to cancer |
| Tissue | Disease Stage | Enriched GO biological Processes |
| Colorectum | AD |  |
| Colorectum | SER |  |
| Colorectum | MSS |  |
| Colorectum | MSI-H |  |
| Colorectum | FAP |  |
| ∗Top 15 enriched GO BP terms are showed in the bar plot of each disease state in each tissue. Each row represents a significant GO biological process which is colored according to the -log10(p.adjust). |
| Page: 1 2 3 4 5 6 7 8 9 |
| GO ID | Tissue | Disease Stage | Description | Gene Ratio | Bg Ratio | pvalue | p.adjust | Count |
| GO:0007265 | Colorectum | AD | Ras protein signal transduction | 104/3918 | 337/18723 | 1.01e-05 | 2.35e-04 | 104 |
| GO:0007266 | Colorectum | AD | Rho protein signal transduction | 42/3918 | 137/18723 | 4.64e-03 | 3.16e-02 | 42 |
| GO:00072651 | Colorectum | MSS | Ras protein signal transduction | 91/3467 | 337/18723 | 7.20e-05 | 1.21e-03 | 91 |
| GO:007190016 | Esophagus | ESCC | regulation of protein serine/threonine kinase activity | 227/8552 | 359/18723 | 1.12e-11 | 4.10e-10 | 227 |
| GO:000726510 | Esophagus | ESCC | Ras protein signal transduction | 201/8552 | 337/18723 | 1.44e-07 | 2.30e-06 | 201 |
| GO:00434055 | Esophagus | ESCC | regulation of MAP kinase activity | 102/8552 | 177/18723 | 8.89e-04 | 4.55e-03 | 102 |
| GO:000726610 | Esophagus | ESCC | Rho protein signal transduction | 81/8552 | 137/18723 | 1.03e-03 | 5.20e-03 | 81 |
| GO:00072659 | Oral cavity | OSCC | Ras protein signal transduction | 185/7305 | 337/18723 | 1.95e-09 | 4.60e-08 | 185 |
| GO:00072669 | Oral cavity | OSCC | Rho protein signal transduction | 76/7305 | 137/18723 | 6.64e-05 | 5.37e-04 | 76 |
| GO:000726515 | Oral cavity | LP | Ras protein signal transduction | 109/4623 | 337/18723 | 8.44e-04 | 7.36e-03 | 109 |
| GO:000726516 | Skin | AK | Ras protein signal transduction | 68/1910 | 337/18723 | 2.83e-08 | 1.57e-06 | 68 |
| GO:000726616 | Skin | AK | Rho protein signal transduction | 31/1910 | 137/18723 | 1.60e-05 | 3.09e-04 | 31 |
| GO:000726523 | Skin | cSCC | Ras protein signal transduction | 132/4864 | 337/18723 | 6.17e-08 | 1.57e-06 | 132 |
| GO:000726617 | Skin | cSCC | Rho protein signal transduction | 51/4864 | 137/18723 | 2.38e-03 | 1.38e-02 | 51 |
| Page: 1 |
| Pathway ID | Tissue | Disease Stage | Description | Gene Ratio | Bg Ratio | pvalue | p.adjust | qvalue | Count |
| hsa046259 | Esophagus | ESCC | C-type lectin receptor signaling pathway | 73/4205 | 104/8465 | 1.57e-05 | 7.98e-05 | 4.09e-05 | 73 |
| hsa051527 | Esophagus | ESCC | Tuberculosis | 111/4205 | 180/8465 | 7.14e-04 | 2.32e-03 | 1.19e-03 | 111 |
| hsa0462513 | Esophagus | ESCC | C-type lectin receptor signaling pathway | 73/4205 | 104/8465 | 1.57e-05 | 7.98e-05 | 4.09e-05 | 73 |
| hsa0515212 | Esophagus | ESCC | Tuberculosis | 111/4205 | 180/8465 | 7.14e-04 | 2.32e-03 | 1.19e-03 | 111 |
| Page: 1 |
Top |
Cell-cell communication analysis |
| Identification of potential cell-cell interactions between two cell types and their ligand-receptor pairs for different disease states |
| Ligand | Receptor | LRpair | Pathway | Tissue | Disease Stage |
| Page: 1 |
Top |
Single-cell gene regulatory network inference analysis |
| Find out the significant the regulons (TFs) and the target genes of each regulon across cell types for different disease states |
| TF | Cell Type | Tissue | Disease Stage | Target Gene | RSS | Regulon Activity |
| ∗The dot plots of a searched regulon are shown for all cell subpopulations in each disease state of each tissue based on the regulon specific score inferred using pySCENIC and by calculating the average expression. |
| Page: 1 |
Top |
Somatic mutation of malignant transformation related genes |
| Annotation of somatic variants for genes involved in malignant transformation |
| Hugo Symbol | Variant Class | Variant Classification | dbSNP RS | HGVSc | HGVSp | HGVSp Short | SWISSPROT | BIOTYPE | SIFT | PolyPhen | Tumor Sample Barcode | Tissue | Histology | Sex | Age | Stage | Therapy Types | Drugs | Outcome |
| KSR1 | SNV | Missense_Mutation | novel | c.2085N>C | p.Gln695His | p.Q695H | Q8IVT5 | protein_coding | deleterious(0) | probably_damaging(0.997) | TCGA-3C-AALI-01 | Breast | breast invasive carcinoma | Female | <65 | I/II | Unspecific | Poly E | Complete Response |
| KSR1 | SNV | Missense_Mutation | novel | c.1135N>T | p.Ile379Phe | p.I379F | Q8IVT5 | protein_coding | tolerated(0.41) | benign(0) | TCGA-A2-A04Q-01 | Breast | breast invasive carcinoma | Female | <65 | I/II | Chemotherapy | adriamycin | SD |
| KSR1 | SNV | Missense_Mutation | c.539G>A | p.Gly180Glu | p.G180E | Q8IVT5 | protein_coding | deleterious(0) | possibly_damaging(0.802) | TCGA-A2-A0SU-01 | Breast | breast invasive carcinoma | Female | >=65 | I/II | Hormone Therapy | arimidex | SD | |
| KSR1 | SNV | Missense_Mutation | novel | c.1702N>G | p.Leu568Val | p.L568V | Q8IVT5 | protein_coding | deleterious(0.02) | probably_damaging(0.988) | TCGA-A8-A07U-01 | Breast | breast invasive carcinoma | Female | >=65 | III/IV | Chemotherapy | 5-fluorouracil | SD |
| KSR1 | SNV | Missense_Mutation | c.185N>G | p.Asp62Gly | p.D62G | Q8IVT5 | protein_coding | tolerated(0.07) | benign(0.114) | TCGA-A8-A085-01 | Breast | breast invasive carcinoma | Male | <65 | I/II | Hormone Therapy | tamoxiphen | SD | |
| KSR1 | SNV | Missense_Mutation | rs762373149 | c.847N>A | p.Glu283Lys | p.E283K | Q8IVT5 | protein_coding | tolerated(0.08) | benign(0.366) | TCGA-AN-A046-01 | Breast | breast invasive carcinoma | Female | >=65 | I/II | Unknown | Unknown | SD |
| KSR1 | SNV | Missense_Mutation | novel | c.1084N>G | p.Gln362Glu | p.Q362E | Q8IVT5 | protein_coding | tolerated(0.06) | benign(0.079) | TCGA-B6-A0IA-01 | Breast | breast invasive carcinoma | Female | <65 | I/II | Unknown | Unknown | SD |
| KSR1 | SNV | Missense_Mutation | c.1976N>G | p.Leu659Arg | p.L659R | Q8IVT5 | protein_coding | deleterious(0) | probably_damaging(1) | TCGA-EW-A1PD-01 | Breast | breast invasive carcinoma | Male | <65 | I/II | Chemotherapy | docetaxel | SD | |
| KSR1 | insertion | Frame_Shift_Ins | novel | c.1133_1134insCCATCCCATCCAGCCTCTTGGCACAGAGACTGCAGGCAACC | p.Ile379HisfsTer19 | p.I379Hfs*19 | Q8IVT5 | protein_coding | TCGA-A2-A04Q-01 | Breast | breast invasive carcinoma | Female | <65 | I/II | Chemotherapy | adriamycin | SD | ||
| KSR1 | insertion | Nonsense_Mutation | novel | c.961_962insGCTAGTATGTGTGATTG | p.Ser321CysfsTer2 | p.S321Cfs*2 | Q8IVT5 | protein_coding | TCGA-B6-A0IN-01 | Breast | breast invasive carcinoma | Female | <65 | I/II | Unknown | Unknown | PD |
| Page: 1 2 3 4 5 6 7 8 9 10 11 |
Top |
Related drugs of malignant transformation related genes |
| Identification of chemicals and drugs interact with genes involved in malignant transfromation |
| (DGIdb 4.0) |
| Entrez ID | Symbol | Category | Interaction Types | Drug Claim Name | Drug Name | PMIDs |
| Page: 1 |

Copyright 2023-Present -The University of Texas Health Science Center at Houston |