
|
|||||
|
 | |
| |
| |
| |
| |
| |
|
Gene: KRTDAP |
Gene summary for KRTDAP |
| Gene information | Species | Human | Gene symbol | KRTDAP | Gene ID | 388533 |
| Gene name | keratinocyte differentiation associated protein | |
| Gene Alias | KDAP | |
| Cytomap | 19q13.12 | |
| Gene Type | protein-coding | GO ID | GO:0008150 | UniProtAcc | P60985 |
Top |
Malignant transformation analysis |
| Identification of the aberrant gene expression in precancerous and cancerous lesions by comparing the gene expression of stem-like cells in diseased tissues with normal stem cells |
| Entrez ID | Symbol | Replicates | Species | Organ | Tissue | Adj P-value | Log2FC | Malignancy |
| 388533 | KRTDAP | C04 | Human | Oral cavity | OSCC | 5.15e-10 | 3.28e-01 | 0.2633 |
| 388533 | KRTDAP | C21 | Human | Oral cavity | OSCC | 1.61e-07 | 9.48e-01 | 0.2678 |
| 388533 | KRTDAP | C30 | Human | Oral cavity | OSCC | 1.21e-02 | 8.92e-02 | 0.3055 |
| 388533 | KRTDAP | C51 | Human | Oral cavity | OSCC | 3.71e-03 | 1.96e-01 | 0.2674 |
| 388533 | KRTDAP | C08 | Human | Oral cavity | OSCC | 1.39e-10 | 4.21e-01 | 0.1919 |
| 388533 | KRTDAP | SYSMH2 | Human | Oral cavity | OSCC | 3.39e-50 | 1.25e+00 | 0.2326 |
| 388533 | KRTDAP | SYSMH3 | Human | Oral cavity | OSCC | 4.70e-162 | 3.02e+00 | 0.2442 |
| 388533 | KRTDAP | SYSMH4 | Human | Oral cavity | OSCC | 5.96e-41 | 7.26e-01 | 0.1226 |
| 388533 | KRTDAP | SYSMH5 | Human | Oral cavity | OSCC | 4.74e-128 | 1.93e+00 | 0.0647 |
| 388533 | KRTDAP | P1_S1_AK | Human | Skin | AK | 1.94e-04 | 3.46e-01 | -0.3399 |
| 388533 | KRTDAP | P2_S3_AK | Human | Skin | AK | 1.73e-17 | 5.93e-01 | -0.3287 |
| 388533 | KRTDAP | P3_S6_AK | Human | Skin | AK | 5.12e-32 | 1.05e+00 | -0.3256 |
| 388533 | KRTDAP | P4_S8_cSCC | Human | Skin | cSCC | 5.02e-13 | 2.63e-01 | -0.3095 |
| 388533 | KRTDAP | P5_S10_cSCC | Human | Skin | cSCC | 1.40e-14 | -3.60e-01 | -0.299 |
| 388533 | KRTDAP | cSCC_p10 | Human | Skin | cSCC | 7.73e-10 | 4.50e-01 | -0.2095 |
| 388533 | KRTDAP | cSCC_p11 | Human | Skin | cSCC | 4.63e-17 | 5.23e-01 | -0.2102 |
| 388533 | KRTDAP | cSCC_p3 | Human | Skin | cSCC | 1.56e-12 | 8.08e-01 | -0.2085 |
| 388533 | KRTDAP | cSCC_p4 | Human | Skin | cSCC | 4.88e-13 | 4.74e-01 | -0.2022 |
| 388533 | KRTDAP | cSCC_p7 | Human | Skin | cSCC | 2.91e-22 | 8.02e-01 | -0.2332 |
| 388533 | KRTDAP | cSCC_p9 | Human | Skin | cSCC | 2.53e-02 | -1.88e-01 | -0.1991 |
| Page: 1 |
| Tissue | Expression Dynamics | Abbreviation |
| Oral Cavity | 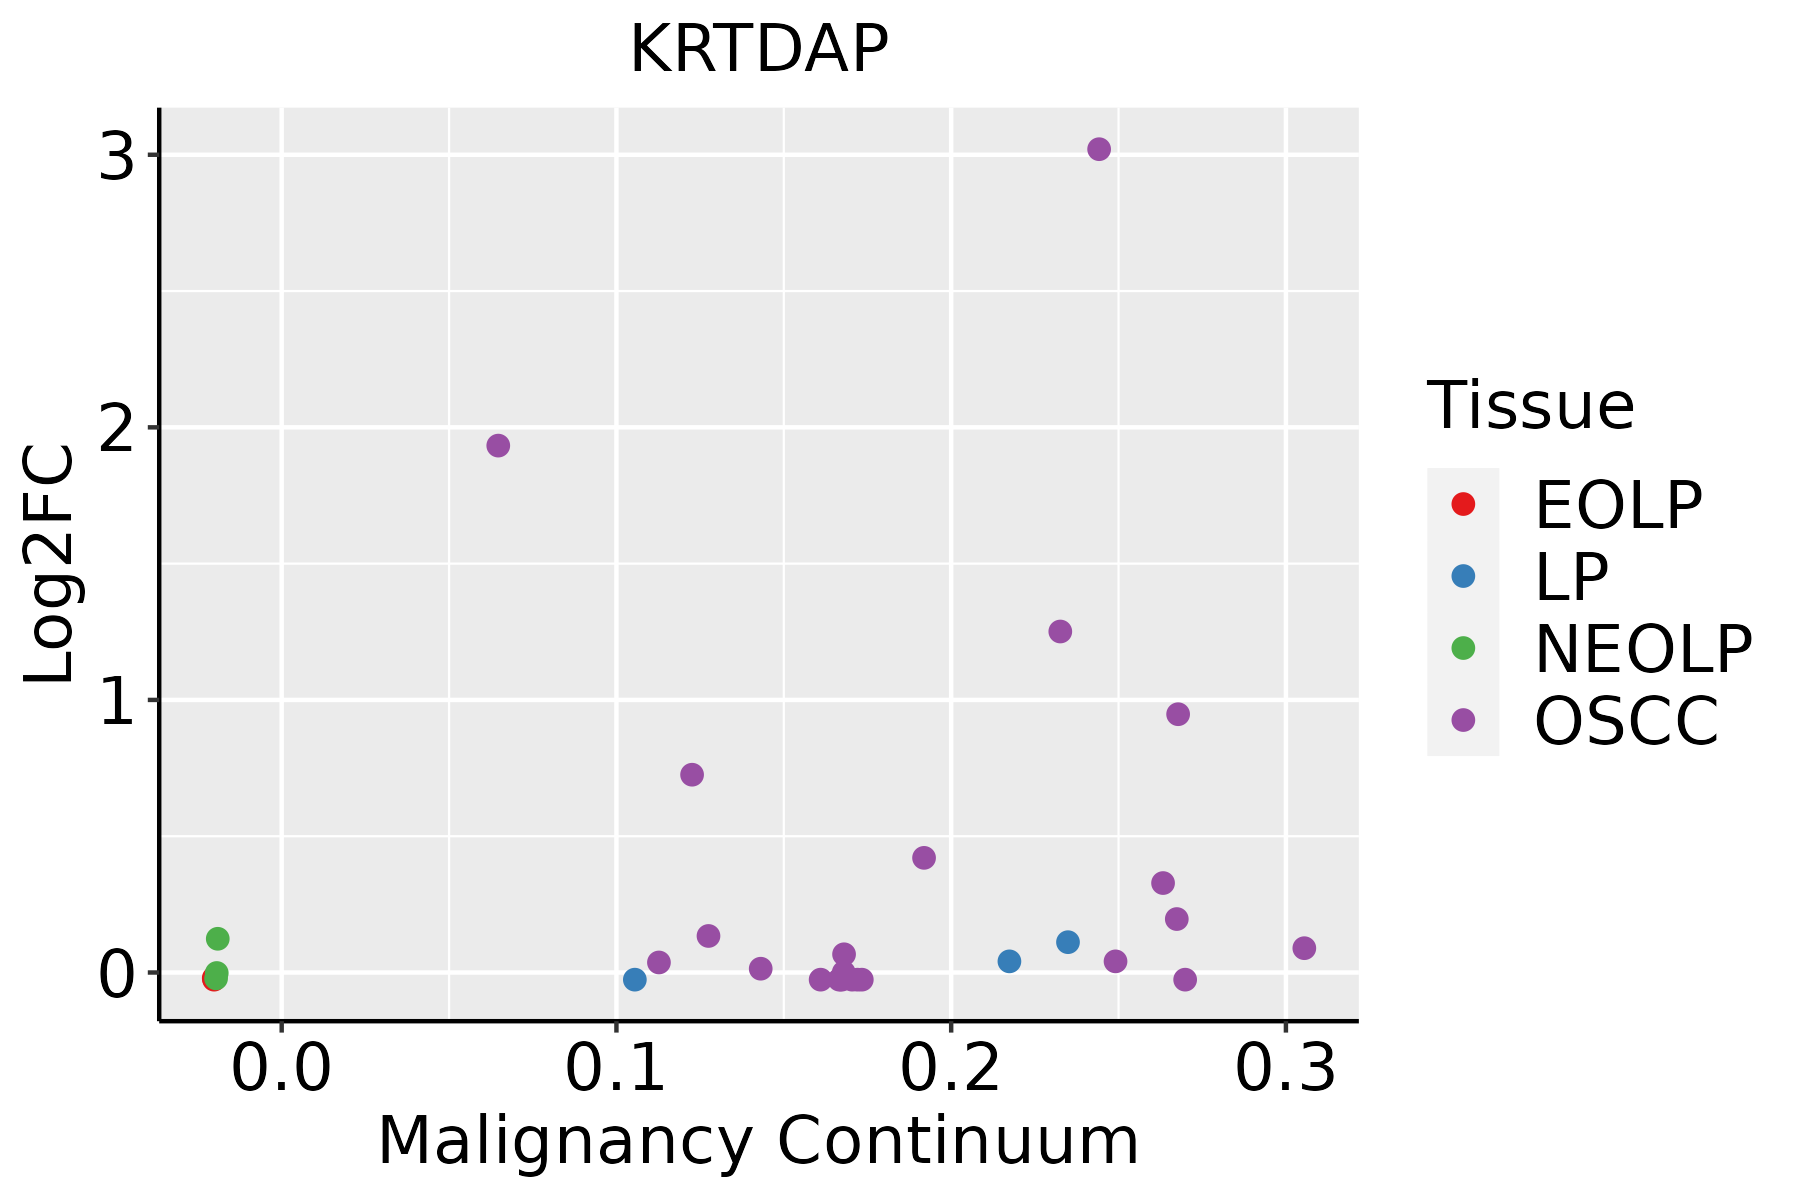 | EOLP: Erosive Oral lichen planus |
| LP: leukoplakia | ||
| NEOLP: Non-erosive oral lichen planus | ||
| OSCC: Oral squamous cell carcinoma | ||
| Skin |  | AK: Actinic keratosis |
| cSCC: Cutaneous squamous cell carcinoma | ||
| SCCIS:squamous cell carcinoma in situ |
| ∗log2FC in expression of this searched gene in stem-like cells from each diseased tissue sample relative to stem-like cells in normal samples in each tissue plotted against the malignancy continuum. Samples are colored based on if they are from different disease stage. |
Top |
Malignant transformation related pathway analysis |
| Find out the enriched GO biological processes and KEGG pathways involved in transition from healthy to precancer to cancer |
| Tissue | Disease Stage | Enriched GO biological Processes |
| Colorectum | AD |  |
| Colorectum | SER |  |
| Colorectum | MSS |  |
| Colorectum | MSI-H |  |
| Colorectum | FAP |  |
| ∗Top 15 enriched GO BP terms are showed in the bar plot of each disease state in each tissue. Each row represents a significant GO biological process which is colored according to the -log10(p.adjust). |
| Page: 1 2 3 4 5 6 7 8 9 |
| GO ID | Tissue | Disease Stage | Description | Gene Ratio | Bg Ratio | pvalue | p.adjust | Count |
| GO:00085449 | Oral cavity | OSCC | epidermis development | 171/7305 | 324/18723 | 2.89e-07 | 4.43e-06 | 171 |
| GO:000854417 | Skin | AK | epidermis development | 79/1910 | 324/18723 | 1.04e-13 | 3.25e-11 | 79 |
| GO:000854425 | Skin | cSCC | epidermis development | 131/4864 | 324/18723 | 7.38e-09 | 2.39e-07 | 131 |
| Page: 1 |
| Pathway ID | Tissue | Disease Stage | Description | Gene Ratio | Bg Ratio | pvalue | p.adjust | qvalue | Count |
| Page: 1 |
Top |
Cell-cell communication analysis |
| Identification of potential cell-cell interactions between two cell types and their ligand-receptor pairs for different disease states |
| Ligand | Receptor | LRpair | Pathway | Tissue | Disease Stage |
| Page: 1 |
Top |
Single-cell gene regulatory network inference analysis |
| Find out the significant the regulons (TFs) and the target genes of each regulon across cell types for different disease states |
| TF | Cell Type | Tissue | Disease Stage | Target Gene | RSS | Regulon Activity |
| ∗The dot plots of a searched regulon are shown for all cell subpopulations in each disease state of each tissue based on the regulon specific score inferred using pySCENIC and by calculating the average expression. |
| Page: 1 |
Top |
Somatic mutation of malignant transformation related genes |
| Annotation of somatic variants for genes involved in malignant transformation |
| Hugo Symbol | Variant Class | Variant Classification | dbSNP RS | HGVSc | HGVSp | HGVSp Short | SWISSPROT | BIOTYPE | SIFT | PolyPhen | Tumor Sample Barcode | Tissue | Histology | Sex | Age | Stage | Therapy Types | Drugs | Outcome |
| KRTDAP | insertion | In_Frame_Ins | novel | c.268_269insATTTGTCAGAGGTCAGGGCCACCTCCATTCAGAGGCCATTCACGG | p.Lys89_Gly90insAspLeuSerGluValArgAlaThrSerIleGlnArgProPheThr | p.K89_G90insDLSEVRATSIQRPFT | P60985 | protein_coding | TCGA-A8-A0A4-01 | Breast | breast invasive carcinoma | Female | >=65 | I/II | Hormone Therapy | tamoxiphen | CR | ||
| KRTDAP | SNV | Missense_Mutation | rs141811528 | c.202G>A | p.Ala68Thr | p.A68T | P60985 | protein_coding | deleterious(0.01) | probably_damaging(0.998) | TCGA-EA-A410-01 | Cervix | cervical & endocervical cancer | Female | <65 | I/II | Unknown | Unknown | SD |
| KRTDAP | SNV | Missense_Mutation | rs559587916 | c.280G>A | p.Ala94Thr | p.A94T | P60985 | protein_coding | tolerated_low_confidence(0.06) | benign(0.053) | TCGA-CM-6171-01 | Colorectum | colon adenocarcinoma | Female | >=65 | I/II | Unknown | Unknown | SD |
| KRTDAP | SNV | Missense_Mutation | rs756774178 | c.164N>A | p.Arg55Gln | p.R55Q | P60985 | protein_coding | tolerated(0.14) | benign(0.033) | TCGA-EI-6917-01 | Colorectum | rectum adenocarcinoma | Male | <65 | III/IV | Chemotherapy | 5fluorouracil+oxaciplatina+l-folinian | SD |
| KRTDAP | SNV | Missense_Mutation | novel | c.290N>G | p.Asp97Gly | p.D97G | P60985 | protein_coding | deleterious_low_confidence(0) | possibly_damaging(0.488) | TCGA-A5-A1OF-01 | Endometrium | uterine corpus endometrioid carcinoma | Female | <65 | I/II | Unknown | Unknown | SD |
| KRTDAP | SNV | Missense_Mutation | rs141811528 | c.202N>A | p.Ala68Thr | p.A68T | P60985 | protein_coding | deleterious(0.01) | probably_damaging(0.998) | TCGA-AP-A059-01 | Endometrium | uterine corpus endometrioid carcinoma | Female | >=65 | I/II | Unknown | Unknown | SD |
| KRTDAP | SNV | Missense_Mutation | novel | c.119G>A | p.Arg40Gln | p.R40Q | P60985 | protein_coding | tolerated_low_confidence(0.13) | benign(0.015) | TCGA-AP-A0LM-01 | Endometrium | uterine corpus endometrioid carcinoma | Female | <65 | III/IV | Chemotherapy | cisplatin | SD |
| KRTDAP | SNV | Missense_Mutation | c.105G>T | p.Glu35Asp | p.E35D | P60985 | protein_coding | tolerated_low_confidence(0.39) | benign(0) | TCGA-BS-A0UV-01 | Endometrium | uterine corpus endometrioid carcinoma | Female | <65 | III/IV | Unknown | Unknown | SD | |
| KRTDAP | SNV | Missense_Mutation | c.35N>C | p.Leu12Pro | p.L12P | P60985 | protein_coding | deleterious_low_confidence(0) | probably_damaging(0.976) | TCGA-34-5231-01 | Lung | lung squamous cell carcinoma | Male | >=65 | I/II | Unknown | Unknown | SD | |
| KRTDAP | SNV | Missense_Mutation | rs764010719 | c.25G>A | p.Val9Met | p.V9M | P60985 | protein_coding | deleterious_low_confidence(0) | benign(0.344) | TCGA-EJ-5519-01 | Prostate | prostate adenocarcinoma | Male | <65 | 8 | Unknown | Unknown | SD |
| Page: 1 2 |
Top |
Related drugs of malignant transformation related genes |
| Identification of chemicals and drugs interact with genes involved in malignant transfromation |
| (DGIdb 4.0) |
| Entrez ID | Symbol | Category | Interaction Types | Drug Claim Name | Drug Name | PMIDs |
| Page: 1 |

Copyright 2023-Present -The University of Texas Health Science Center at Houston |