
|
|||||
|
 | |
| |
| |
| |
| |
| |
|
Gene: KRT81 |
Gene summary for KRT81 |
| Gene information | Species | Human | Gene symbol | KRT81 | Gene ID | 3887 |
| Gene name | keratin 81 | |
| Gene Alias | HB1 | |
| Cytomap | 12q13.13 | |
| Gene Type | protein-coding | GO ID | GO:0005575 | UniProtAcc | Q14533 |
Top |
Malignant transformation analysis |
| Identification of the aberrant gene expression in precancerous and cancerous lesions by comparing the gene expression of stem-like cells in diseased tissues with normal stem cells |
| Entrez ID | Symbol | Replicates | Species | Organ | Tissue | Adj P-value | Log2FC | Malignancy |
| 3887 | KRT81 | GSM4909281 | Human | Breast | IDC | 7.49e-19 | 7.35e-01 | 0.21 |
| 3887 | KRT81 | GSM4909286 | Human | Breast | IDC | 7.43e-04 | -2.10e-01 | 0.1081 |
| 3887 | KRT81 | GSM4909287 | Human | Breast | IDC | 9.59e-04 | 4.19e-01 | 0.2057 |
| 3887 | KRT81 | GSM4909290 | Human | Breast | IDC | 1.77e-05 | 5.31e-01 | 0.2096 |
| 3887 | KRT81 | GSM4909291 | Human | Breast | IDC | 7.43e-04 | 4.74e-01 | 0.1753 |
| 3887 | KRT81 | GSM4909295 | Human | Breast | IDC | 6.72e-53 | 1.65e+00 | 0.0898 |
| 3887 | KRT81 | GSM4909297 | Human | Breast | IDC | 1.18e-02 | -1.90e-01 | 0.1517 |
| 3887 | KRT81 | GSM4909298 | Human | Breast | IDC | 1.11e-35 | 7.37e-01 | 0.1551 |
| 3887 | KRT81 | GSM4909299 | Human | Breast | IDC | 1.67e-02 | 2.34e-01 | 0.035 |
| 3887 | KRT81 | GSM4909300 | Human | Breast | IDC | 1.90e-03 | 5.30e-01 | 0.0334 |
| 3887 | KRT81 | GSM4909301 | Human | Breast | IDC | 1.57e-03 | -2.16e-01 | 0.1577 |
| 3887 | KRT81 | GSM4909302 | Human | Breast | IDC | 1.66e-02 | -1.91e-01 | 0.1545 |
| 3887 | KRT81 | GSM4909304 | Human | Breast | IDC | 2.08e-02 | -2.12e-01 | 0.1636 |
| 3887 | KRT81 | GSM4909308 | Human | Breast | IDC | 1.56e-04 | -2.16e-01 | 0.158 |
| 3887 | KRT81 | GSM4909309 | Human | Breast | IDC | 1.24e-26 | 1.04e+00 | 0.0483 |
| 3887 | KRT81 | GSM4909319 | Human | Breast | IDC | 1.57e-03 | -2.11e-01 | 0.1563 |
| 3887 | KRT81 | GSM4909321 | Human | Breast | IDC | 1.65e-04 | -2.16e-01 | 0.1559 |
| 3887 | KRT81 | brca1 | Human | Breast | Precancer | 8.36e-05 | 4.19e-01 | -0.0338 |
| 3887 | KRT81 | brca2 | Human | Breast | Precancer | 4.77e-10 | 3.89e-01 | -0.024 |
| 3887 | KRT81 | brca3 | Human | Breast | Precancer | 2.84e-03 | 2.46e-01 | -0.0263 |
| Page: 1 2 |
| Tissue | Expression Dynamics | Abbreviation |
| Breast | 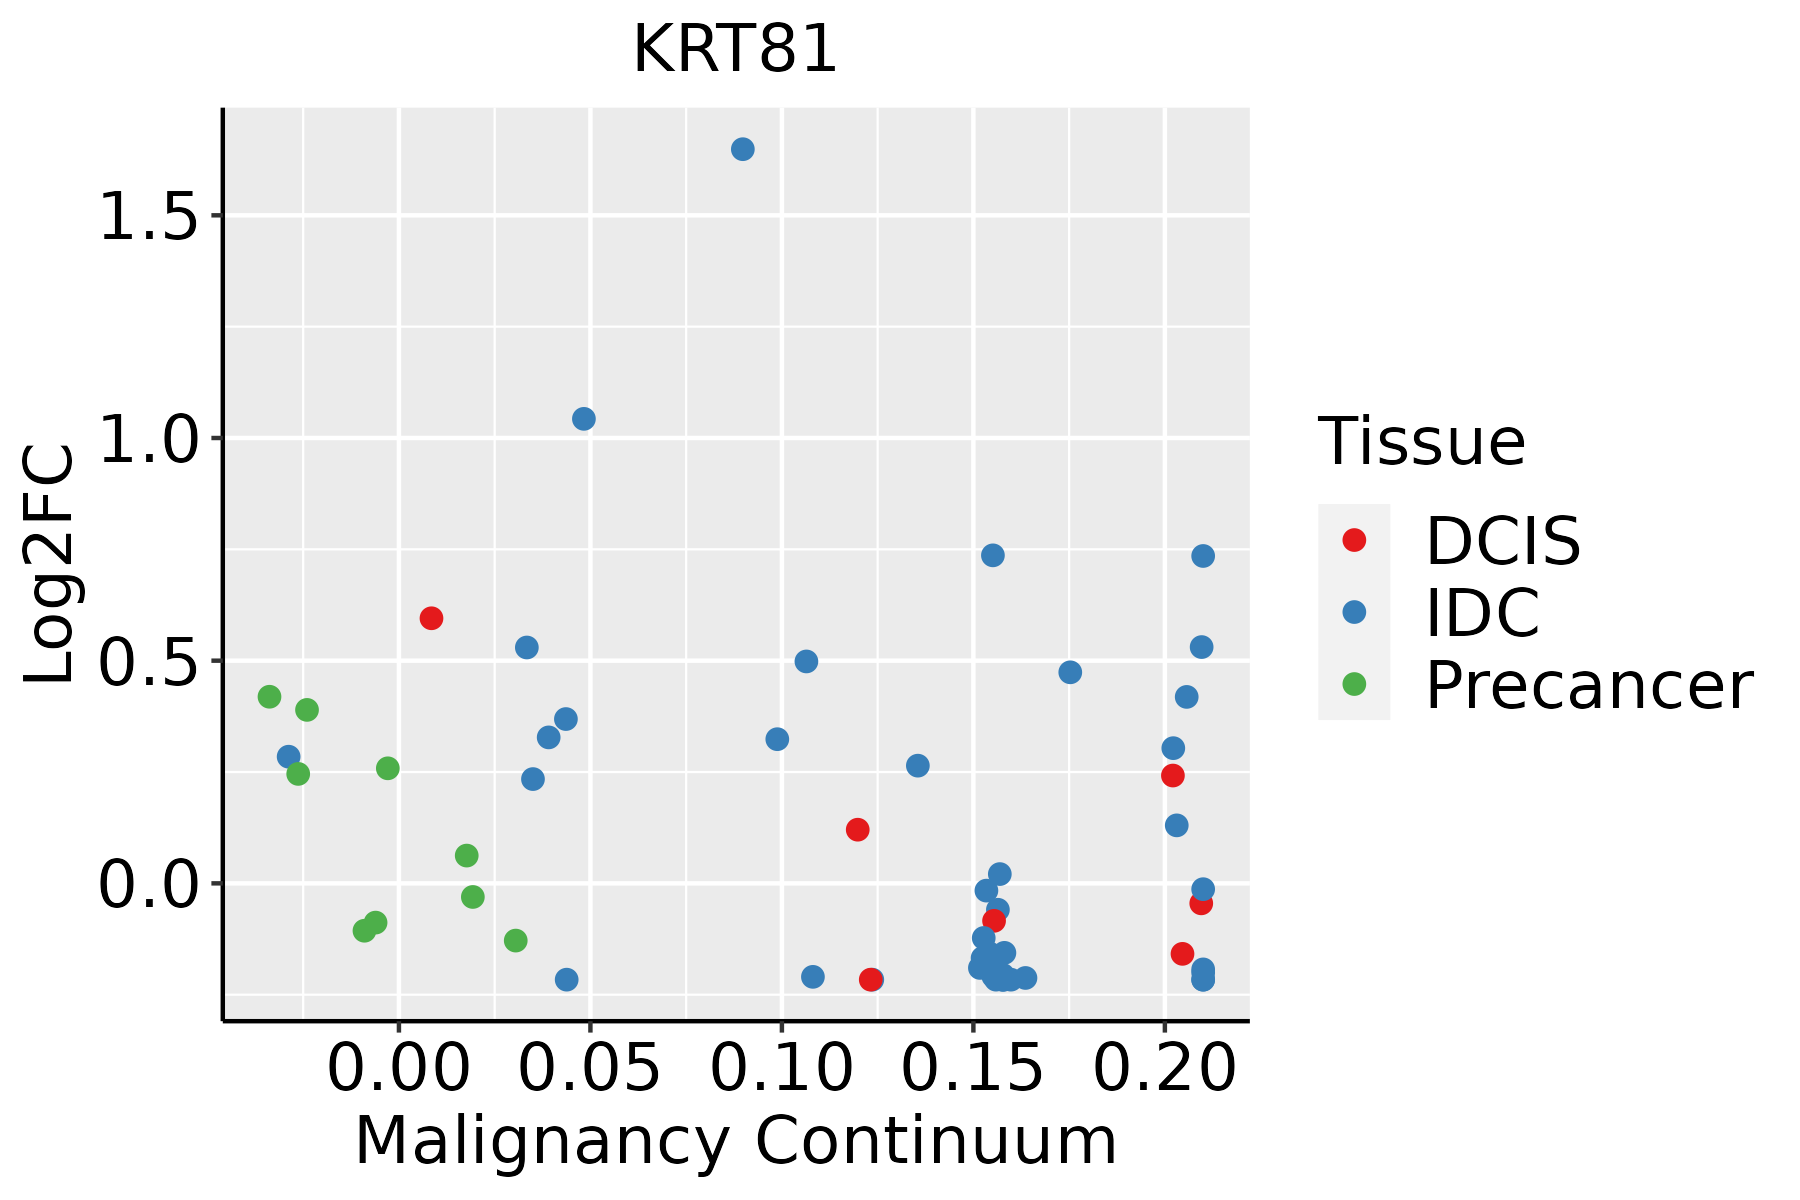 | IDC: Invasive ductal carcinoma |
| DCIS: Ductal carcinoma in situ | ||
| Precancer(BRCA1-mut): Precancerous lesion from BRCA1 mutation carriers | ||
| Esophagus | 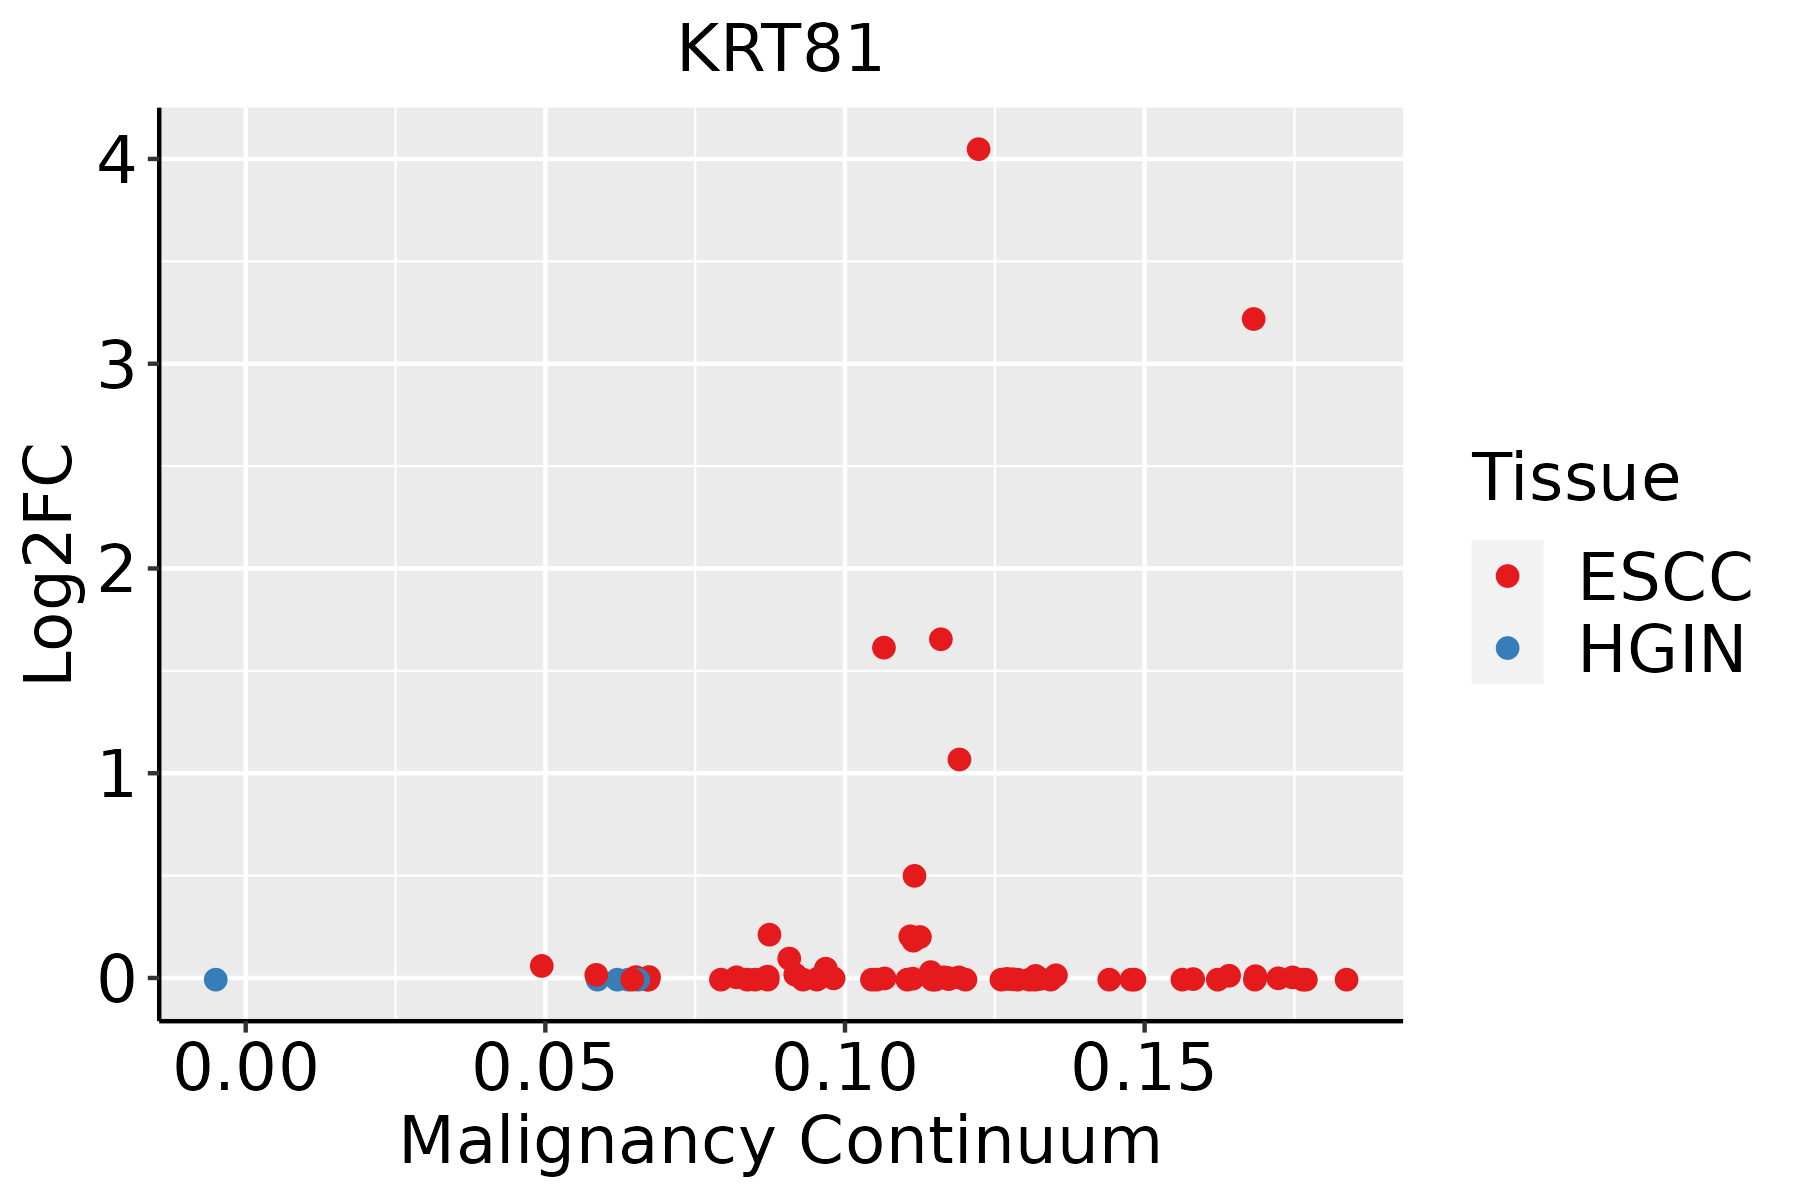 | ESCC: Esophageal squamous cell carcinoma |
| HGIN: High-grade intraepithelial neoplasias | ||
| LGIN: Low-grade intraepithelial neoplasias |
| ∗log2FC in expression of this searched gene in stem-like cells from each diseased tissue sample relative to stem-like cells in normal samples in each tissue plotted against the malignancy continuum. Samples are colored based on if they are from different disease stage. |
Top |
Malignant transformation related pathway analysis |
| Find out the enriched GO biological processes and KEGG pathways involved in transition from healthy to precancer to cancer |
| Tissue | Disease Stage | Enriched GO biological Processes |
| Colorectum | AD |  |
| Colorectum | SER |  |
| Colorectum | MSS |  |
| Colorectum | MSI-H |  |
| Colorectum | FAP |  |
| ∗Top 15 enriched GO BP terms are showed in the bar plot of each disease state in each tissue. Each row represents a significant GO biological process which is colored according to the -log10(p.adjust). |
| Page: 1 2 3 4 5 6 7 8 9 |
| GO ID | Tissue | Disease Stage | Description | Gene Ratio | Bg Ratio | pvalue | p.adjust | Count |
| Page: 1 |
| Pathway ID | Tissue | Disease Stage | Description | Gene Ratio | Bg Ratio | pvalue | p.adjust | qvalue | Count |
| Page: 1 |
Top |
Cell-cell communication analysis |
| Identification of potential cell-cell interactions between two cell types and their ligand-receptor pairs for different disease states |
| Ligand | Receptor | LRpair | Pathway | Tissue | Disease Stage |
| Page: 1 |
Top |
Single-cell gene regulatory network inference analysis |
| Find out the significant the regulons (TFs) and the target genes of each regulon across cell types for different disease states |
| TF | Cell Type | Tissue | Disease Stage | Target Gene | RSS | Regulon Activity |
| ∗The dot plots of a searched regulon are shown for all cell subpopulations in each disease state of each tissue based on the regulon specific score inferred using pySCENIC and by calculating the average expression. |
| Page: 1 |
Top |
Somatic mutation of malignant transformation related genes |
| Annotation of somatic variants for genes involved in malignant transformation |
| Hugo Symbol | Variant Class | Variant Classification | dbSNP RS | HGVSc | HGVSp | HGVSp Short | SWISSPROT | BIOTYPE | SIFT | PolyPhen | Tumor Sample Barcode | Tissue | Histology | Sex | Age | Stage | Therapy Types | Drugs | Outcome |
| KRT81 | insertion | Nonsense_Mutation | novel | c.1016_1017insTCAGTGATGCCCGCT | p.Ala339_Lys340insGlnTerCysProLeu | p.A339_K340insQ*CPL | Q14533 | protein_coding | TCGA-BH-A0B9-01 | Breast | breast invasive carcinoma | Female | <65 | I/II | Chemotherapy | cyclophosphamide | SD | ||
| KRT81 | SNV | Missense_Mutation | c.1370N>A | p.Cys457Tyr | p.C457Y | Q14533 | protein_coding | tolerated(0.14) | possibly_damaging(0.836) | TCGA-EK-A2R8-01 | Cervix | cervical & endocervical cancer | Female | <65 | I/II | Unknown | Unknown | SD | |
| KRT81 | SNV | Missense_Mutation | rs753782485 | c.28N>T | p.Arg10Cys | p.R10C | Q14533 | protein_coding | deleterious(0) | possibly_damaging(0.587) | TCGA-MA-AA42-01 | Cervix | cervical & endocervical cancer | Female | >=65 | I/II | Unknown | Unknown | SD |
| KRT81 | SNV | Missense_Mutation | rs139838048 | c.1337N>A | p.Arg446Gln | p.R446Q | Q14533 | protein_coding | tolerated(0.37) | benign(0.019) | TCGA-ZX-AA5X-01 | Cervix | cervical & endocervical cancer | Female | <65 | III/IV | Unknown | Unknown | SD |
| KRT81 | SNV | Missense_Mutation | novel | c.718N>G | p.Arg240Gly | p.R240G | Q14533 | protein_coding | deleterious(0.01) | benign(0.05) | TCGA-5M-AAT6-01 | Colorectum | colon adenocarcinoma | Female | <65 | III/IV | Unknown | Unknown | PD |
| KRT81 | SNV | Missense_Mutation | novel | c.1295N>A | p.Arg432Gln | p.R432Q | Q14533 | protein_coding | tolerated(0.35) | benign(0.038) | TCGA-A6-2683-01 | Colorectum | colon adenocarcinoma | Female | <65 | III/IV | Chemotherapy | irinotecan | PD |
| KRT81 | SNV | Missense_Mutation | rs145562431 | c.721N>T | p.Arg241Trp | p.R241W | Q14533 | protein_coding | deleterious(0.01) | possibly_damaging(0.846) | TCGA-AA-3984-01 | Colorectum | colon adenocarcinoma | Female | <65 | I/II | Unknown | Unknown | SD |
| KRT81 | SNV | Missense_Mutation | rs767515484 | c.1181N>G | p.Asn394Ser | p.N394S | Q14533 | protein_coding | deleterious(0.04) | possibly_damaging(0.588) | TCGA-CM-4743-01 | Colorectum | colon adenocarcinoma | Male | >=65 | I/II | Chemotherapy | capecitabine | SD |
| KRT81 | SNV | Missense_Mutation | c.715C>A | p.Leu239Met | p.L239M | Q14533 | protein_coding | deleterious(0.01) | possibly_damaging(0.633) | TCGA-NH-A5IV-01 | Colorectum | colon adenocarcinoma | Female | >=65 | I/II | Unknown | Unknown | SD | |
| KRT81 | SNV | Missense_Mutation | c.1063N>A | p.Gln355Lys | p.Q355K | Q14533 | protein_coding | deleterious(0.01) | possibly_damaging(0.816) | TCGA-F5-6813-01 | Colorectum | rectum adenocarcinoma | Male | >=65 | III/IV | Unknown | Unknown | PD |
| Page: 1 2 3 4 |
Top |
Related drugs of malignant transformation related genes |
| Identification of chemicals and drugs interact with genes involved in malignant transfromation |
| (DGIdb 4.0) |
| Entrez ID | Symbol | Category | Interaction Types | Drug Claim Name | Drug Name | PMIDs |
| Page: 1 |

Copyright 2023-Present -The University of Texas Health Science Center at Houston |