
|
|||||
|
 | |
| |
| |
| |
| |
| |
|
Gene: KRT80 |
Gene summary for KRT80 |
| Gene information | Species | Human | Gene symbol | KRT80 | Gene ID | 144501 |
| Gene name | keratin 80 | |
| Gene Alias | KB20 | |
| Cytomap | 12q13.13 | |
| Gene Type | protein-coding | GO ID | GO:0005575 | UniProtAcc | Q6KB66 |
Top |
Malignant transformation analysis |
| Identification of the aberrant gene expression in precancerous and cancerous lesions by comparing the gene expression of stem-like cells in diseased tissues with normal stem cells |
| Entrez ID | Symbol | Replicates | Species | Organ | Tissue | Adj P-value | Log2FC | Malignancy |
| 144501 | KRT80 | LZE24T | Human | Esophagus | ESCC | 9.85e-13 | 9.59e-01 | 0.0596 |
| 144501 | KRT80 | P1T-E | Human | Esophagus | ESCC | 2.42e-02 | 5.77e-01 | 0.0875 |
| 144501 | KRT80 | P4T-E | Human | Esophagus | ESCC | 1.25e-03 | 2.97e-02 | 0.1323 |
| 144501 | KRT80 | P5T-E | Human | Esophagus | ESCC | 8.82e-03 | 1.57e-01 | 0.1327 |
| 144501 | KRT80 | P8T-E | Human | Esophagus | ESCC | 6.93e-12 | 2.14e-01 | 0.0889 |
| 144501 | KRT80 | P17T-E | Human | Esophagus | ESCC | 3.46e-05 | 3.22e-01 | 0.1278 |
| 144501 | KRT80 | P23T-E | Human | Esophagus | ESCC | 5.53e-12 | 1.55e+00 | 0.108 |
| 144501 | KRT80 | P31T-E | Human | Esophagus | ESCC | 2.42e-04 | 3.54e-01 | 0.1251 |
| 144501 | KRT80 | P36T-E | Human | Esophagus | ESCC | 1.27e-02 | 6.65e-01 | 0.1187 |
| 144501 | KRT80 | P37T-E | Human | Esophagus | ESCC | 5.57e-03 | 1.19e-01 | 0.1371 |
| 144501 | KRT80 | P39T-E | Human | Esophagus | ESCC | 9.64e-16 | 1.08e+00 | 0.0894 |
| 144501 | KRT80 | P57T-E | Human | Esophagus | ESCC | 6.34e-08 | 3.86e-01 | 0.0926 |
| 144501 | KRT80 | P61T-E | Human | Esophagus | ESCC | 4.68e-08 | 3.17e-01 | 0.099 |
| 144501 | KRT80 | P75T-E | Human | Esophagus | ESCC | 3.07e-19 | 7.83e-01 | 0.1125 |
| 144501 | KRT80 | P76T-E | Human | Esophagus | ESCC | 9.49e-11 | 4.46e-01 | 0.1207 |
| 144501 | KRT80 | P79T-E | Human | Esophagus | ESCC | 1.49e-03 | 1.30e-01 | 0.1154 |
| 144501 | KRT80 | P82T-E | Human | Esophagus | ESCC | 9.73e-09 | 1.43e+00 | 0.1072 |
| 144501 | KRT80 | P107T-E | Human | Esophagus | ESCC | 1.48e-20 | 7.08e-01 | 0.171 |
| 144501 | KRT80 | P128T-E | Human | Esophagus | ESCC | 2.30e-09 | 5.12e-01 | 0.1241 |
| 144501 | KRT80 | P130T-E | Human | Esophagus | ESCC | 3.71e-38 | 8.51e-01 | 0.1676 |
| Page: 1 2 |
| Tissue | Expression Dynamics | Abbreviation |
| Esophagus |  | ESCC: Esophageal squamous cell carcinoma |
| HGIN: High-grade intraepithelial neoplasias | ||
| LGIN: Low-grade intraepithelial neoplasias | ||
| Oral Cavity | 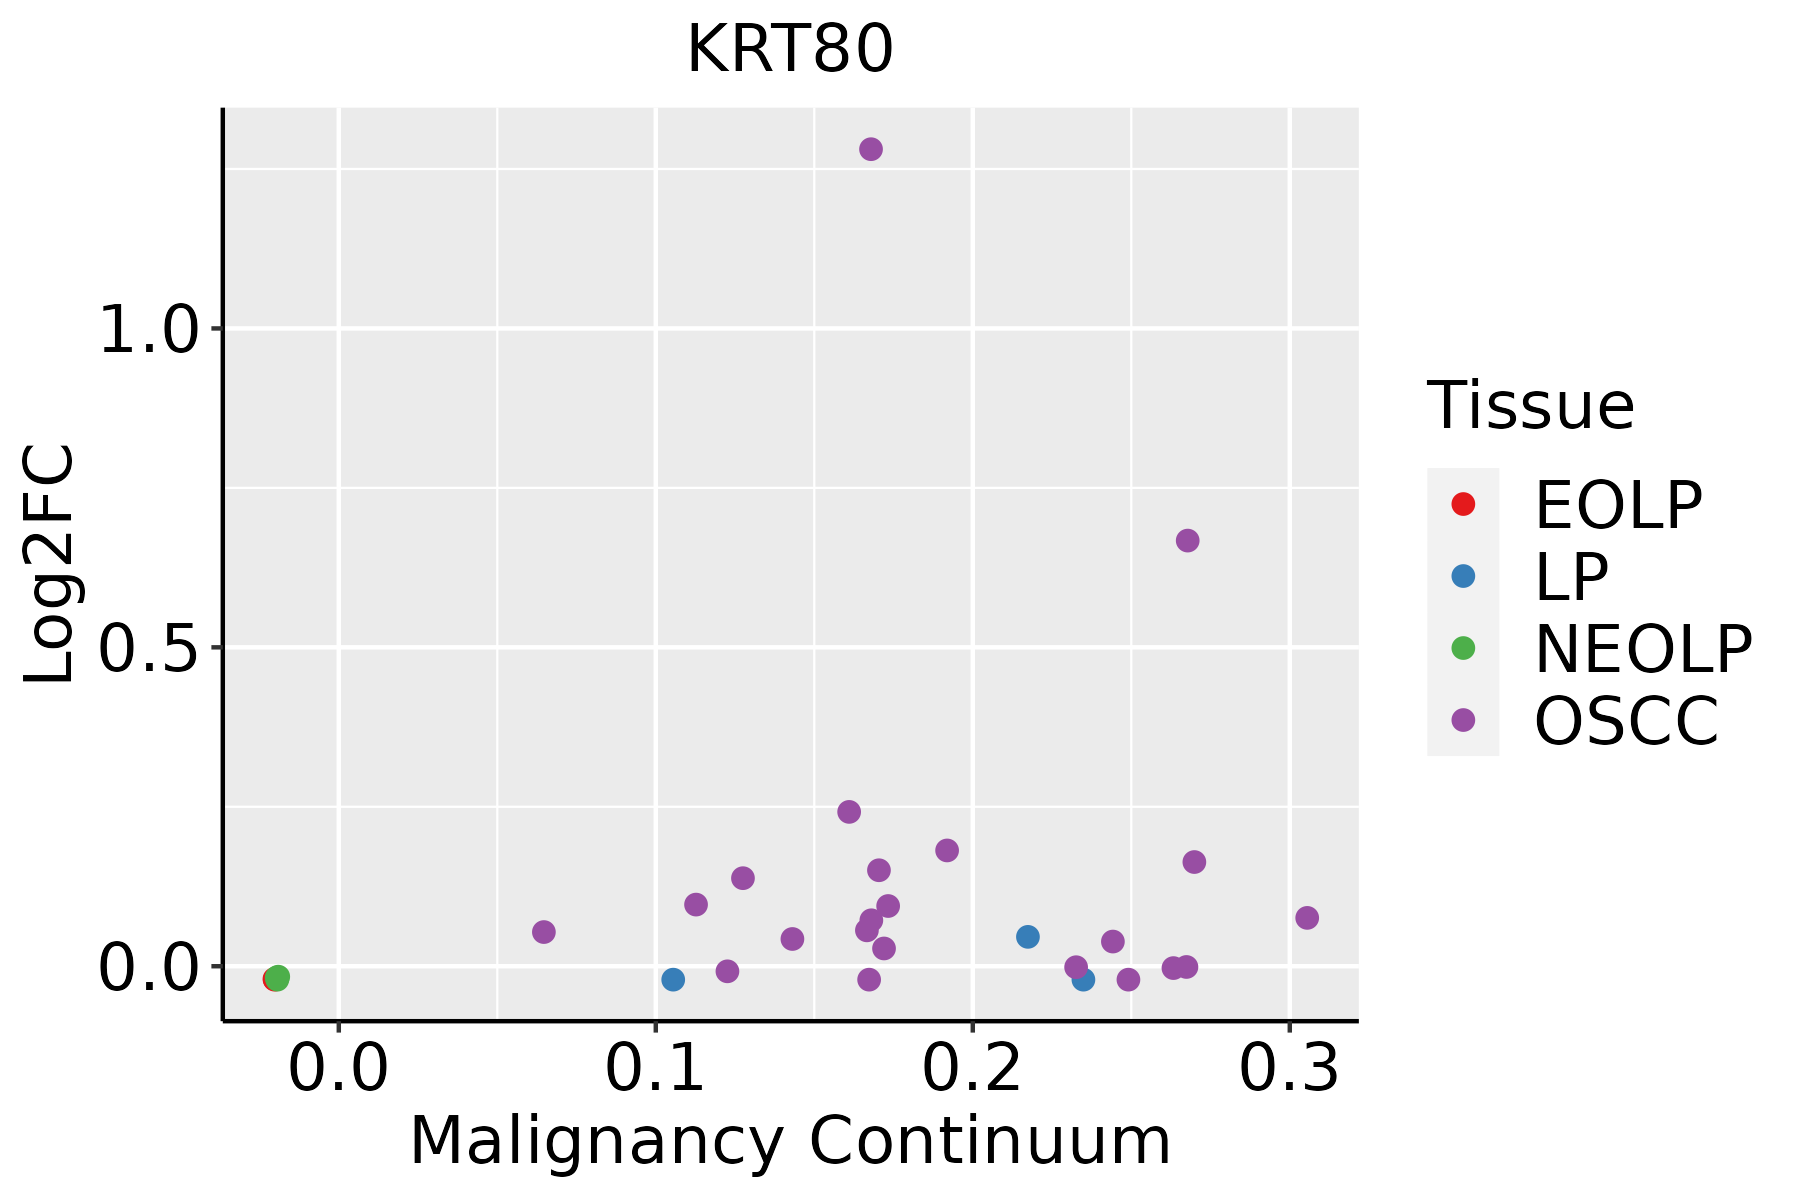 | EOLP: Erosive Oral lichen planus |
| LP: leukoplakia | ||
| NEOLP: Non-erosive oral lichen planus | ||
| OSCC: Oral squamous cell carcinoma |
| ∗log2FC in expression of this searched gene in stem-like cells from each diseased tissue sample relative to stem-like cells in normal samples in each tissue plotted against the malignancy continuum. Samples are colored based on if they are from different disease stage. |
Top |
Malignant transformation related pathway analysis |
| Find out the enriched GO biological processes and KEGG pathways involved in transition from healthy to precancer to cancer |
| Tissue | Disease Stage | Enriched GO biological Processes |
| Colorectum | AD |  |
| Colorectum | SER |  |
| Colorectum | MSS |  |
| Colorectum | MSI-H |  |
| Colorectum | FAP |  |
| ∗Top 15 enriched GO BP terms are showed in the bar plot of each disease state in each tissue. Each row represents a significant GO biological process which is colored according to the -log10(p.adjust). |
| Page: 1 2 3 4 5 6 7 8 9 |
| GO ID | Tissue | Disease Stage | Description | Gene Ratio | Bg Ratio | pvalue | p.adjust | Count |
| Page: 1 |
| Pathway ID | Tissue | Disease Stage | Description | Gene Ratio | Bg Ratio | pvalue | p.adjust | qvalue | Count |
| Page: 1 |
Top |
Cell-cell communication analysis |
| Identification of potential cell-cell interactions between two cell types and their ligand-receptor pairs for different disease states |
| Ligand | Receptor | LRpair | Pathway | Tissue | Disease Stage |
| Page: 1 |
Top |
Single-cell gene regulatory network inference analysis |
| Find out the significant the regulons (TFs) and the target genes of each regulon across cell types for different disease states |
| TF | Cell Type | Tissue | Disease Stage | Target Gene | RSS | Regulon Activity |
| ∗The dot plots of a searched regulon are shown for all cell subpopulations in each disease state of each tissue based on the regulon specific score inferred using pySCENIC and by calculating the average expression. |
| Page: 1 |
Top |
Somatic mutation of malignant transformation related genes |
| Annotation of somatic variants for genes involved in malignant transformation |
| Hugo Symbol | Variant Class | Variant Classification | dbSNP RS | HGVSc | HGVSp | HGVSp Short | SWISSPROT | BIOTYPE | SIFT | PolyPhen | Tumor Sample Barcode | Tissue | Histology | Sex | Age | Stage | Therapy Types | Drugs | Outcome |
| KRT80 | SNV | Missense_Mutation | rs201244168 | c.1271N>A | p.Arg424Gln | p.R424Q | Q6KB66 | protein_coding | tolerated(0.06) | benign(0.375) | TCGA-A2-A0EV-01 | Breast | breast invasive carcinoma | Female | >=65 | I/II | Unknown | Unknown | SD |
| KRT80 | SNV | Missense_Mutation | novel | c.1354G>C | p.Glu452Gln | p.E452Q | Q6KB66 | protein_coding | tolerated_low_confidence(0.35) | benign(0.005) | TCGA-E2-A1LI-01 | Breast | breast invasive carcinoma | Female | <65 | I/II | Chemotherapy | adriamycin | SD |
| KRT80 | insertion | Frame_Shift_Ins | novel | c.210_211insTTCCTAGACTCCA | p.Lys71PhefsTer26 | p.K71Ffs*26 | Q6KB66 | protein_coding | TCGA-BH-A0HF-01 | Breast | breast invasive carcinoma | Female | >=65 | I/II | Hormone Therapy | arimidex | SD | ||
| KRT80 | deletion | Frame_Shift_Del | novel | c.923delN | p.Lys308SerfsTer14 | p.K308Sfs*14 | Q6KB66 | protein_coding | TCGA-EW-A2FV-01 | Breast | breast invasive carcinoma | Female | <65 | III/IV | Chemotherapy | docetaxel | SD | ||
| KRT80 | SNV | Missense_Mutation | rs747478529 | c.283N>A | p.Ala95Thr | p.A95T | Q6KB66 | protein_coding | deleterious(0.01) | probably_damaging(0.999) | TCGA-2W-A8YY-01 | Cervix | cervical & endocervical cancer | Female | <65 | I/II | Chemotherapy | cisplatin | CR |
| KRT80 | SNV | Missense_Mutation | novel | c.628G>C | p.Glu210Gln | p.E210Q | Q6KB66 | protein_coding | tolerated(0.88) | benign(0) | TCGA-C5-A2LY-01 | Cervix | cervical & endocervical cancer | Female | <65 | I/II | Chemotherapy | cisplatin | SD |
| KRT80 | SNV | Missense_Mutation | rs774237997 | c.856N>A | p.Ala286Thr | p.A286T | Q6KB66 | protein_coding | deleterious(0.03) | benign(0.162) | TCGA-ZJ-A8QO-01 | Cervix | cervical & endocervical cancer | Female | >=65 | I/II | Unknown | Unknown | SD |
| KRT80 | SNV | Missense_Mutation | c.950A>G | p.Lys317Arg | p.K317R | Q6KB66 | protein_coding | deleterious(0.04) | probably_damaging(0.953) | TCGA-A6-3809-01 | Colorectum | colon adenocarcinoma | Female | >=65 | I/II | Unknown | Unknown | SD | |
| KRT80 | SNV | Missense_Mutation | c.899N>T | p.Ala300Val | p.A300V | Q6KB66 | protein_coding | deleterious(0) | possibly_damaging(0.491) | TCGA-F4-6703-01 | Colorectum | colon adenocarcinoma | Male | <65 | I/II | Unknown | Unknown | SD | |
| KRT80 | SNV | Missense_Mutation | rs767920544 | c.532N>T | p.Arg178Cys | p.R178C | Q6KB66 | protein_coding | tolerated(0.1) | possibly_damaging(0.511) | TCGA-AG-A01N-01 | Colorectum | rectum adenocarcinoma | Female | >=65 | III/IV | Chemotherapy | capecitabine | SD |
| Page: 1 2 3 4 |
Top |
Related drugs of malignant transformation related genes |
| Identification of chemicals and drugs interact with genes involved in malignant transfromation |
| (DGIdb 4.0) |
| Entrez ID | Symbol | Category | Interaction Types | Drug Claim Name | Drug Name | PMIDs |
| Page: 1 |

Copyright 2023-Present -The University of Texas Health Science Center at Houston |