
|
|||||
|
 | |
| |
| |
| |
| |
| |
|
Gene: KRT8 |
Gene summary for KRT8 |
| Gene information | Species | Human | Gene symbol | KRT8 | Gene ID | 3856 |
| Gene name | keratin 8 | |
| Gene Alias | CARD2 | |
| Cytomap | 12q13.13 | |
| Gene Type | protein-coding | GO ID | GO:0000003 | UniProtAcc | Q7L4M3 |
Top |
Malignant transformation analysis |
| Identification of the aberrant gene expression in precancerous and cancerous lesions by comparing the gene expression of stem-like cells in diseased tissues with normal stem cells |
| Entrez ID | Symbol | Replicates | Species | Organ | Tissue | Adj P-value | Log2FC | Malignancy |
| 3856 | KRT8 | GSM4909280 | Human | Breast | Precancer | 3.07e-04 | 3.14e-01 | 0.0305 |
| 3856 | KRT8 | GSM4909285 | Human | Breast | IDC | 3.65e-59 | 7.53e-01 | 0.21 |
| 3856 | KRT8 | GSM4909291 | Human | Breast | IDC | 2.05e-28 | 6.34e-01 | 0.1753 |
| 3856 | KRT8 | GSM4909293 | Human | Breast | IDC | 3.88e-11 | 3.44e-01 | 0.1581 |
| 3856 | KRT8 | GSM4909294 | Human | Breast | IDC | 2.92e-37 | 4.24e-01 | 0.2022 |
| 3856 | KRT8 | GSM4909296 | Human | Breast | IDC | 8.40e-07 | 1.07e-01 | 0.1524 |
| 3856 | KRT8 | GSM4909297 | Human | Breast | IDC | 7.06e-75 | 7.08e-01 | 0.1517 |
| 3856 | KRT8 | GSM4909300 | Human | Breast | IDC | 3.47e-10 | 4.80e-01 | 0.0334 |
| 3856 | KRT8 | GSM4909301 | Human | Breast | IDC | 1.23e-09 | 3.13e-01 | 0.1577 |
| 3856 | KRT8 | GSM4909302 | Human | Breast | IDC | 2.72e-10 | 3.21e-01 | 0.1545 |
| 3856 | KRT8 | GSM4909303 | Human | Breast | IDC | 3.68e-02 | 3.43e-01 | 0.0438 |
| 3856 | KRT8 | GSM4909304 | Human | Breast | IDC | 2.57e-26 | 5.01e-01 | 0.1636 |
| 3856 | KRT8 | GSM4909305 | Human | Breast | IDC | 7.13e-13 | 4.41e-01 | 0.0436 |
| 3856 | KRT8 | GSM4909306 | Human | Breast | IDC | 6.93e-29 | 5.15e-01 | 0.1564 |
| 3856 | KRT8 | GSM4909308 | Human | Breast | IDC | 3.98e-06 | 3.00e-01 | 0.158 |
| 3856 | KRT8 | GSM4909309 | Human | Breast | IDC | 2.12e-09 | 2.98e-01 | 0.0483 |
| 3856 | KRT8 | GSM4909311 | Human | Breast | IDC | 6.80e-40 | -1.29e-01 | 0.1534 |
| 3856 | KRT8 | GSM4909312 | Human | Breast | IDC | 4.93e-11 | 1.30e-01 | 0.1552 |
| 3856 | KRT8 | GSM4909313 | Human | Breast | IDC | 4.10e-07 | 2.21e-01 | 0.0391 |
| 3856 | KRT8 | GSM4909315 | Human | Breast | IDC | 1.26e-13 | 2.94e-01 | 0.21 |
| Page: 1 2 3 4 5 6 7 8 9 10 11 12 13 14 15 16 17 |
| Tissue | Expression Dynamics | Abbreviation |
| Breast | 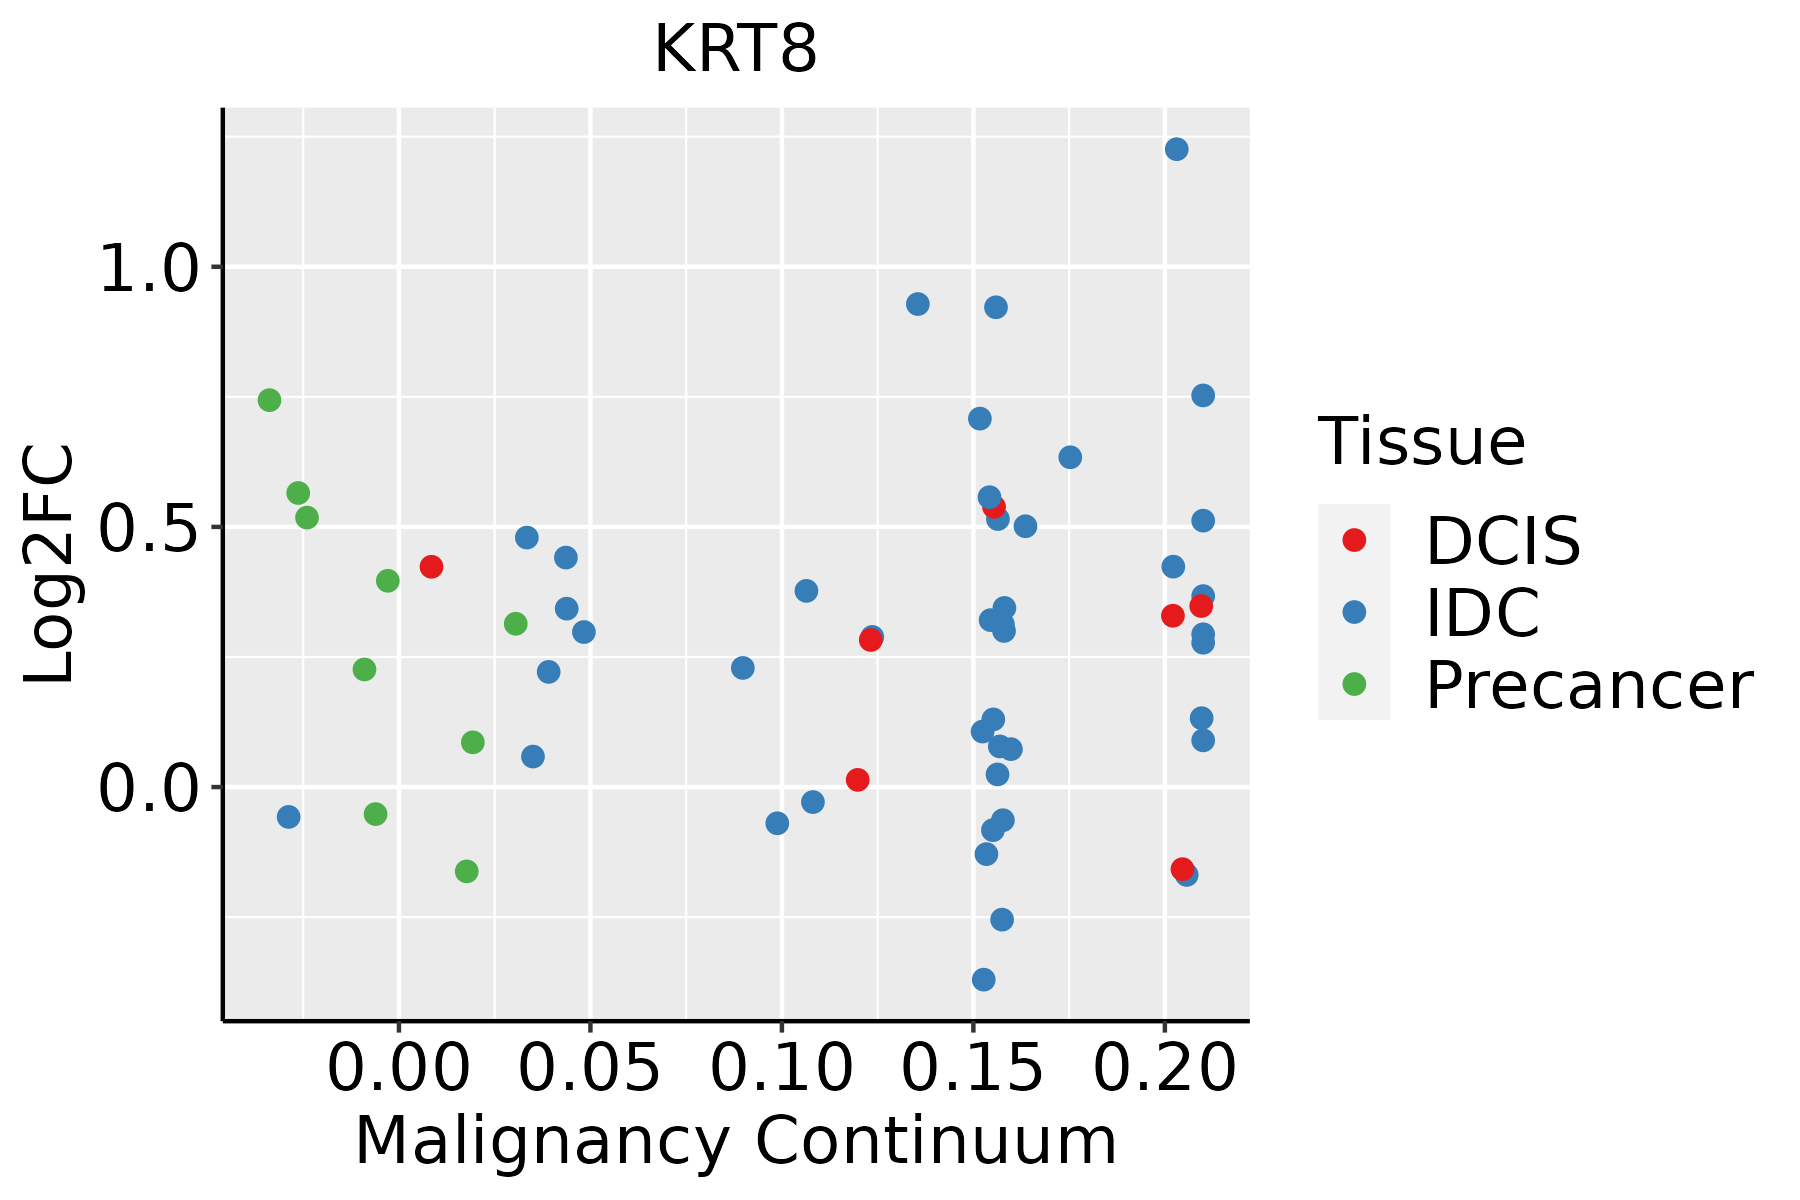 | IDC: Invasive ductal carcinoma |
| DCIS: Ductal carcinoma in situ | ||
| Precancer(BRCA1-mut): Precancerous lesion from BRCA1 mutation carriers | ||
| Cervix |  | CC: Cervix cancer |
| HSIL_HPV: HPV-infected high-grade squamous intraepithelial lesions | ||
| N_HPV: HPV-infected normal cervix | ||
| Colorectum (GSE201348) |  | FAP: Familial adenomatous polyposis |
| CRC: Colorectal cancer | ||
| Colorectum (HTA11) | 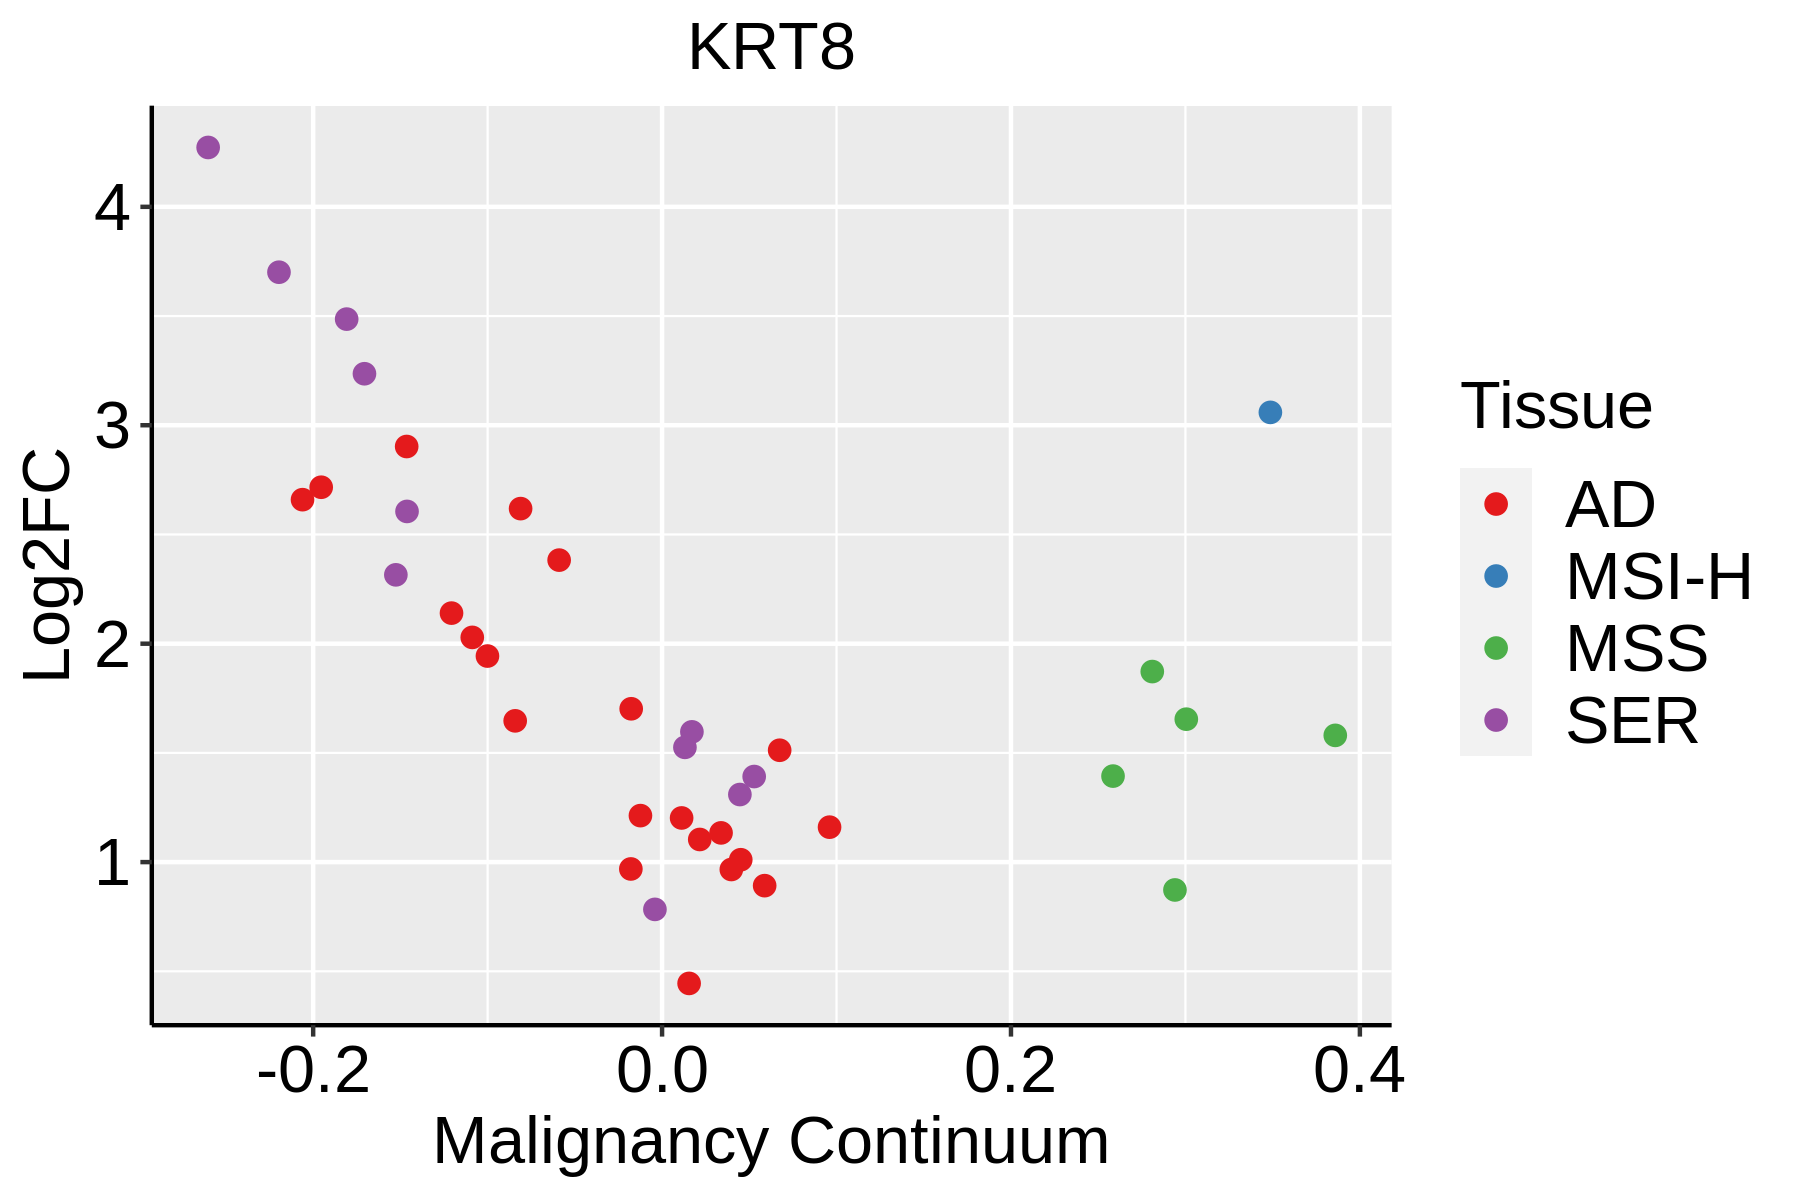 | AD: Adenomas |
| SER: Sessile serrated lesions | ||
| MSI-H: Microsatellite-high colorectal cancer | ||
| MSS: Microsatellite stable colorectal cancer | ||
| Endometrium | 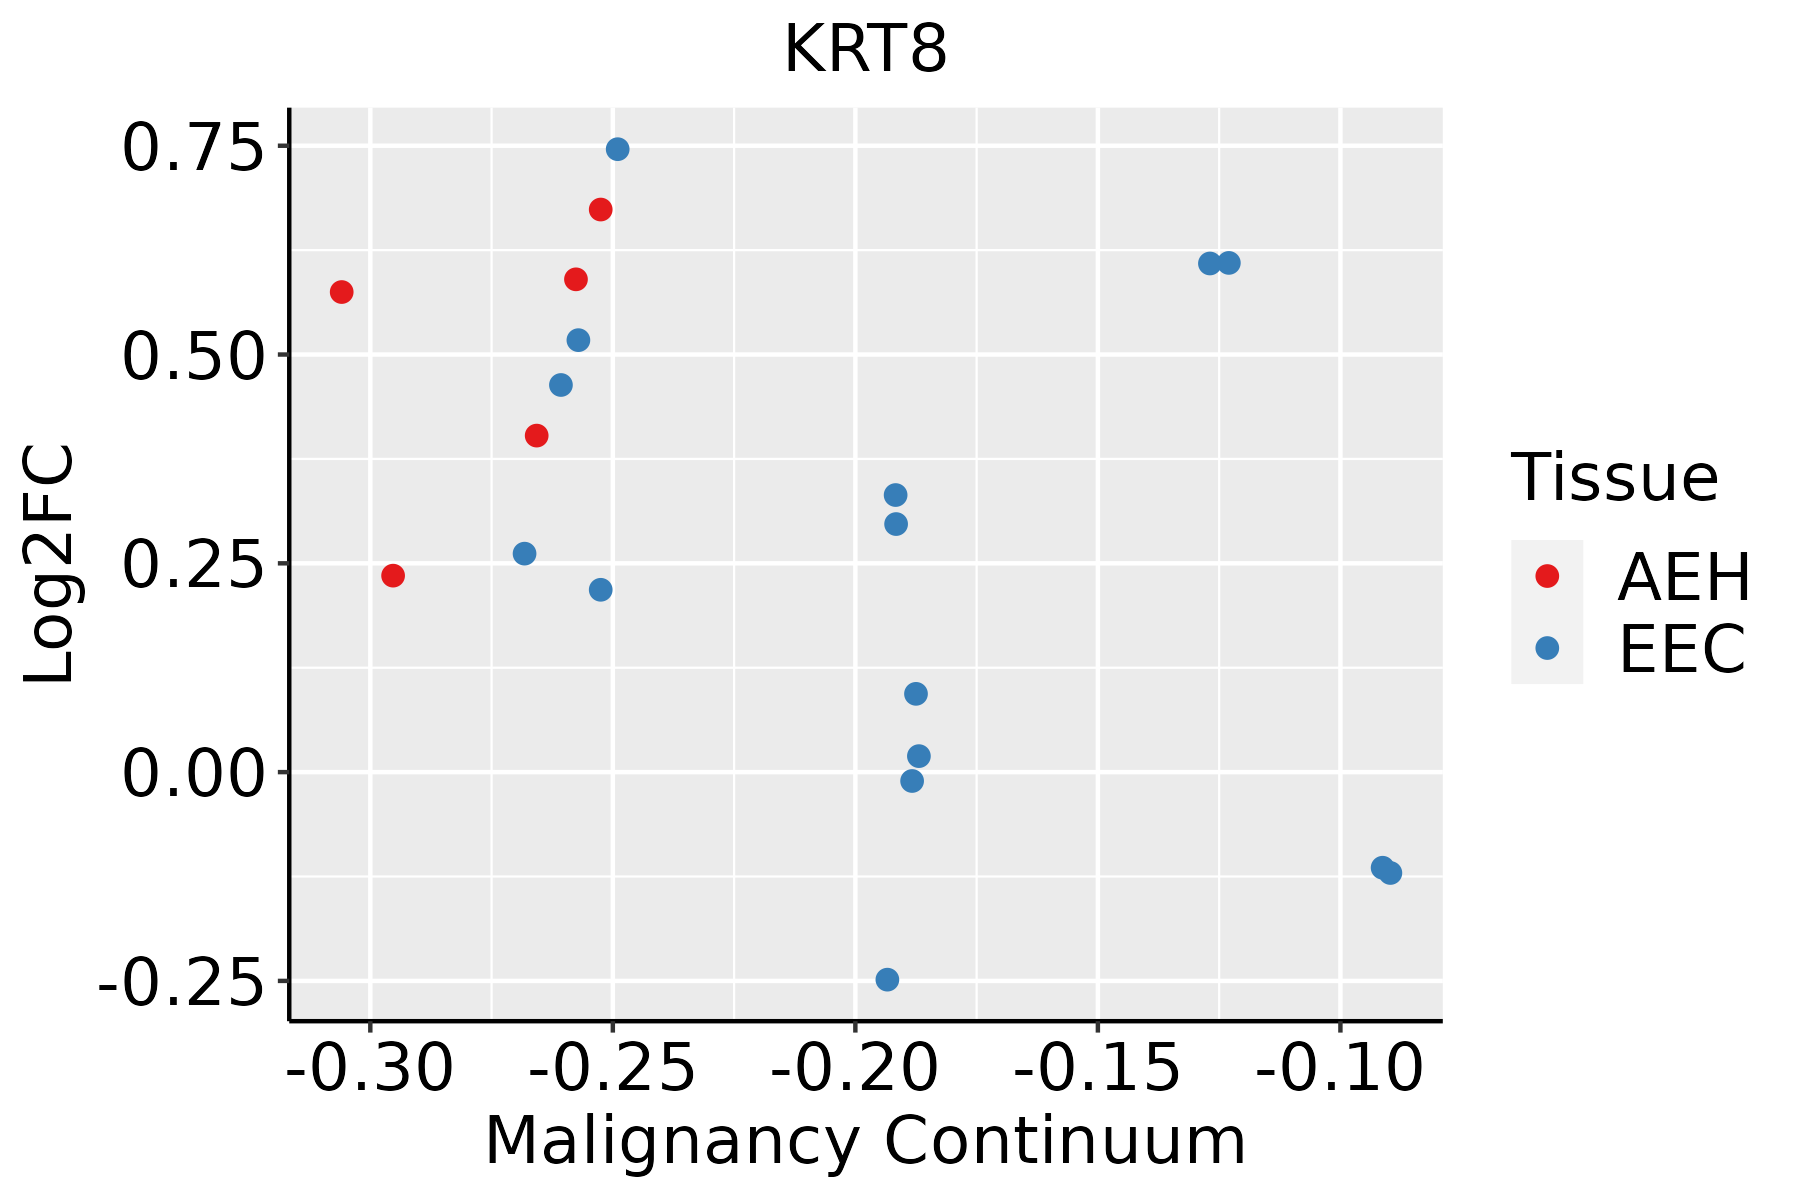 | AEH: Atypical endometrial hyperplasia |
| EEC: Endometrioid Cancer | ||
| Esophagus | 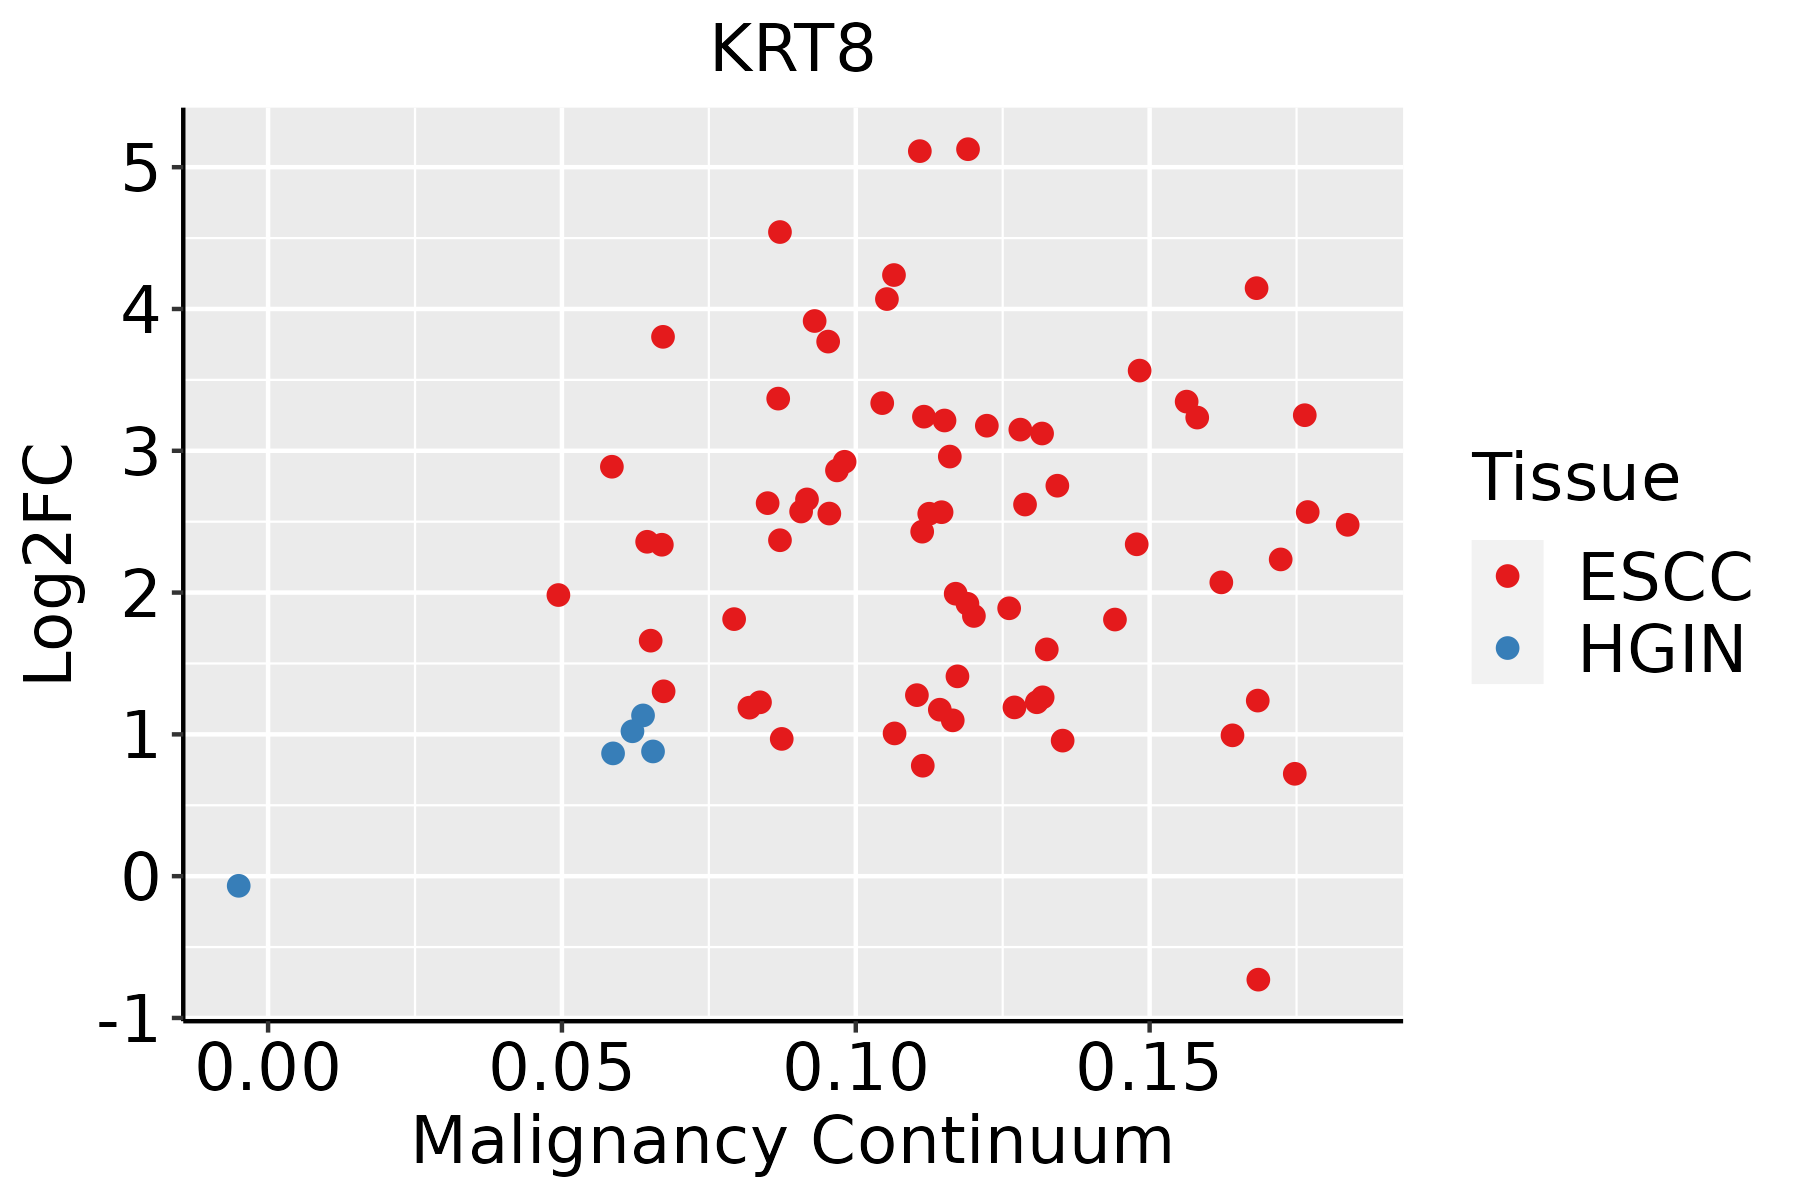 | ESCC: Esophageal squamous cell carcinoma |
| HGIN: High-grade intraepithelial neoplasias | ||
| LGIN: Low-grade intraepithelial neoplasias | ||
| Liver | 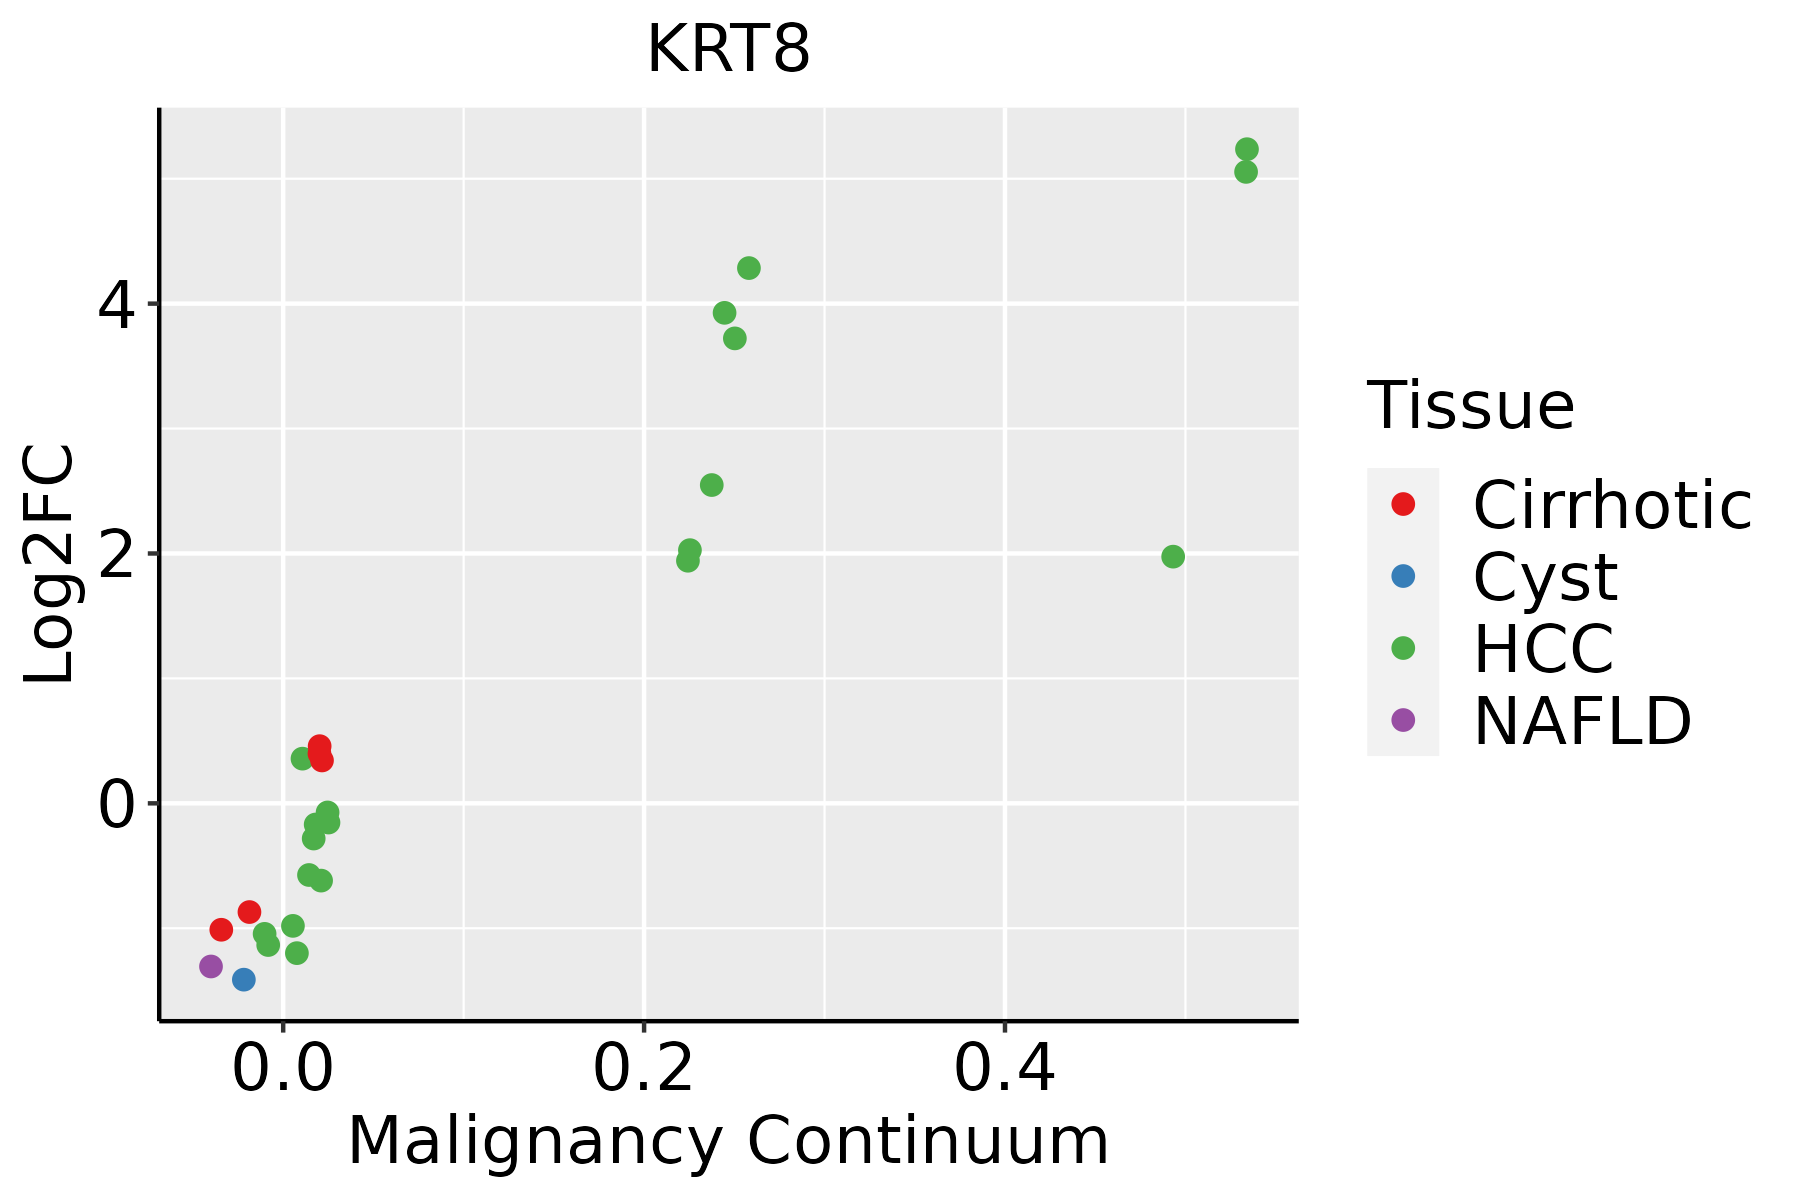 | HCC: Hepatocellular carcinoma |
| NAFLD: Non-alcoholic fatty liver disease | ||
| Lung | 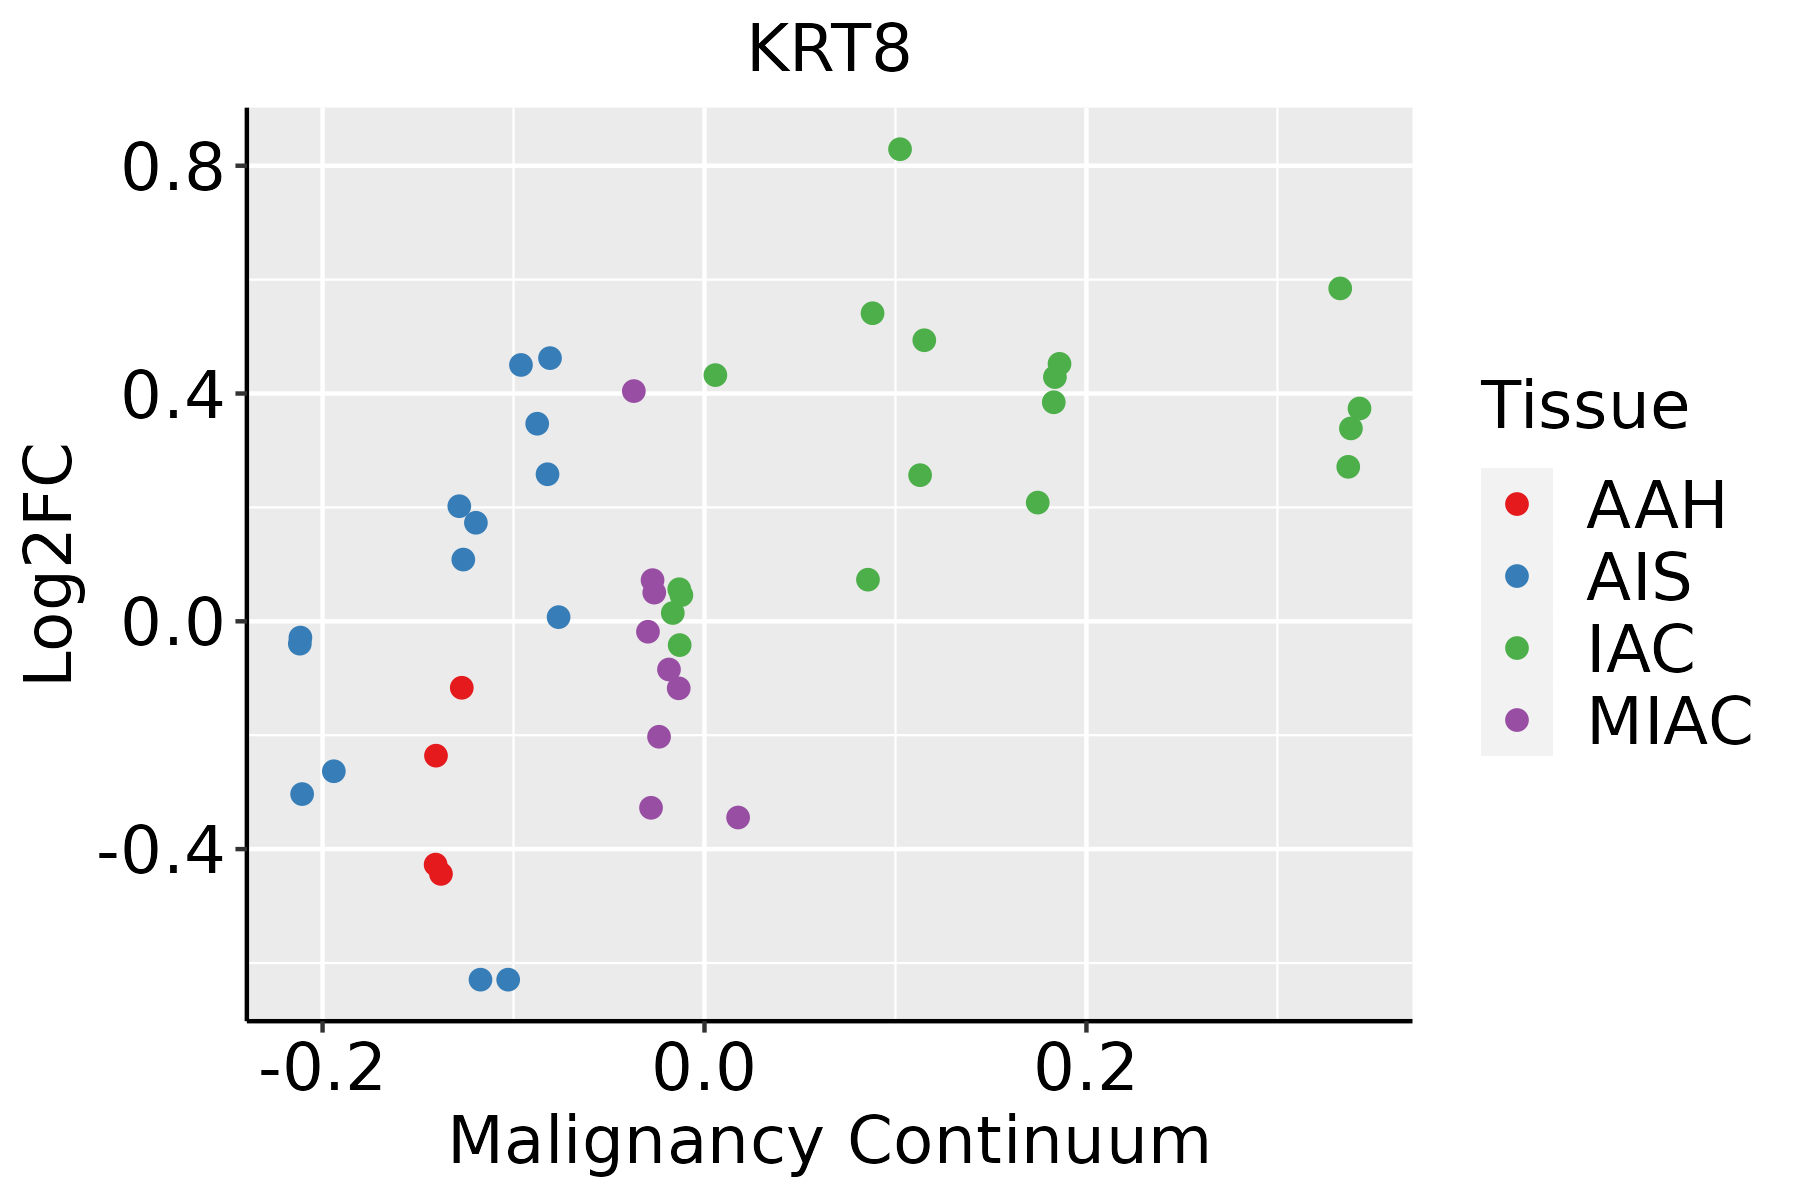 | AAH: Atypical adenomatous hyperplasia |
| AIS: Adenocarcinoma in situ | ||
| IAC: Invasive lung adenocarcinoma | ||
| MIA: Minimally invasive adenocarcinoma | ||
| Oral Cavity | 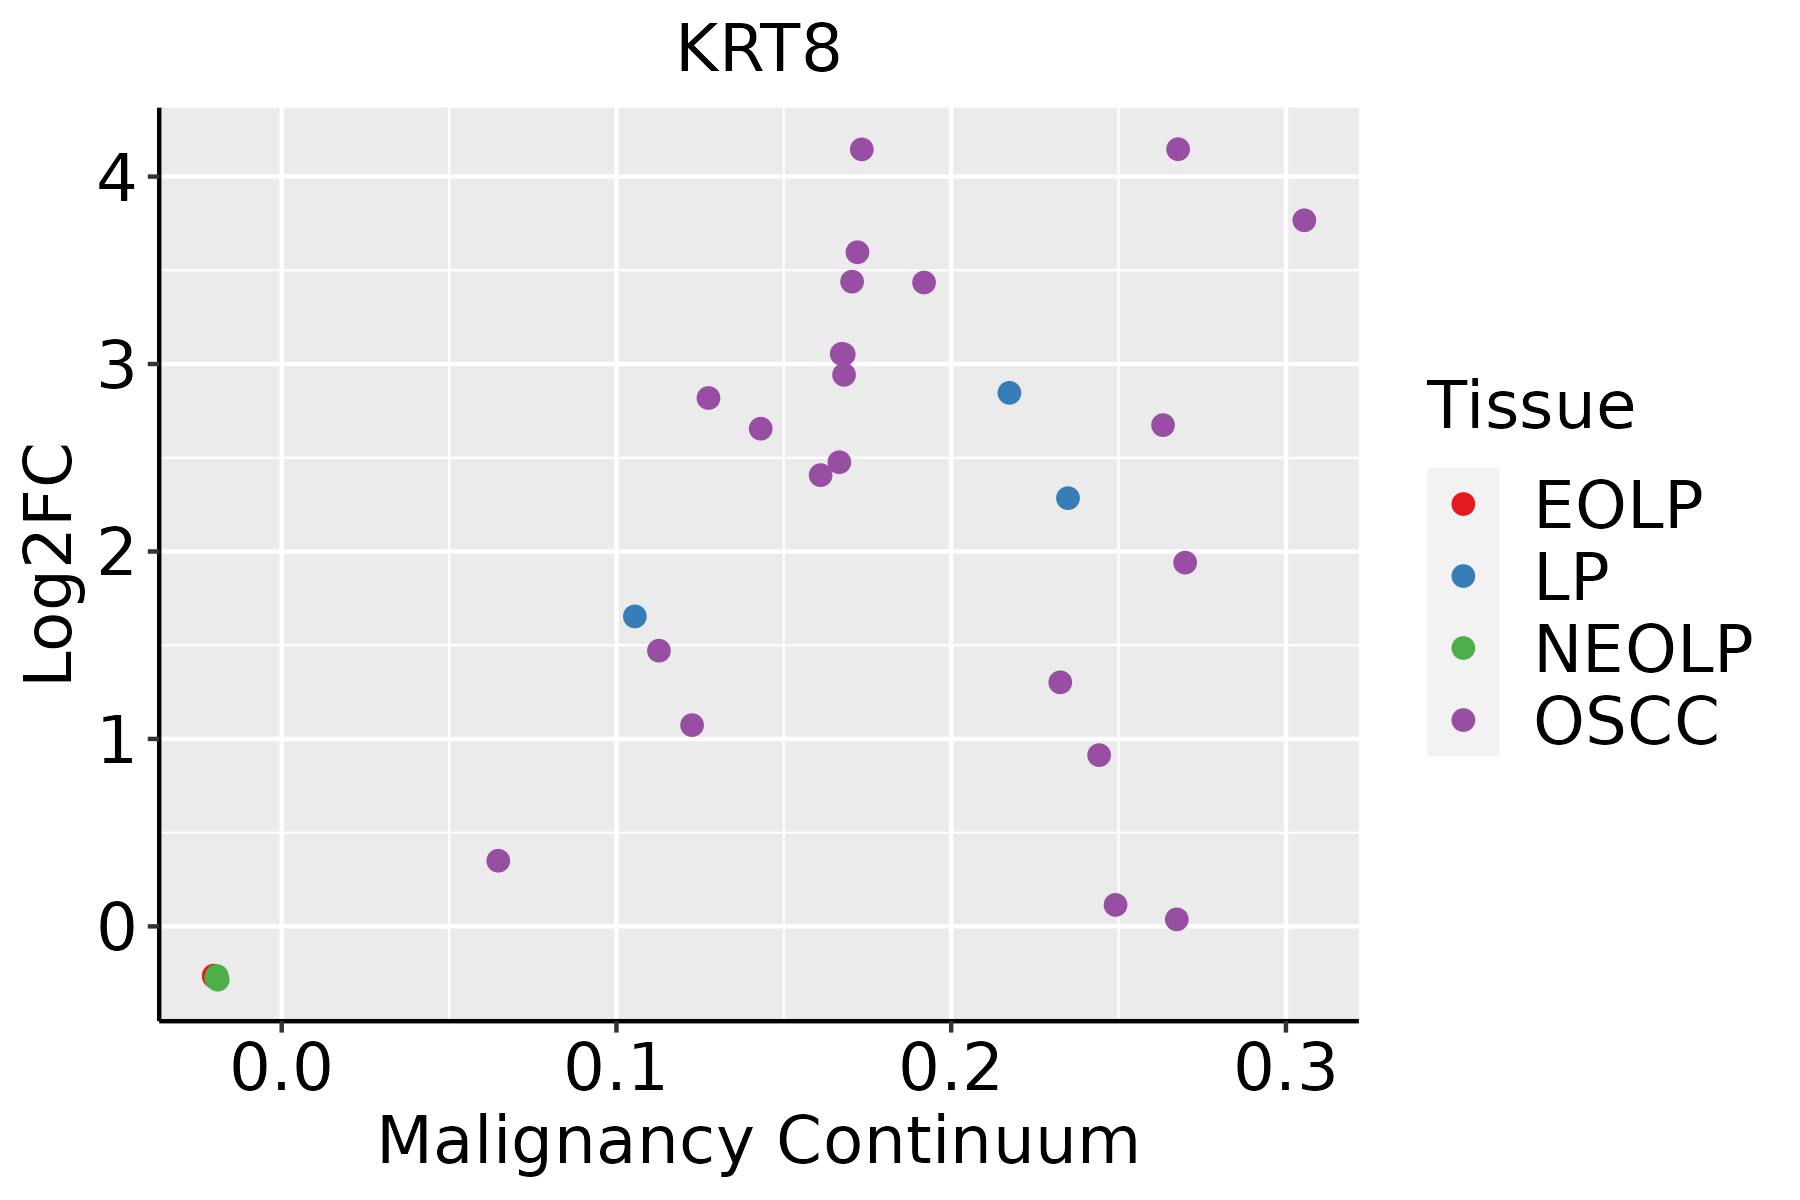 | EOLP: Erosive Oral lichen planus |
| LP: leukoplakia | ||
| NEOLP: Non-erosive oral lichen planus | ||
| OSCC: Oral squamous cell carcinoma | ||
| Prostate | 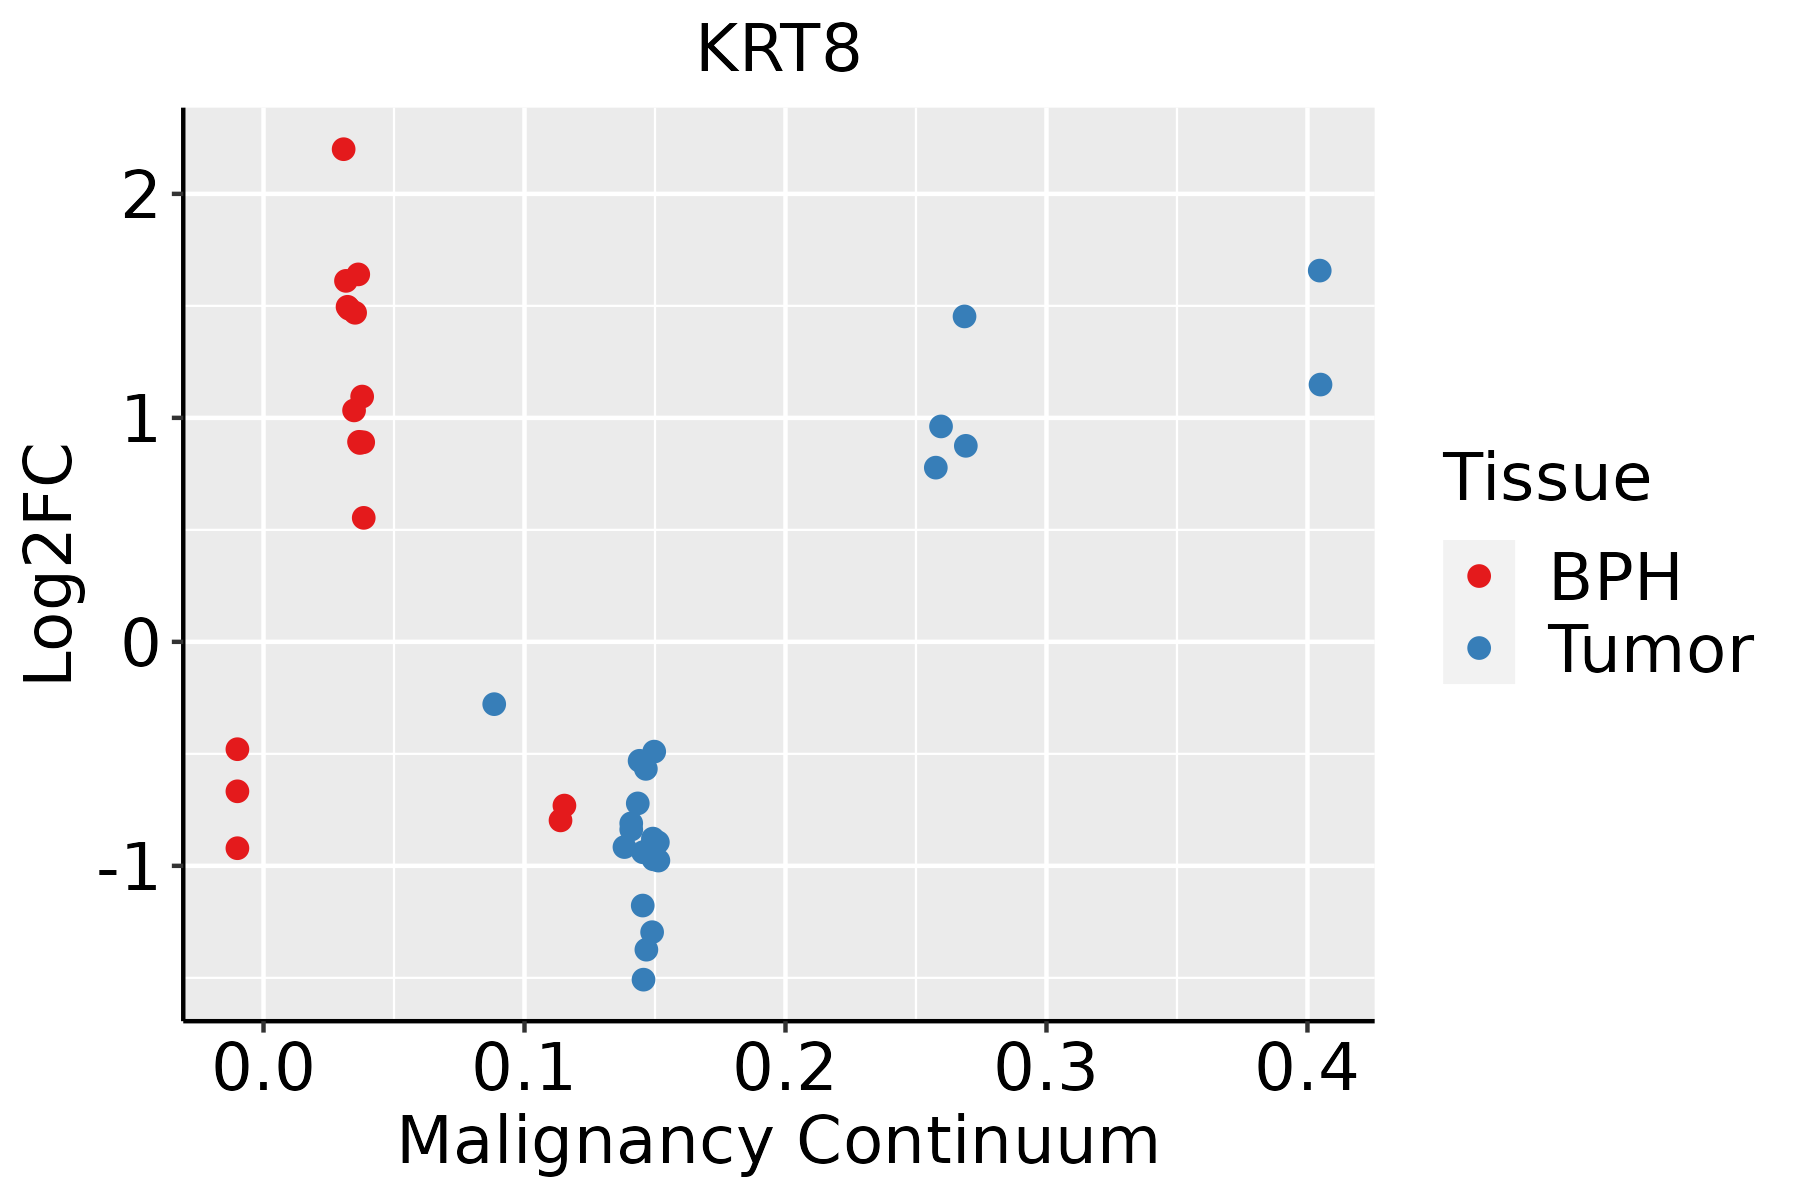 | BPH: Benign Prostatic Hyperplasia |
| Skin | 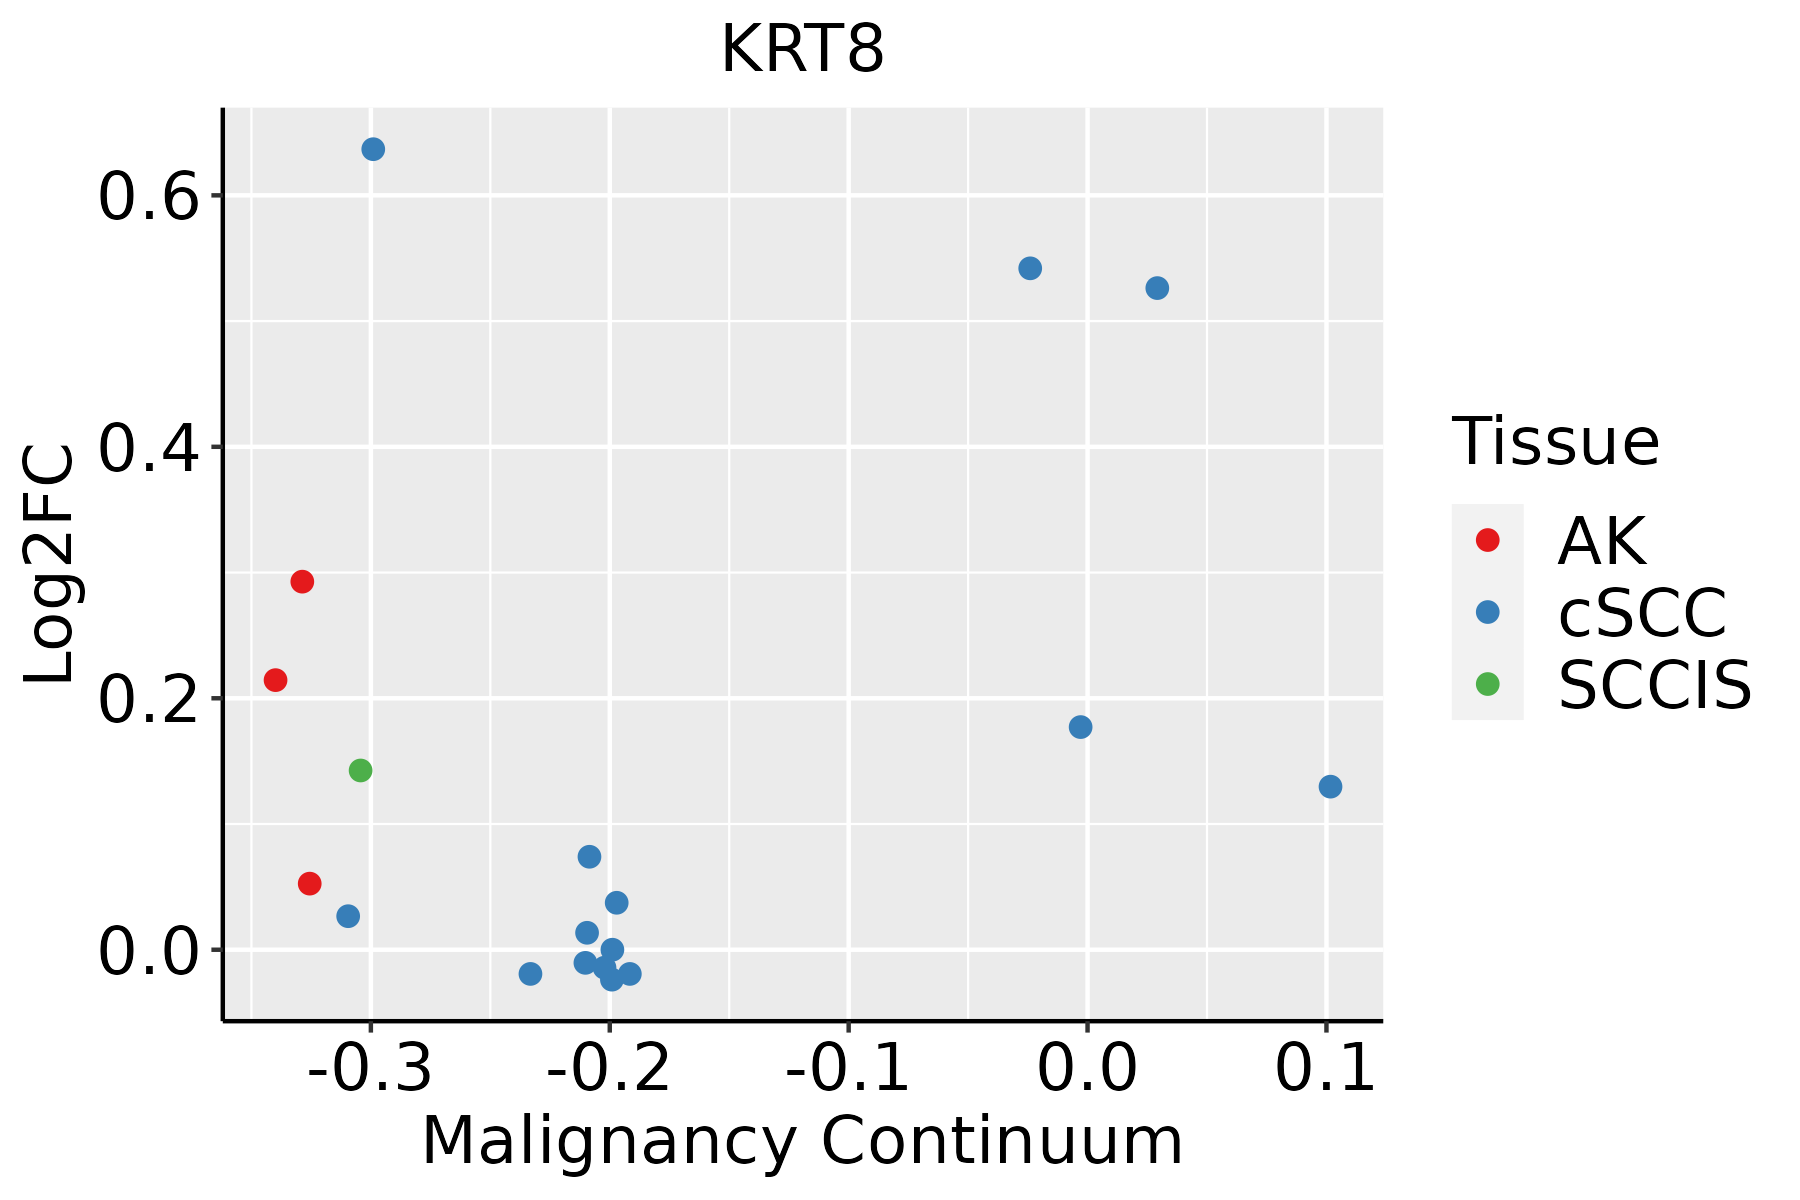 | AK: Actinic keratosis |
| cSCC: Cutaneous squamous cell carcinoma | ||
| SCCIS:squamous cell carcinoma in situ | ||
| Thyroid | 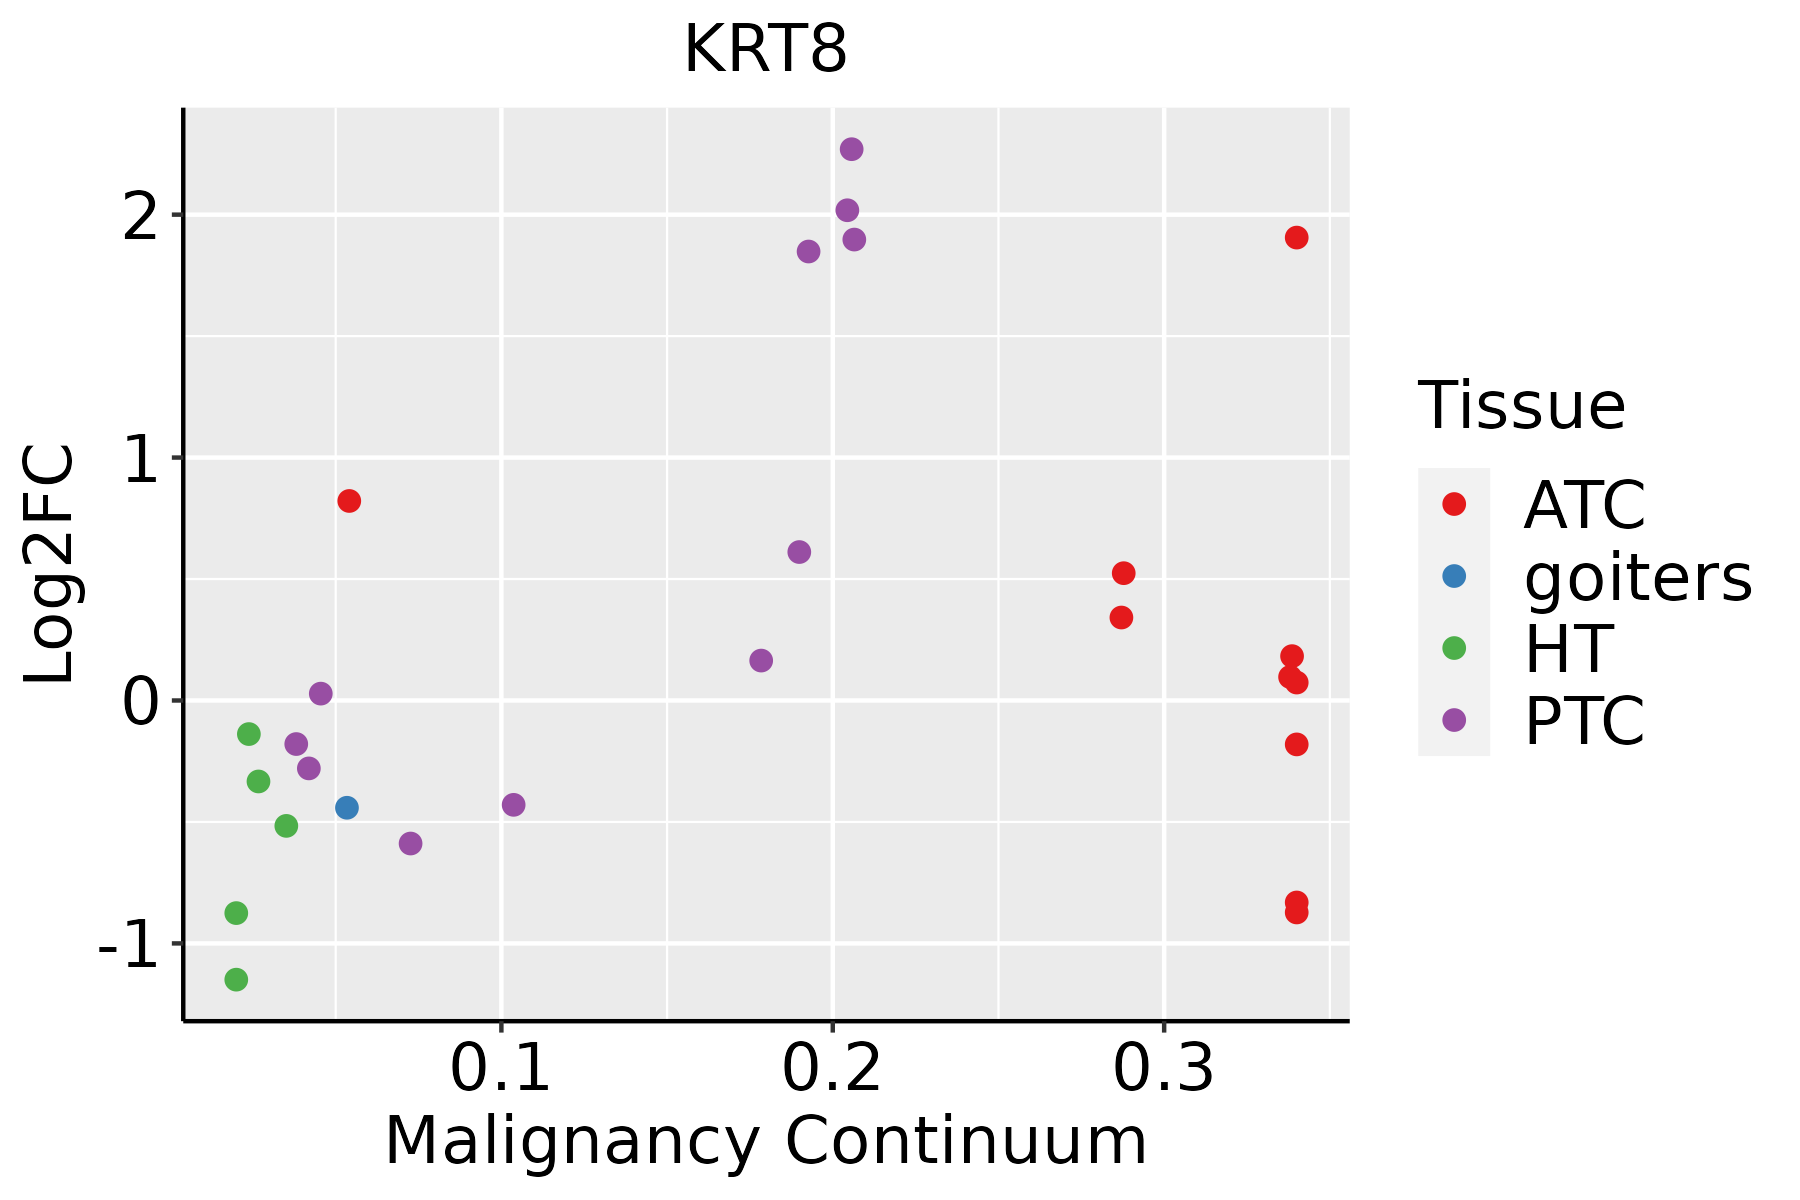 | ATC: Anaplastic thyroid cancer |
| HT: Hashimoto's thyroiditis | ||
| PTC: Papillary thyroid cancer |
| ∗log2FC in expression of this searched gene in stem-like cells from each diseased tissue sample relative to stem-like cells in normal samples in each tissue plotted against the malignancy continuum. Samples are colored based on if they are from different disease stage. |
Top |
Malignant transformation related pathway analysis |
| Find out the enriched GO biological processes and KEGG pathways involved in transition from healthy to precancer to cancer |
| Tissue | Disease Stage | Enriched GO biological Processes |
| Colorectum | AD |  |
| Colorectum | SER |  |
| Colorectum | MSS |  |
| Colorectum | MSI-H |  |
| Colorectum | FAP |  |
| ∗Top 15 enriched GO BP terms are showed in the bar plot of each disease state in each tissue. Each row represents a significant GO biological process which is colored according to the -log10(p.adjust). |
| Page: 1 2 3 4 5 6 7 8 9 |
| GO ID | Tissue | Disease Stage | Description | Gene Ratio | Bg Ratio | pvalue | p.adjust | Count |
| GO:00971919 | Breast | Precancer | extrinsic apoptotic signaling pathway | 30/1080 | 219/18723 | 9.42e-06 | 2.50e-04 | 30 |
| GO:00713568 | Breast | Precancer | cellular response to tumor necrosis factor | 28/1080 | 229/18723 | 1.42e-04 | 2.45e-03 | 28 |
| GO:00018927 | Breast | Precancer | embryonic placenta development | 14/1080 | 82/18723 | 2.30e-04 | 3.48e-03 | 14 |
| GO:00486087 | Breast | Precancer | reproductive structure development | 43/1080 | 424/18723 | 2.36e-04 | 3.56e-03 | 43 |
| GO:00614587 | Breast | Precancer | reproductive system development | 43/1080 | 427/18723 | 2.75e-04 | 4.00e-03 | 43 |
| GO:00346128 | Breast | Precancer | response to tumor necrosis factor | 29/1080 | 253/18723 | 3.32e-04 | 4.70e-03 | 29 |
| GO:19040193 | Breast | Precancer | epithelial cell apoptotic process | 17/1080 | 121/18723 | 5.76e-04 | 7.28e-03 | 17 |
| GO:00018907 | Breast | Precancer | placenta development | 19/1080 | 144/18723 | 6.26e-04 | 7.78e-03 | 19 |
| GO:00017017 | Breast | Precancer | in utero embryonic development | 35/1080 | 367/18723 | 2.47e-03 | 2.27e-02 | 35 |
| GO:0060706 | Breast | Precancer | cell differentiation involved in embryonic placenta development | 6/1080 | 25/18723 | 2.49e-03 | 2.28e-02 | 6 |
| GO:00011015 | Breast | Precancer | response to acid chemical | 16/1080 | 135/18723 | 4.85e-03 | 3.67e-02 | 16 |
| GO:009719114 | Breast | IDC | extrinsic apoptotic signaling pathway | 42/1434 | 219/18723 | 2.56e-08 | 1.73e-06 | 42 |
| GO:004860812 | Breast | IDC | reproductive structure development | 60/1434 | 424/18723 | 2.71e-06 | 1.03e-04 | 60 |
| GO:006145813 | Breast | IDC | reproductive system development | 60/1434 | 427/18723 | 3.41e-06 | 1.24e-04 | 60 |
| GO:007135613 | Breast | IDC | cellular response to tumor necrosis factor | 35/1434 | 229/18723 | 6.64e-05 | 1.35e-03 | 35 |
| GO:000189013 | Breast | IDC | placenta development | 25/1434 | 144/18723 | 9.19e-05 | 1.78e-03 | 25 |
| GO:003461213 | Breast | IDC | response to tumor necrosis factor | 36/1434 | 253/18723 | 2.29e-04 | 3.64e-03 | 36 |
| GO:000189213 | Breast | IDC | embryonic placenta development | 16/1434 | 82/18723 | 4.28e-04 | 5.84e-03 | 16 |
| GO:000110112 | Breast | IDC | response to acid chemical | 20/1434 | 135/18723 | 3.28e-03 | 2.75e-02 | 20 |
| GO:00426923 | Breast | IDC | muscle cell differentiation | 44/1434 | 384/18723 | 4.77e-03 | 3.66e-02 | 44 |
| Page: 1 2 3 4 5 6 7 8 9 10 11 12 13 14 15 16 17 18 19 |
| Pathway ID | Tissue | Disease Stage | Description | Gene Ratio | Bg Ratio | pvalue | p.adjust | qvalue | Count |
| Page: 1 |
Top |
Cell-cell communication analysis |
| Identification of potential cell-cell interactions between two cell types and their ligand-receptor pairs for different disease states |
| Ligand | Receptor | LRpair | Pathway | Tissue | Disease Stage |
| Page: 1 |
Top |
Single-cell gene regulatory network inference analysis |
| Find out the significant the regulons (TFs) and the target genes of each regulon across cell types for different disease states |
| TF | Cell Type | Tissue | Disease Stage | Target Gene | RSS | Regulon Activity |
| ∗The dot plots of a searched regulon are shown for all cell subpopulations in each disease state of each tissue based on the regulon specific score inferred using pySCENIC and by calculating the average expression. |
| Page: 1 |
Top |
Somatic mutation of malignant transformation related genes |
| Annotation of somatic variants for genes involved in malignant transformation |
| Hugo Symbol | Variant Class | Variant Classification | dbSNP RS | HGVSc | HGVSp | HGVSp Short | SWISSPROT | BIOTYPE | SIFT | PolyPhen | Tumor Sample Barcode | Tissue | Histology | Sex | Age | Stage | Therapy Types | Drugs | Outcome |
| KRT8 | SNV | Missense_Mutation | rs764622352 | c.1135G>A | p.Ala379Thr | p.A379T | P05787 | protein_coding | tolerated(0.15) | benign(0.012) | TCGA-AN-A0AK-01 | Breast | breast invasive carcinoma | Female | >=65 | I/II | Unknown | Unknown | SD |
| KRT8 | SNV | Missense_Mutation | rs770608691 | c.1081N>T | p.Ala361Ser | p.A361S | P05787 | protein_coding | tolerated(0.06) | possibly_damaging(0.897) | TCGA-S3-AA17-01 | Breast | breast invasive carcinoma | Female | <65 | I/II | Hormone Therapy | anastrozole | SD |
| KRT8 | SNV | Missense_Mutation | novel | c.1249N>A | p.Ala417Thr | p.A417T | P05787 | protein_coding | tolerated(0.09) | benign(0.089) | TCGA-2W-A8YY-01 | Cervix | cervical & endocervical cancer | Female | <65 | I/II | Chemotherapy | cisplatin | CR |
| KRT8 | SNV | Missense_Mutation | rs764622352 | c.1135N>A | p.Ala379Thr | p.A379T | P05787 | protein_coding | tolerated(0.15) | benign(0.012) | TCGA-AA-3864-01 | Colorectum | colon adenocarcinoma | Male | >=65 | I/II | Unknown | Unknown | SD |
| KRT8 | SNV | Missense_Mutation | novel | c.731N>C | p.Gly244Ala | p.G244A | P05787 | protein_coding | tolerated(0.34) | possibly_damaging(0.652) | TCGA-AA-3980-01 | Colorectum | colon adenocarcinoma | Female | >=65 | I/II | Unknown | Unknown | SD |
| KRT8 | SNV | Missense_Mutation | novel | c.418N>A | p.Leu140Met | p.L140M | P05787 | protein_coding | deleterious(0) | probably_damaging(0.994) | TCGA-AD-A5EJ-01 | Colorectum | colon adenocarcinoma | Female | >=65 | I/II | Unknown | Unknown | SD |
| KRT8 | SNV | Missense_Mutation | c.314T>G | p.Val105Gly | p.V105G | P05787 | protein_coding | deleterious(0.02) | benign(0) | TCGA-CM-4744-01 | Colorectum | colon adenocarcinoma | Male | >=65 | I/II | Unknown | Unknown | SD | |
| KRT8 | SNV | Missense_Mutation | c.1087N>G | p.Ile363Val | p.I363V | P05787 | protein_coding | tolerated(0.09) | benign(0.098) | TCGA-EI-6882-01 | Colorectum | rectum adenocarcinoma | Male | <65 | I/II | Unknown | Unknown | SD | |
| KRT8 | SNV | Missense_Mutation | novel | c.705N>T | p.Lys235Asn | p.K235N | P05787 | protein_coding | deleterious(0) | benign(0.169) | TCGA-A5-A0G1-01 | Endometrium | uterine corpus endometrioid carcinoma | Female | >=65 | I/II | Unknown | Unknown | SD |
| KRT8 | SNV | Missense_Mutation | rs752853262 | c.908G>A | p.Arg303Gln | p.R303Q | P05787 | protein_coding | tolerated(0.15) | benign(0.013) | TCGA-A5-A0G2-01 | Endometrium | uterine corpus endometrioid carcinoma | Female | <65 | III/IV | Unknown | Unknown | SD |
| Page: 1 2 3 4 |
Top |
Related drugs of malignant transformation related genes |
| Identification of chemicals and drugs interact with genes involved in malignant transfromation |
| (DGIdb 4.0) |
| Entrez ID | Symbol | Category | Interaction Types | Drug Claim Name | Drug Name | PMIDs |
| Page: 1 |

Copyright 2023-Present -The University of Texas Health Science Center at Houston |