
|
|||||
|
 | |
| |
| |
| |
| |
| |
|
Gene: KRT75 |
Gene summary for KRT75 |
| Gene information | Species | Human | Gene symbol | KRT75 | Gene ID | 9119 |
| Gene name | keratin 75 | |
| Gene Alias | CK-75 | |
| Cytomap | 12q13.13 | |
| Gene Type | protein-coding | GO ID | GO:0002244 | UniProtAcc | O95678 |
Top |
Malignant transformation analysis |
| Identification of the aberrant gene expression in precancerous and cancerous lesions by comparing the gene expression of stem-like cells in diseased tissues with normal stem cells |
| Entrez ID | Symbol | Replicates | Species | Organ | Tissue | Adj P-value | Log2FC | Malignancy |
| 9119 | KRT75 | HTA11_1938_2000001011 | Human | Colorectum | AD | 9.49e-04 | 1.51e-01 | -0.0811 |
| 9119 | KRT75 | HTA11_696_2000001011 | Human | Colorectum | AD | 4.07e-04 | 1.55e-01 | -0.1464 |
| 9119 | KRT75 | HTA11_1391_2000001011 | Human | Colorectum | AD | 3.47e-06 | 1.69e-01 | -0.059 |
| 9119 | KRT75 | HTA11_6818_2000001021 | Human | Colorectum | AD | 7.48e-10 | 3.00e-01 | 0.0588 |
| 9119 | KRT75 | HTA11_99999970781_79442 | Human | Colorectum | MSS | 9.04e-05 | 1.12e-01 | 0.294 |
| 9119 | KRT75 | HTA11_99999971662_82457 | Human | Colorectum | MSS | 1.82e-03 | 1.18e-01 | 0.3859 |
| 9119 | KRT75 | HTA11_99999974143_84620 | Human | Colorectum | MSS | 8.62e-04 | 1.21e-01 | 0.3005 |
| 9119 | KRT75 | P10T-E | Human | Esophagus | ESCC | 5.00e-17 | 5.31e-01 | 0.116 |
| 9119 | KRT75 | P11T-E | Human | Esophagus | ESCC | 3.25e-05 | 3.22e-01 | 0.1426 |
| 9119 | KRT75 | P19T-E | Human | Esophagus | ESCC | 7.48e-03 | 4.05e-01 | 0.1662 |
| 9119 | KRT75 | P21T-E | Human | Esophagus | ESCC | 4.17e-05 | 3.77e-01 | 0.1617 |
| 9119 | KRT75 | P22T-E | Human | Esophagus | ESCC | 4.44e-08 | 2.80e-01 | 0.1236 |
| 9119 | KRT75 | P24T-E | Human | Esophagus | ESCC | 1.66e-02 | 2.04e-01 | 0.1287 |
| 9119 | KRT75 | P31T-E | Human | Esophagus | ESCC | 6.89e-44 | 1.69e+00 | 0.1251 |
| 9119 | KRT75 | P37T-E | Human | Esophagus | ESCC | 6.65e-04 | 1.69e-01 | 0.1371 |
| 9119 | KRT75 | P42T-E | Human | Esophagus | ESCC | 3.05e-02 | 2.42e-01 | 0.1175 |
| 9119 | KRT75 | P52T-E | Human | Esophagus | ESCC | 7.98e-13 | 6.18e-01 | 0.1555 |
| 9119 | KRT75 | P61T-E | Human | Esophagus | ESCC | 2.42e-03 | 2.39e-01 | 0.099 |
| 9119 | KRT75 | P76T-E | Human | Esophagus | ESCC | 8.84e-05 | 2.77e-01 | 0.1207 |
| 9119 | KRT75 | P80T-E | Human | Esophagus | ESCC | 8.76e-16 | 1.28e+00 | 0.155 |
| Page: 1 2 |
| Tissue | Expression Dynamics | Abbreviation |
| Colorectum (GSE201348) |  | FAP: Familial adenomatous polyposis |
| CRC: Colorectal cancer | ||
| Colorectum (HTA11) | 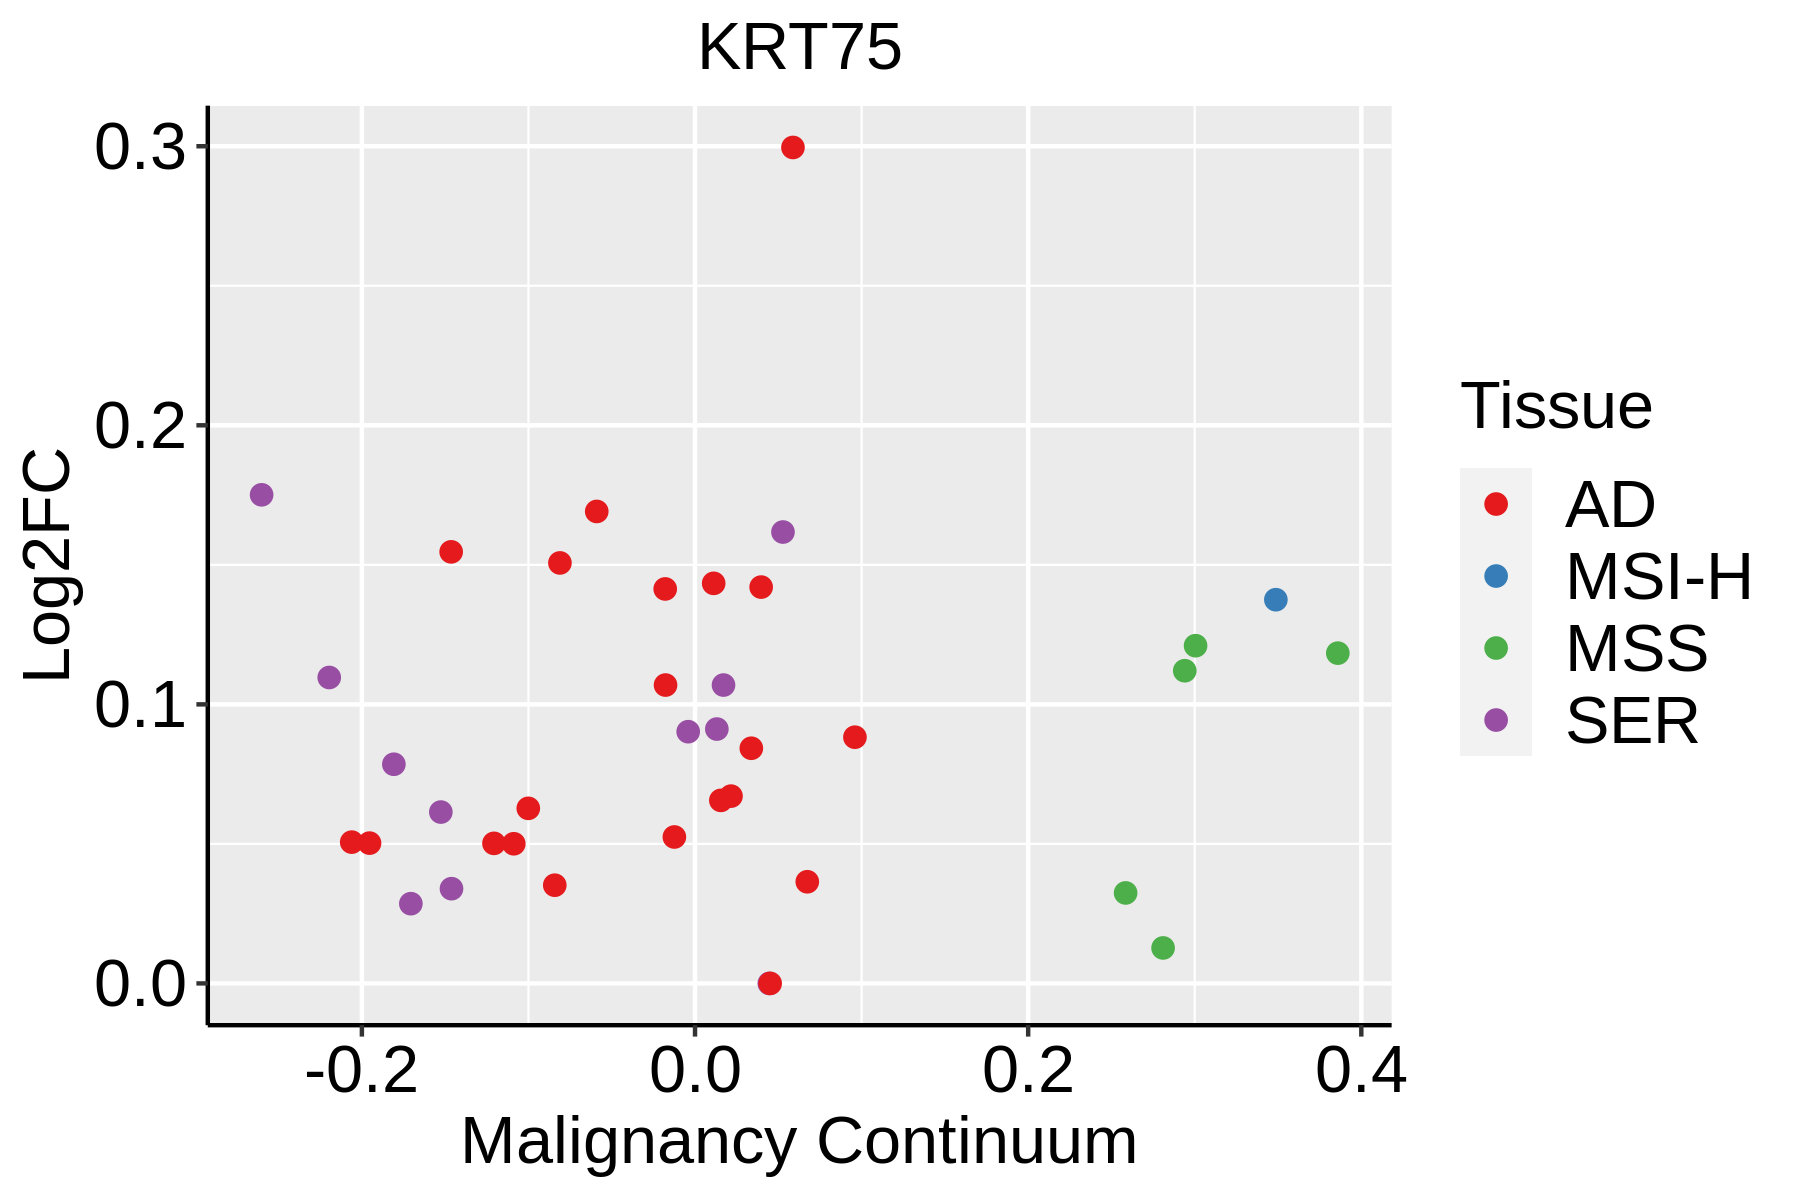 | AD: Adenomas |
| SER: Sessile serrated lesions | ||
| MSI-H: Microsatellite-high colorectal cancer | ||
| MSS: Microsatellite stable colorectal cancer | ||
| Esophagus | 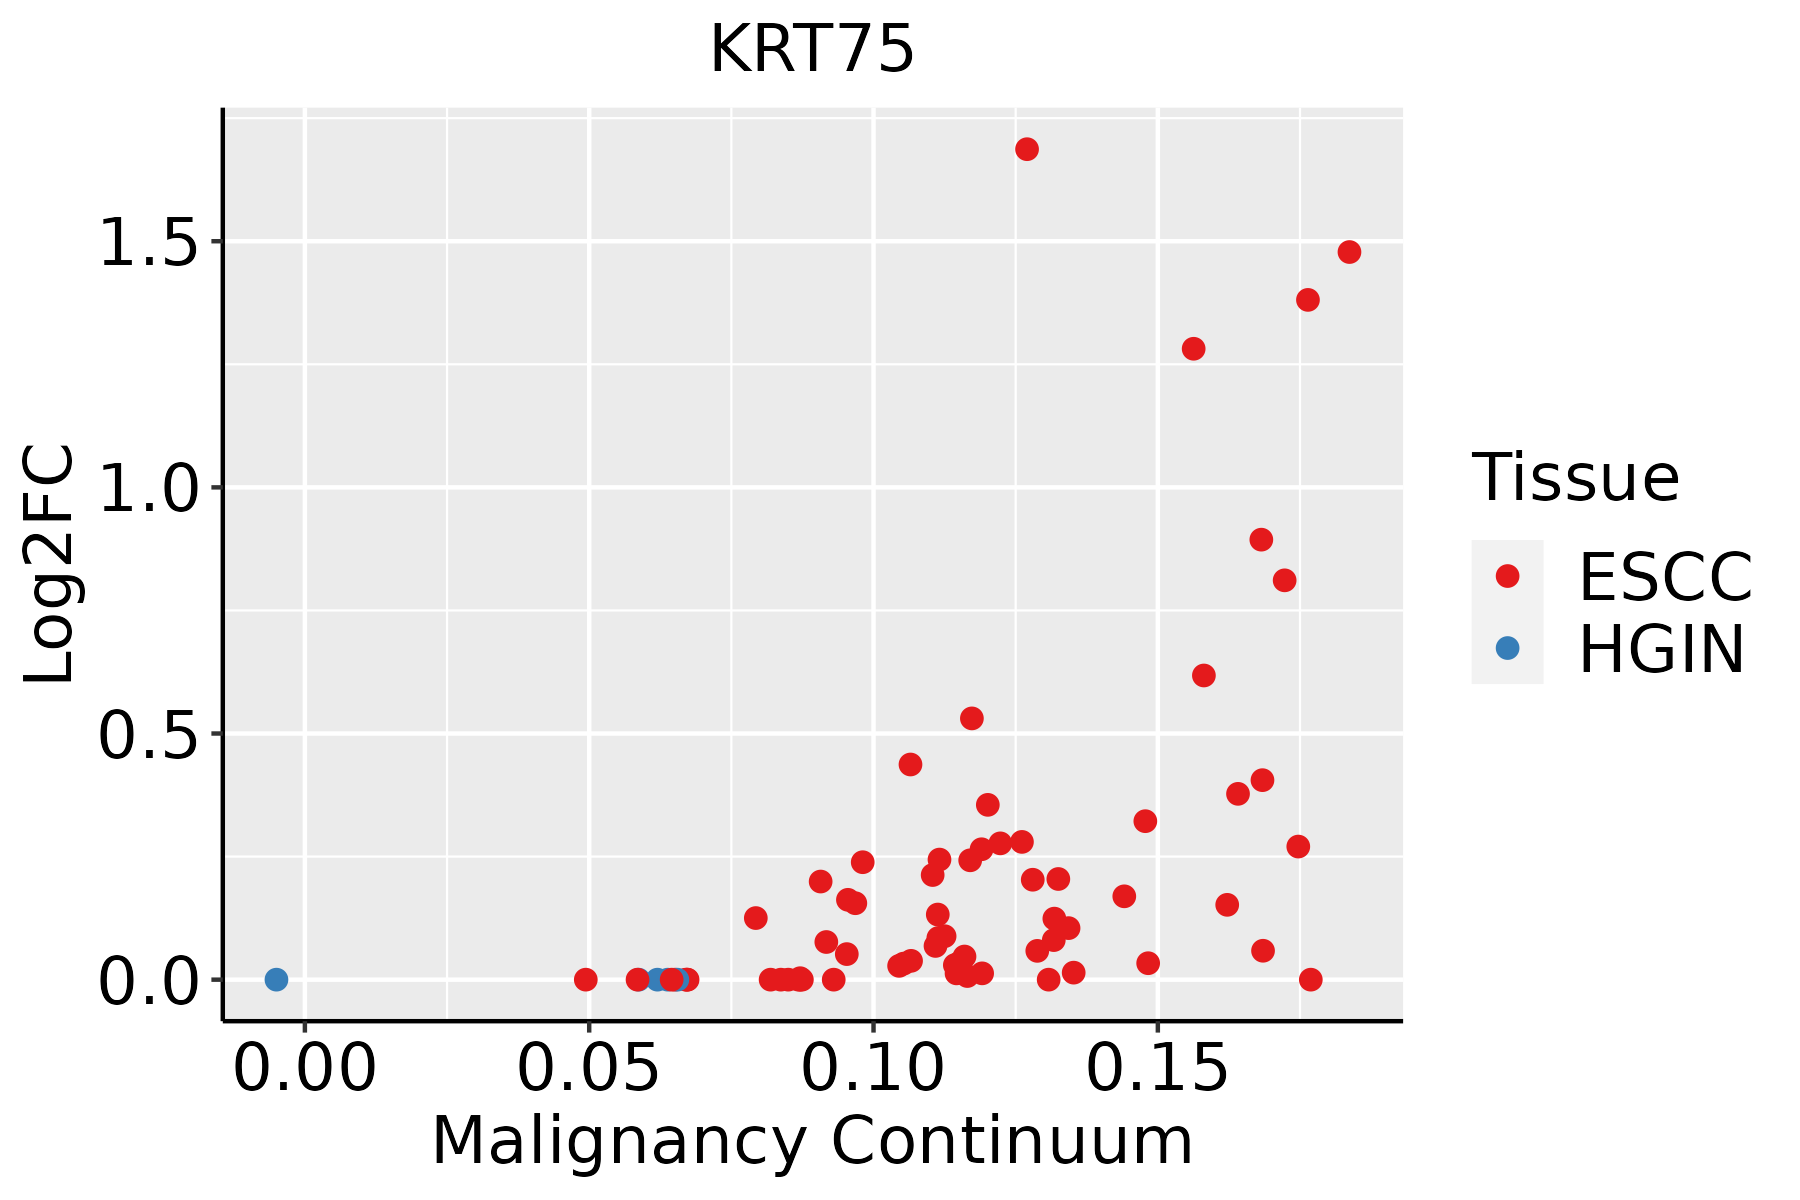 | ESCC: Esophageal squamous cell carcinoma |
| HGIN: High-grade intraepithelial neoplasias | ||
| LGIN: Low-grade intraepithelial neoplasias | ||
| Oral Cavity |  | EOLP: Erosive Oral lichen planus |
| LP: leukoplakia | ||
| NEOLP: Non-erosive oral lichen planus | ||
| OSCC: Oral squamous cell carcinoma | ||
| Skin |  | AK: Actinic keratosis |
| cSCC: Cutaneous squamous cell carcinoma | ||
| SCCIS:squamous cell carcinoma in situ |
| ∗log2FC in expression of this searched gene in stem-like cells from each diseased tissue sample relative to stem-like cells in normal samples in each tissue plotted against the malignancy continuum. Samples are colored based on if they are from different disease stage. |
Top |
Malignant transformation related pathway analysis |
| Find out the enriched GO biological processes and KEGG pathways involved in transition from healthy to precancer to cancer |
| Tissue | Disease Stage | Enriched GO biological Processes |
| Colorectum | AD |  |
| Colorectum | SER |  |
| Colorectum | MSS |  |
| Colorectum | MSI-H |  |
| Colorectum | FAP |  |
| ∗Top 15 enriched GO BP terms are showed in the bar plot of each disease state in each tissue. Each row represents a significant GO biological process which is colored according to the -log10(p.adjust). |
| Page: 1 2 3 4 5 6 7 8 9 |
| GO ID | Tissue | Disease Stage | Description | Gene Ratio | Bg Ratio | pvalue | p.adjust | Count |
| GO:0002244 | Colorectum | MSS | hematopoietic progenitor cell differentiation | 32/3467 | 114/18723 | 8.07e-03 | 4.91e-02 | 32 |
| GO:00022446 | Esophagus | ESCC | hematopoietic progenitor cell differentiation | 66/8552 | 114/18723 | 5.74e-03 | 2.13e-02 | 66 |
| GO:00022445 | Oral cavity | OSCC | hematopoietic progenitor cell differentiation | 57/7305 | 114/18723 | 1.09e-02 | 3.71e-02 | 57 |
| GO:000224413 | Skin | cSCC | hematopoietic progenitor cell differentiation | 42/4864 | 114/18723 | 6.74e-03 | 3.27e-02 | 42 |
| Page: 1 |
| Pathway ID | Tissue | Disease Stage | Description | Gene Ratio | Bg Ratio | pvalue | p.adjust | qvalue | Count |
| Page: 1 |
Top |
Cell-cell communication analysis |
| Identification of potential cell-cell interactions between two cell types and their ligand-receptor pairs for different disease states |
| Ligand | Receptor | LRpair | Pathway | Tissue | Disease Stage |
| Page: 1 |
Top |
Single-cell gene regulatory network inference analysis |
| Find out the significant the regulons (TFs) and the target genes of each regulon across cell types for different disease states |
| TF | Cell Type | Tissue | Disease Stage | Target Gene | RSS | Regulon Activity |
| ∗The dot plots of a searched regulon are shown for all cell subpopulations in each disease state of each tissue based on the regulon specific score inferred using pySCENIC and by calculating the average expression. |
| Page: 1 |
Top |
Somatic mutation of malignant transformation related genes |
| Annotation of somatic variants for genes involved in malignant transformation |
| Hugo Symbol | Variant Class | Variant Classification | dbSNP RS | HGVSc | HGVSp | HGVSp Short | SWISSPROT | BIOTYPE | SIFT | PolyPhen | Tumor Sample Barcode | Tissue | Histology | Sex | Age | Stage | Therapy Types | Drugs | Outcome |
| KRT75 | SNV | Missense_Mutation | c.1103N>G | p.Ser368Cys | p.S368C | O95678 | protein_coding | deleterious(0) | probably_damaging(0.95) | TCGA-AC-A23H-01 | Breast | breast invasive carcinoma | Female | >=65 | I/II | Unknown | Unknown | PD | |
| KRT75 | SNV | Missense_Mutation | rs747423318 | c.1336N>A | p.Val446Met | p.V446M | O95678 | protein_coding | tolerated(0.27) | possibly_damaging(0.538) | TCGA-BH-A18G-01 | Breast | breast invasive carcinoma | Female | >=65 | I/II | Unknown | Unknown | SD |
| KRT75 | SNV | Missense_Mutation | rs201563619 | c.1489N>A | p.Gly497Ser | p.G497S | O95678 | protein_coding | tolerated(0.44) | benign(0.001) | TCGA-OL-A5RZ-01 | Breast | breast invasive carcinoma | Female | <65 | I/II | Chemotherapy | doxorubicin | CR |
| KRT75 | insertion | Frame_Shift_Ins | novel | c.386_387insCTCCTGCTGTATGCCAATCAGGGTTACAGGGTTGCAAATA | p.Leu130SerfsTer43 | p.L130Sfs*43 | O95678 | protein_coding | TCGA-A8-A07J-01 | Breast | breast invasive carcinoma | Female | <65 | I/II | Chemotherapy | 5-fluorouracil | CR | ||
| KRT75 | insertion | Nonsense_Mutation | novel | c.1156_1157insGTTAACTTGTCTGAGCTTCCATTTCTCCCTCTATAAAAGTG | p.Lys386SerfsTer2 | p.K386Sfs*2 | O95678 | protein_coding | TCGA-A8-A08H-01 | Breast | breast invasive carcinoma | Female | >=65 | I/II | Unknown | Unknown | SD | ||
| KRT75 | insertion | Frame_Shift_Ins | novel | c.309_310insTGCAGTAAGAGTCTGCAAGTATTTCTGTCTCTCCTAGGTCT | p.Val104CysfsTer42 | p.V104Cfs*42 | O95678 | protein_coding | TCGA-AN-A0FS-01 | Breast | breast invasive carcinoma | Female | <65 | I/II | Unknown | Unknown | SD | ||
| KRT75 | SNV | Missense_Mutation | rs865992888 | c.442N>A | p.Glu148Lys | p.E148K | O95678 | protein_coding | deleterious(0) | possibly_damaging(0.883) | TCGA-EA-A410-01 | Cervix | cervical & endocervical cancer | Female | <65 | I/II | Unknown | Unknown | SD |
| KRT75 | SNV | Missense_Mutation | rs200222543 | c.835N>A | p.Glu279Lys | p.E279K | O95678 | protein_coding | tolerated(0.07) | benign(0.322) | TCGA-ZJ-AAXU-01 | Cervix | cervical & endocervical cancer | Female | <65 | I/II | Unknown | Unknown | SD |
| KRT75 | SNV | Missense_Mutation | rs780776250 | c.785N>T | p.Ala262Val | p.A262V | O95678 | protein_coding | deleterious(0.04) | possibly_damaging(0.457) | TCGA-AA-3821-01 | Colorectum | colon adenocarcinoma | Female | >=65 | I/II | Unknown | Unknown | SD |
| KRT75 | SNV | Missense_Mutation | rs754329186 | c.1082N>A | p.Arg361Gln | p.R361Q | O95678 | protein_coding | tolerated(0.05) | possibly_damaging(0.642) | TCGA-AA-3984-01 | Colorectum | colon adenocarcinoma | Female | <65 | I/II | Unknown | Unknown | SD |
| Page: 1 2 3 4 5 6 7 8 |
Top |
Related drugs of malignant transformation related genes |
| Identification of chemicals and drugs interact with genes involved in malignant transfromation |
| (DGIdb 4.0) |
| Entrez ID | Symbol | Category | Interaction Types | Drug Claim Name | Drug Name | PMIDs |
| Page: 1 |

Copyright 2023-Present -The University of Texas Health Science Center at Houston |