
|
|||||
|
 | |
| |
| |
| |
| |
| |
|
Gene: KRT7 |
Gene summary for KRT7 |
| Gene information | Species | Human | Gene symbol | KRT7 | Gene ID | 3855 |
| Gene name | keratin 7 | |
| Gene Alias | CK7 | |
| Cytomap | 12q13.13 | |
| Gene Type | protein-coding | GO ID | GO:0005575 | UniProtAcc | P08729 |
Top |
Malignant transformation analysis |
| Identification of the aberrant gene expression in precancerous and cancerous lesions by comparing the gene expression of stem-like cells in diseased tissues with normal stem cells |
| Entrez ID | Symbol | Replicates | Species | Organ | Tissue | Adj P-value | Log2FC | Malignancy |
| 3855 | KRT7 | GSM4909282 | Human | Breast | IDC | 1.05e-08 | -4.80e-01 | -0.0288 |
| 3855 | KRT7 | GSM4909285 | Human | Breast | IDC | 2.01e-03 | 6.61e-02 | 0.21 |
| 3855 | KRT7 | GSM4909286 | Human | Breast | IDC | 1.75e-14 | -2.08e-01 | 0.1081 |
| 3855 | KRT7 | GSM4909287 | Human | Breast | IDC | 1.23e-02 | -3.19e-01 | 0.2057 |
| 3855 | KRT7 | GSM4909293 | Human | Breast | IDC | 3.84e-19 | -6.45e-01 | 0.1581 |
| 3855 | KRT7 | GSM4909294 | Human | Breast | IDC | 1.92e-28 | 4.07e-01 | 0.2022 |
| 3855 | KRT7 | GSM4909296 | Human | Breast | IDC | 9.81e-03 | -1.96e-01 | 0.1524 |
| 3855 | KRT7 | GSM4909297 | Human | Breast | IDC | 5.45e-13 | -2.73e-02 | 0.1517 |
| 3855 | KRT7 | GSM4909298 | Human | Breast | IDC | 3.22e-04 | -1.96e-01 | 0.1551 |
| 3855 | KRT7 | GSM4909301 | Human | Breast | IDC | 1.00e-46 | -1.03e+00 | 0.1577 |
| 3855 | KRT7 | GSM4909302 | Human | Breast | IDC | 6.49e-03 | 2.20e-01 | 0.1545 |
| 3855 | KRT7 | GSM4909304 | Human | Breast | IDC | 3.40e-20 | -6.86e-01 | 0.1636 |
| 3855 | KRT7 | GSM4909305 | Human | Breast | IDC | 1.05e-11 | 4.68e-01 | 0.0436 |
| 3855 | KRT7 | GSM4909307 | Human | Breast | IDC | 6.33e-12 | -5.62e-01 | 0.1569 |
| 3855 | KRT7 | GSM4909308 | Human | Breast | IDC | 2.80e-35 | -8.87e-01 | 0.158 |
| 3855 | KRT7 | GSM4909311 | Human | Breast | IDC | 5.74e-37 | -4.47e-01 | 0.1534 |
| 3855 | KRT7 | GSM4909312 | Human | Breast | IDC | 2.16e-05 | -2.10e-01 | 0.1552 |
| 3855 | KRT7 | GSM4909313 | Human | Breast | IDC | 1.75e-04 | 1.83e-01 | 0.0391 |
| 3855 | KRT7 | GSM4909315 | Human | Breast | IDC | 1.03e-77 | 8.28e-01 | 0.21 |
| 3855 | KRT7 | GSM4909316 | Human | Breast | IDC | 1.02e-33 | 7.48e-01 | 0.21 |
| Page: 1 2 3 4 5 6 7 8 9 10 11 12 |
| Tissue | Expression Dynamics | Abbreviation |
| Breast | 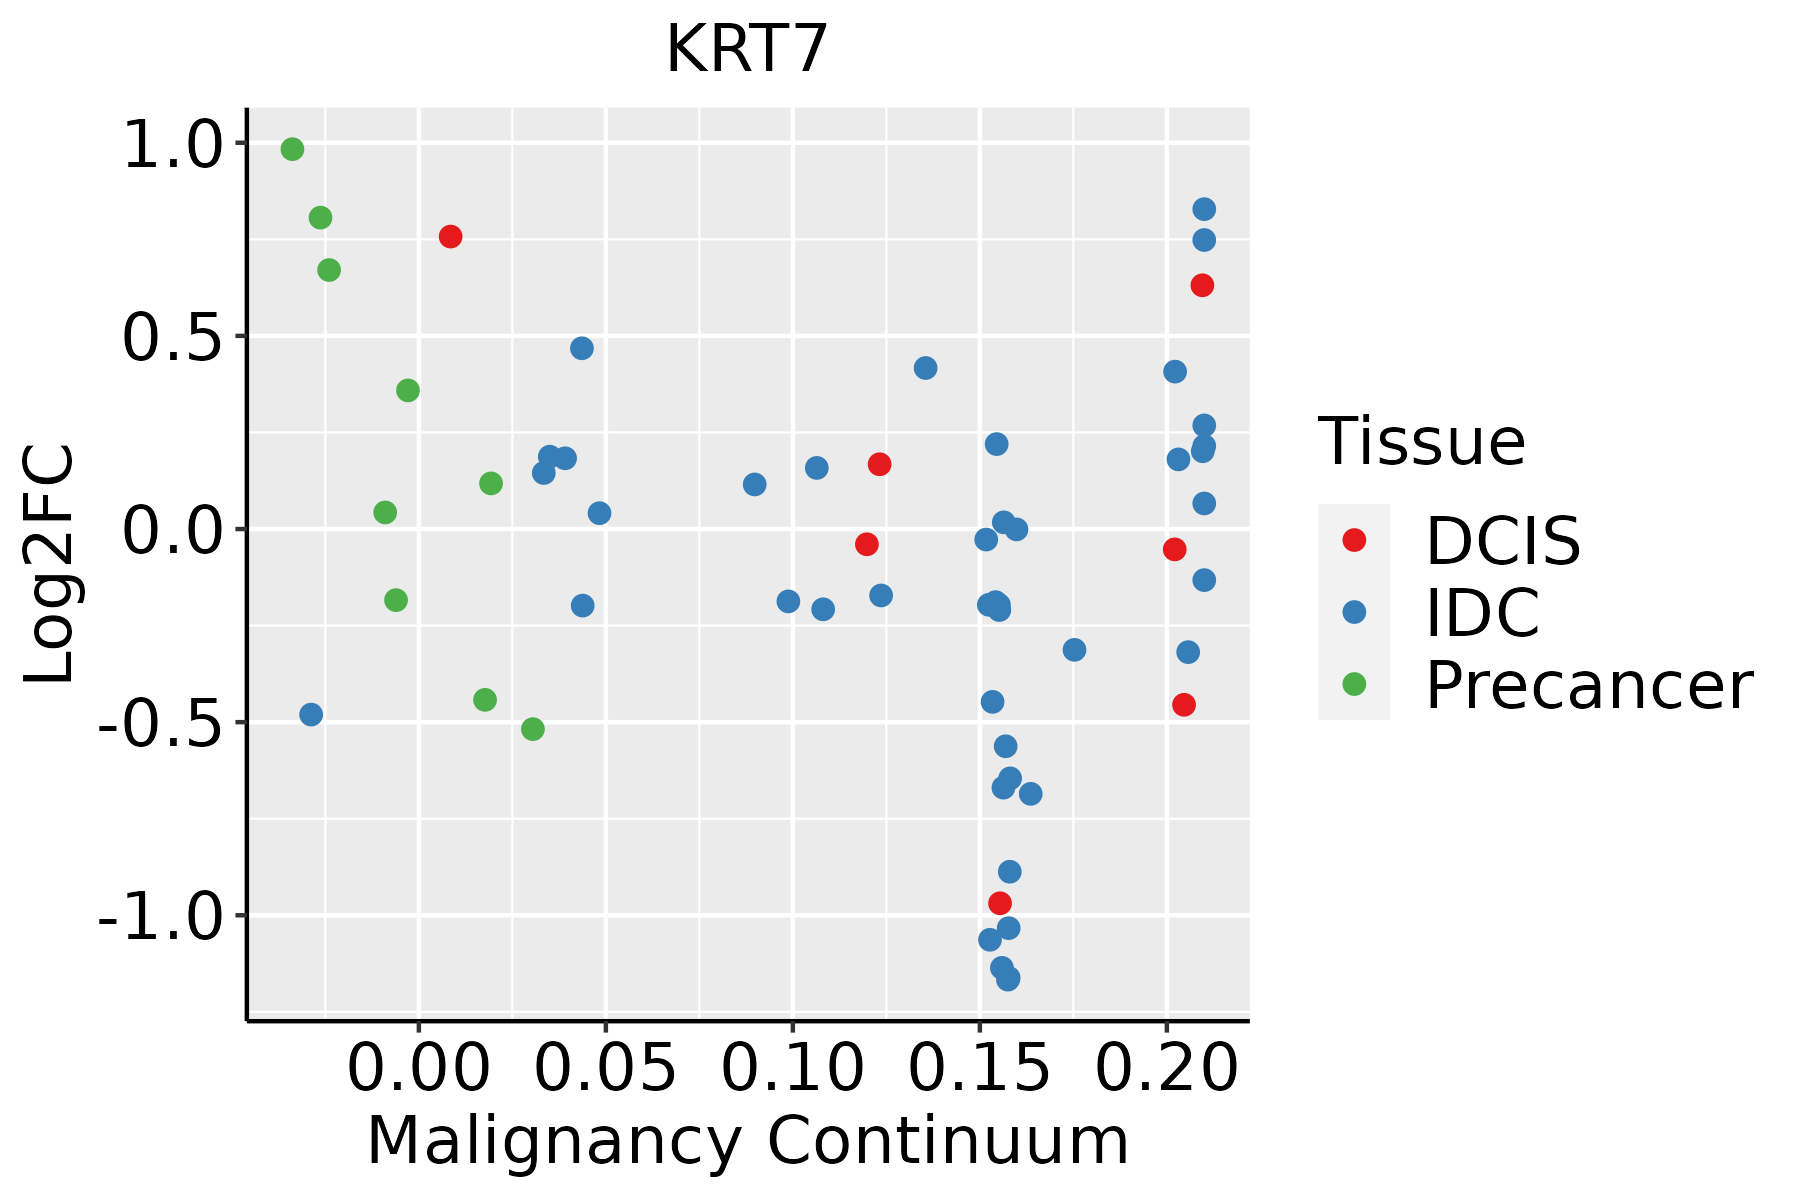 | IDC: Invasive ductal carcinoma |
| DCIS: Ductal carcinoma in situ | ||
| Precancer(BRCA1-mut): Precancerous lesion from BRCA1 mutation carriers | ||
| Cervix | 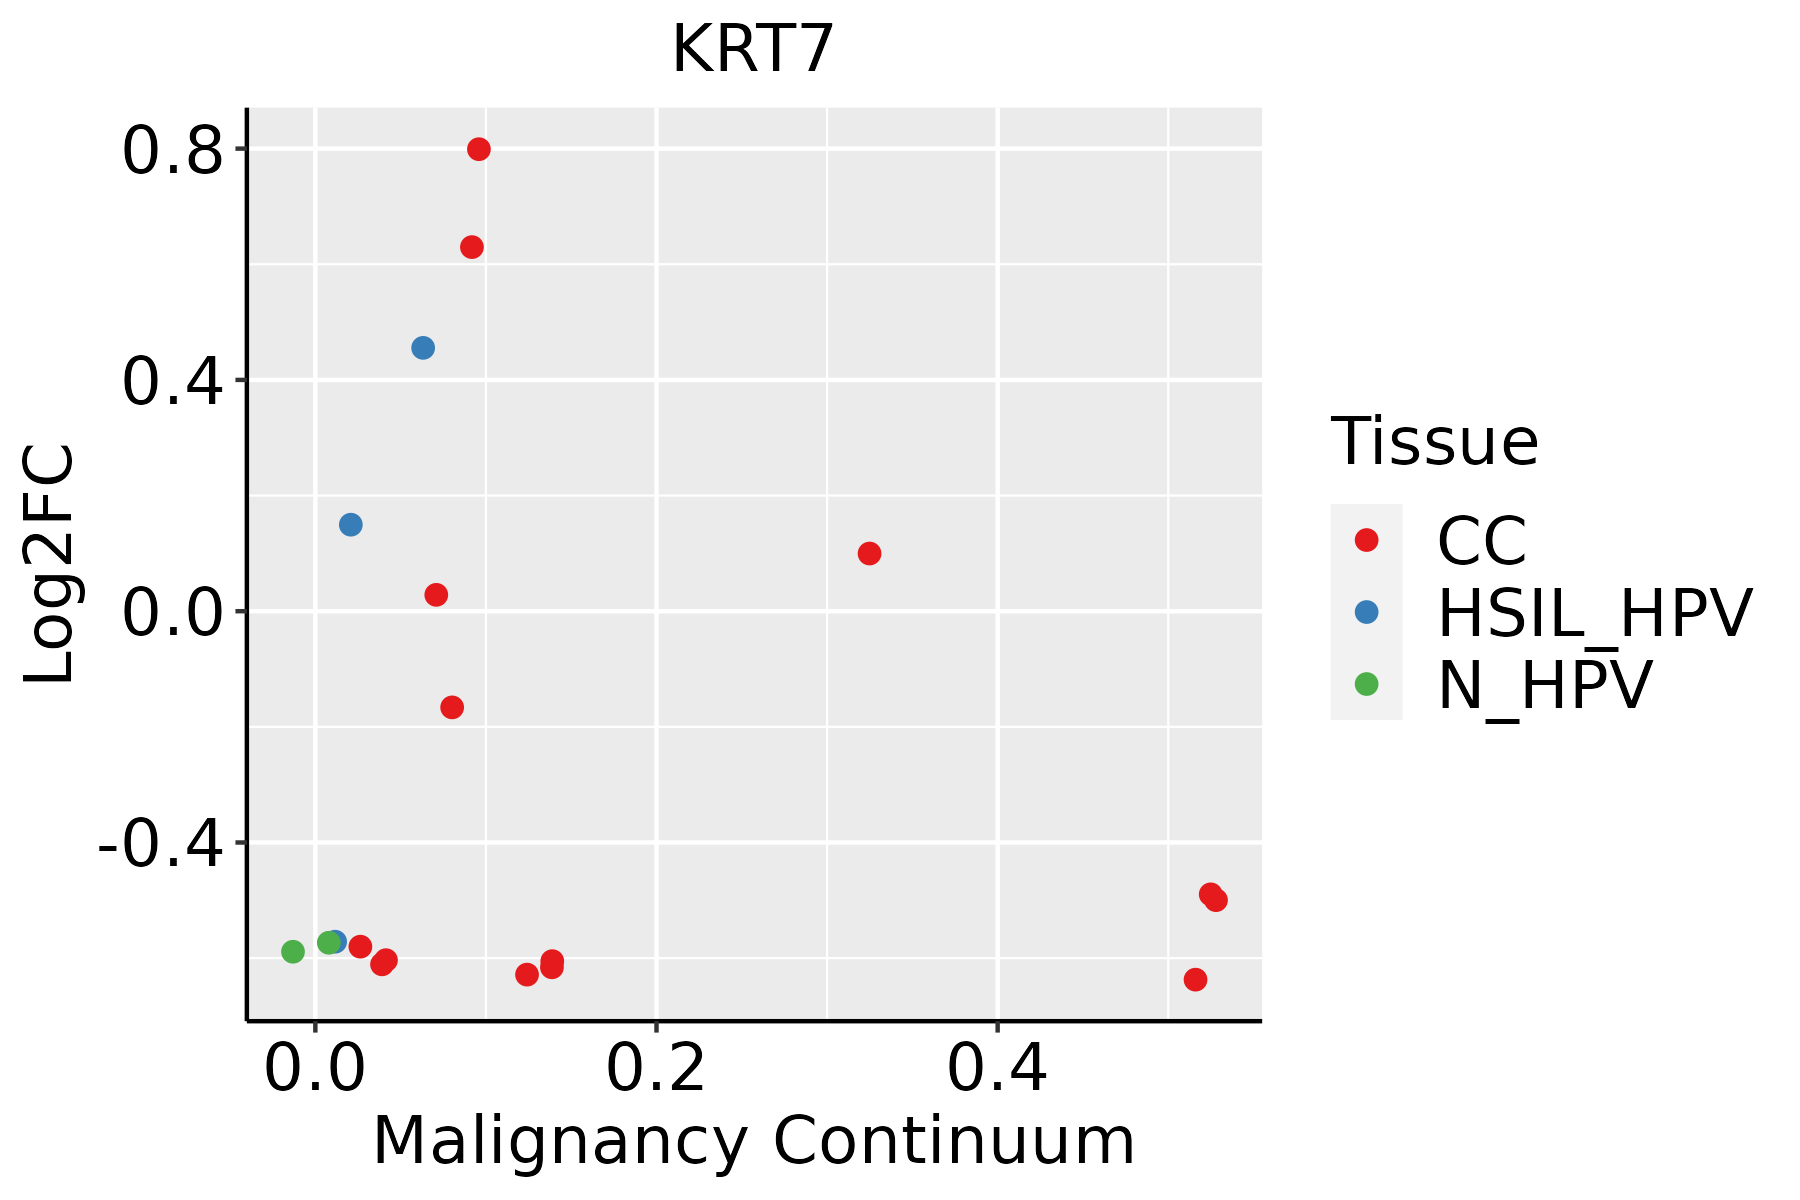 | CC: Cervix cancer |
| HSIL_HPV: HPV-infected high-grade squamous intraepithelial lesions | ||
| N_HPV: HPV-infected normal cervix | ||
| Endometrium | 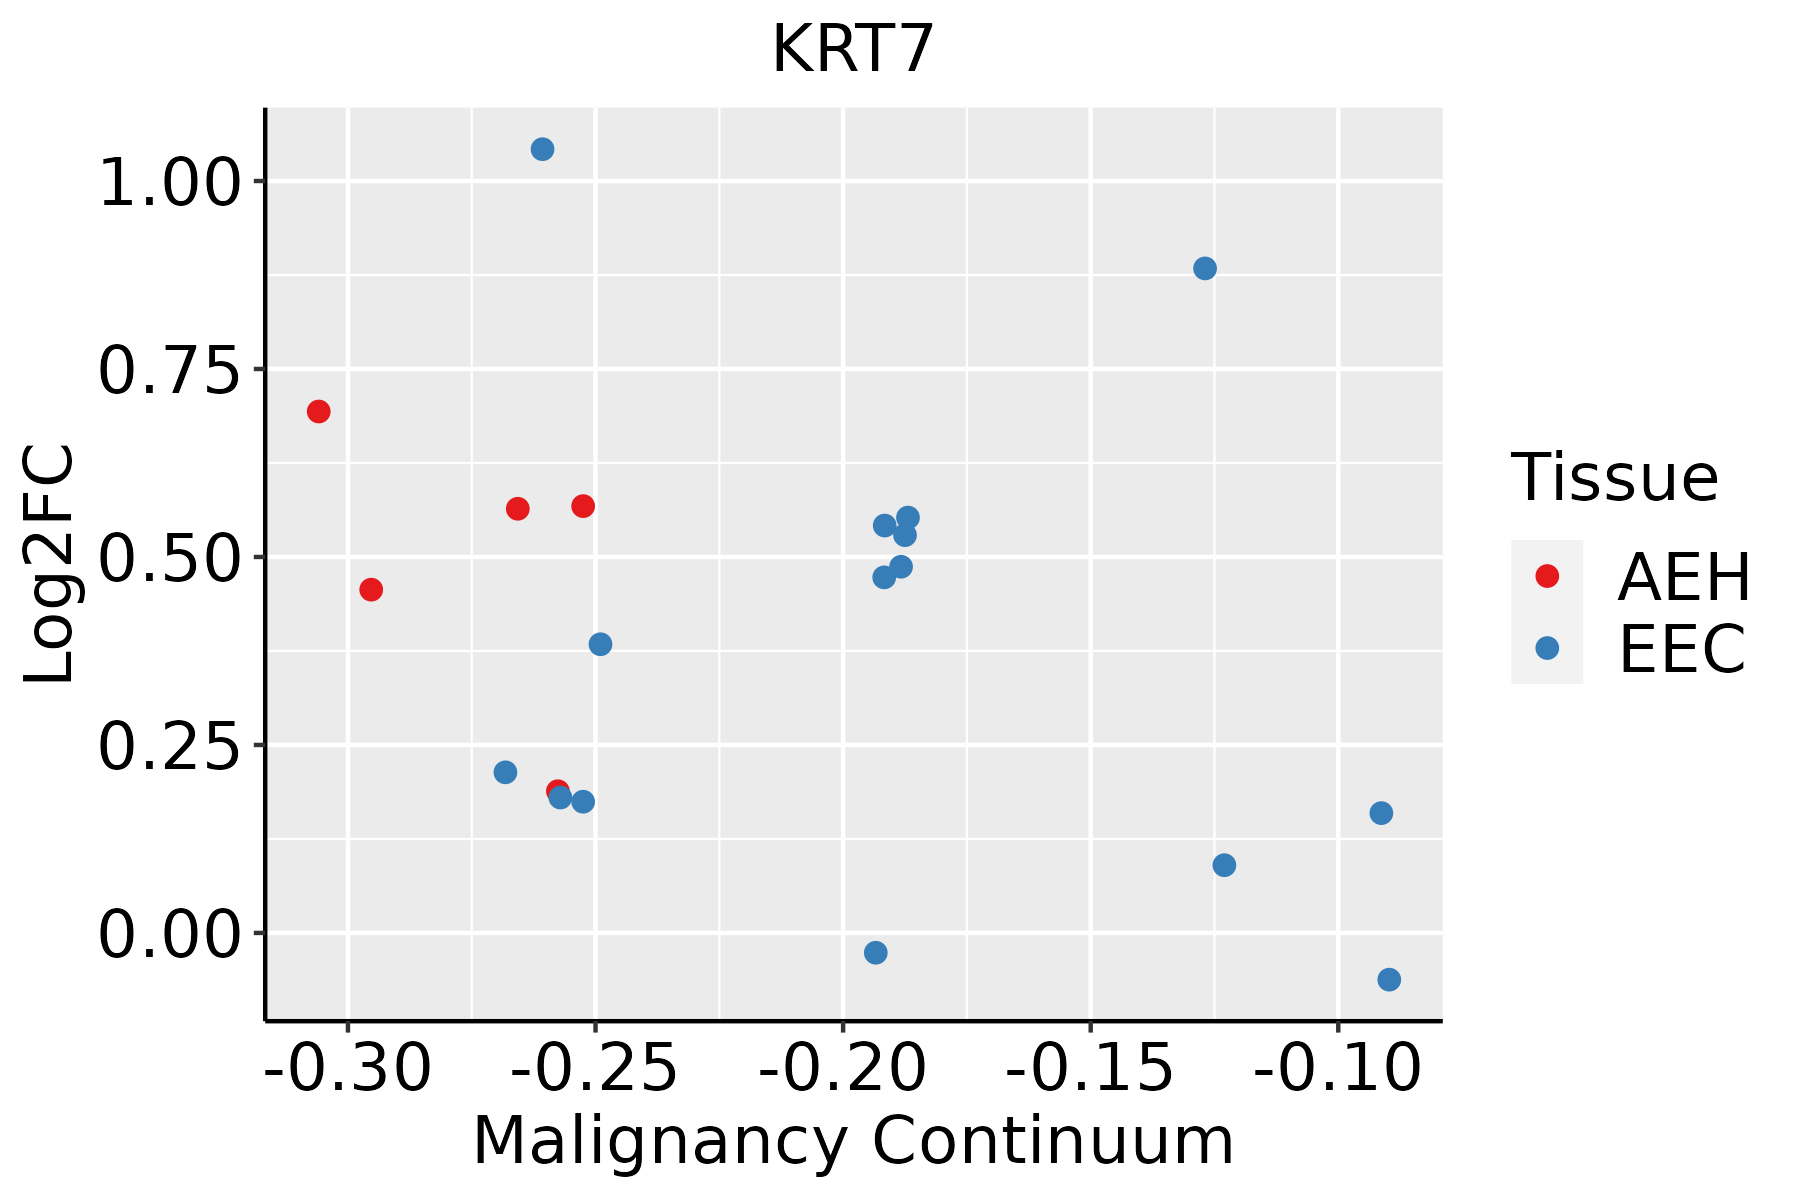 | AEH: Atypical endometrial hyperplasia |
| EEC: Endometrioid Cancer | ||
| Esophagus |  | ESCC: Esophageal squamous cell carcinoma |
| HGIN: High-grade intraepithelial neoplasias | ||
| LGIN: Low-grade intraepithelial neoplasias | ||
| GC | 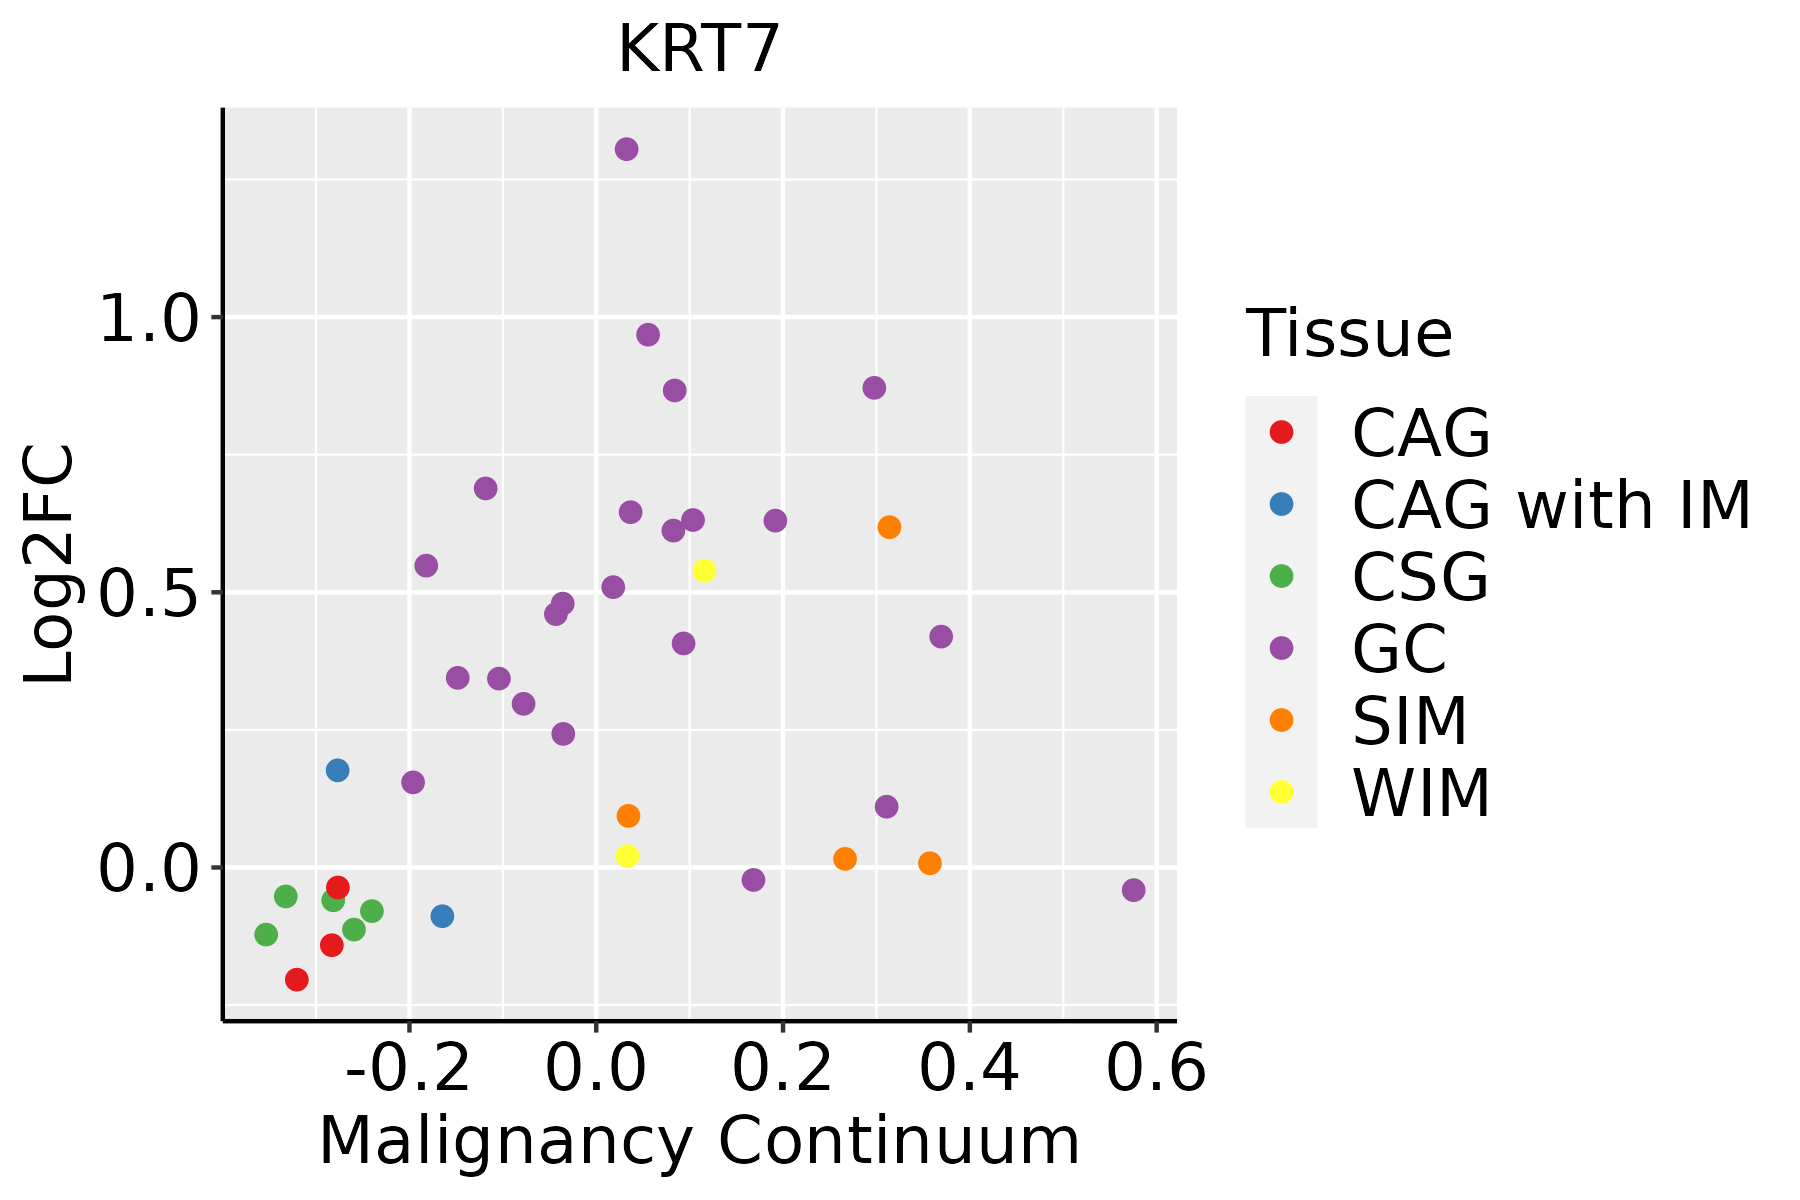 | CAG: Chronic atrophic gastritis |
| CAG with IM: Chronic atrophic gastritis with intestinal metaplasia | ||
| CSG: Chronic superficial gastritis | ||
| GC: Gastric cancer | ||
| SIM: Severe intestinal metaplasia | ||
| WIM: Wild intestinal metaplasia | ||
| Liver | 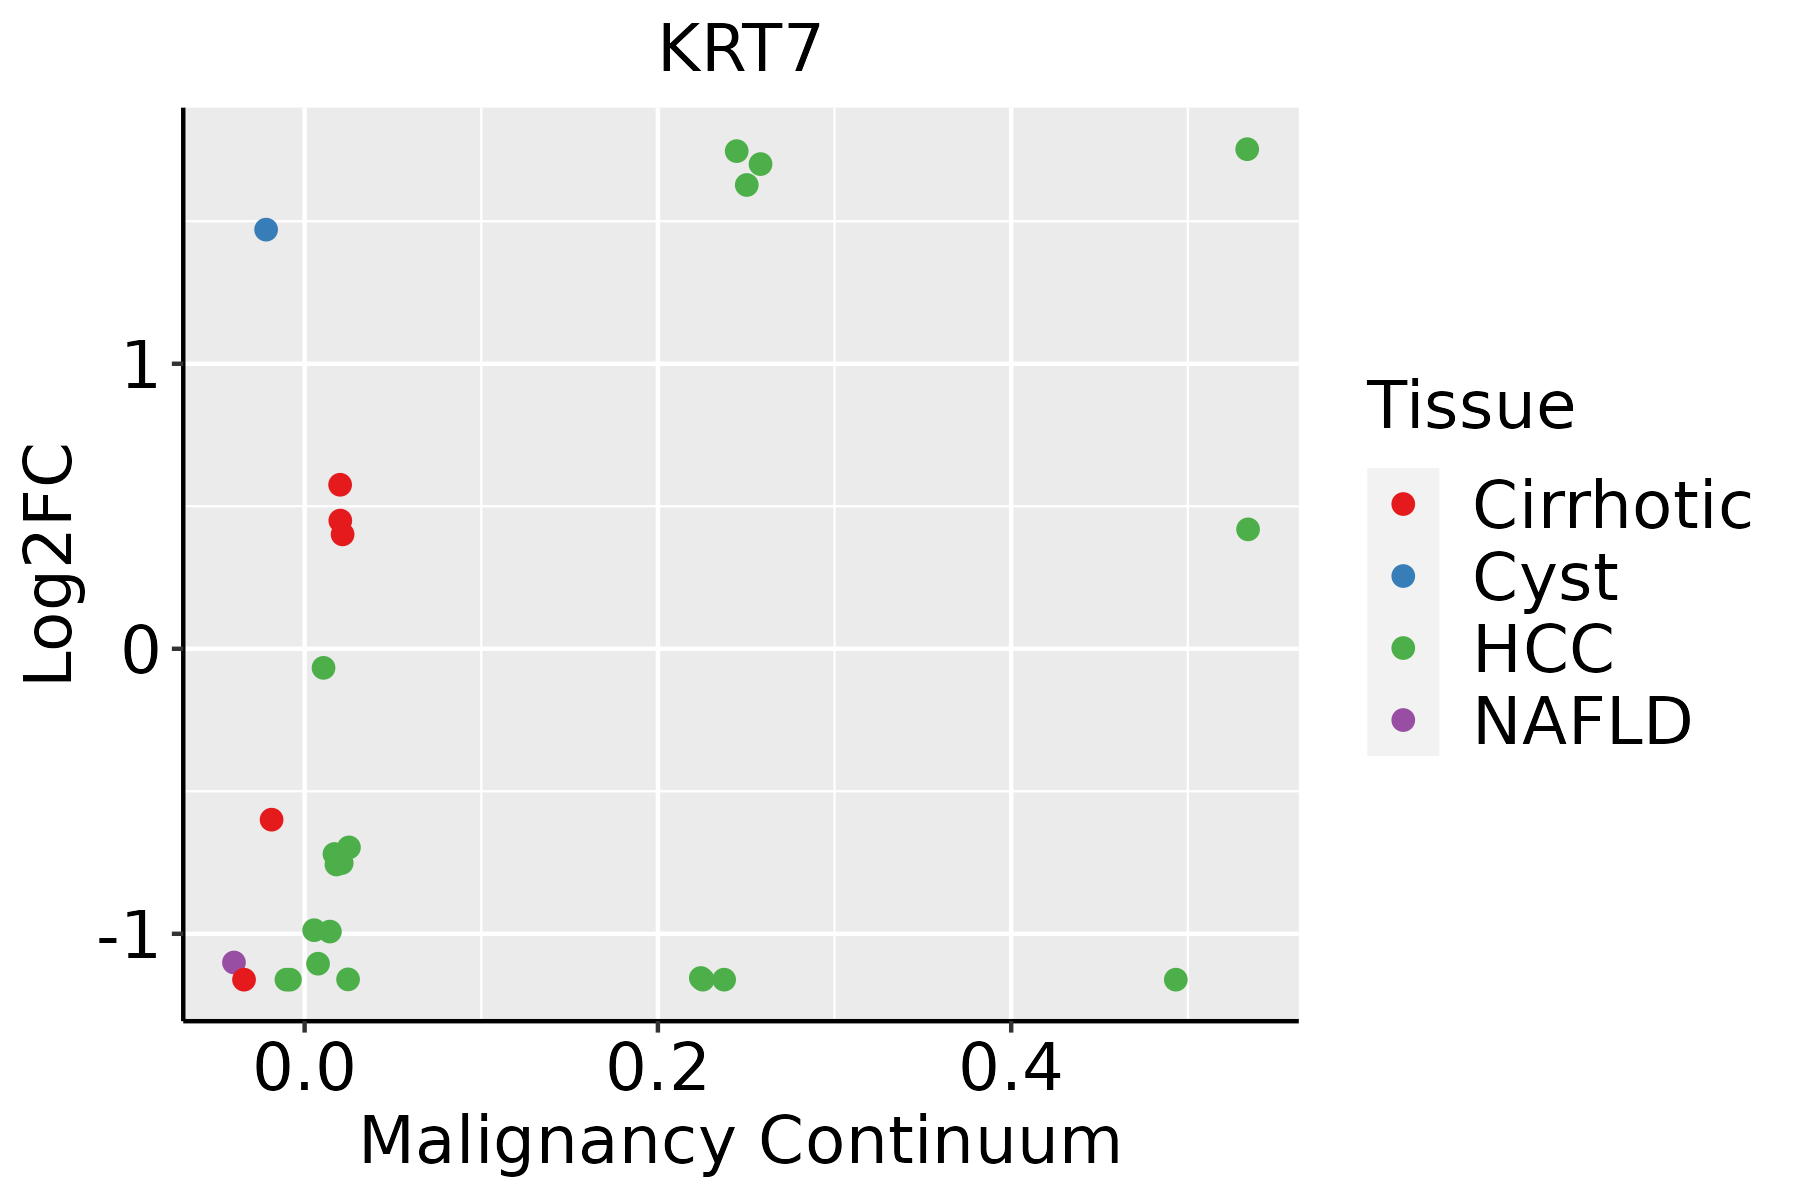 | HCC: Hepatocellular carcinoma |
| NAFLD: Non-alcoholic fatty liver disease | ||
| Oral Cavity | 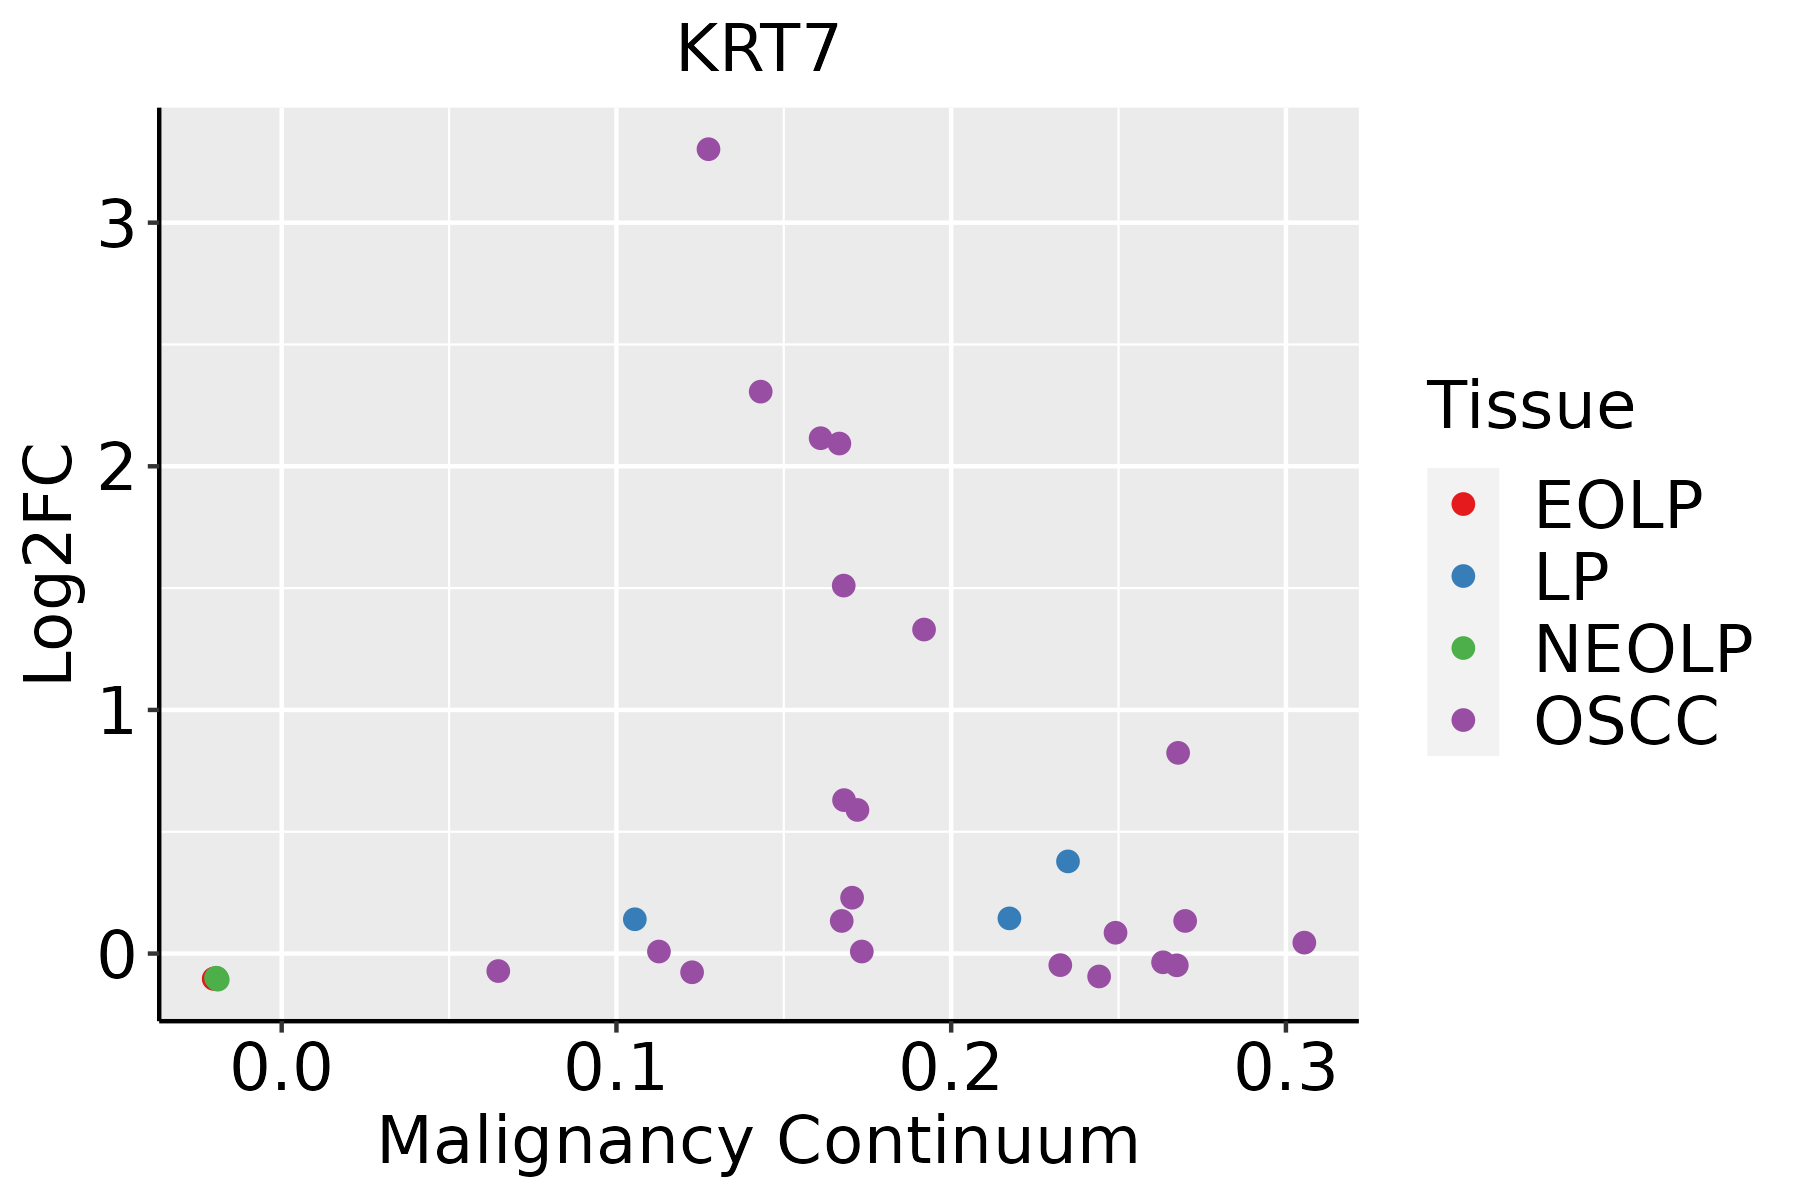 | EOLP: Erosive Oral lichen planus |
| LP: leukoplakia | ||
| NEOLP: Non-erosive oral lichen planus | ||
| OSCC: Oral squamous cell carcinoma | ||
| Prostate | 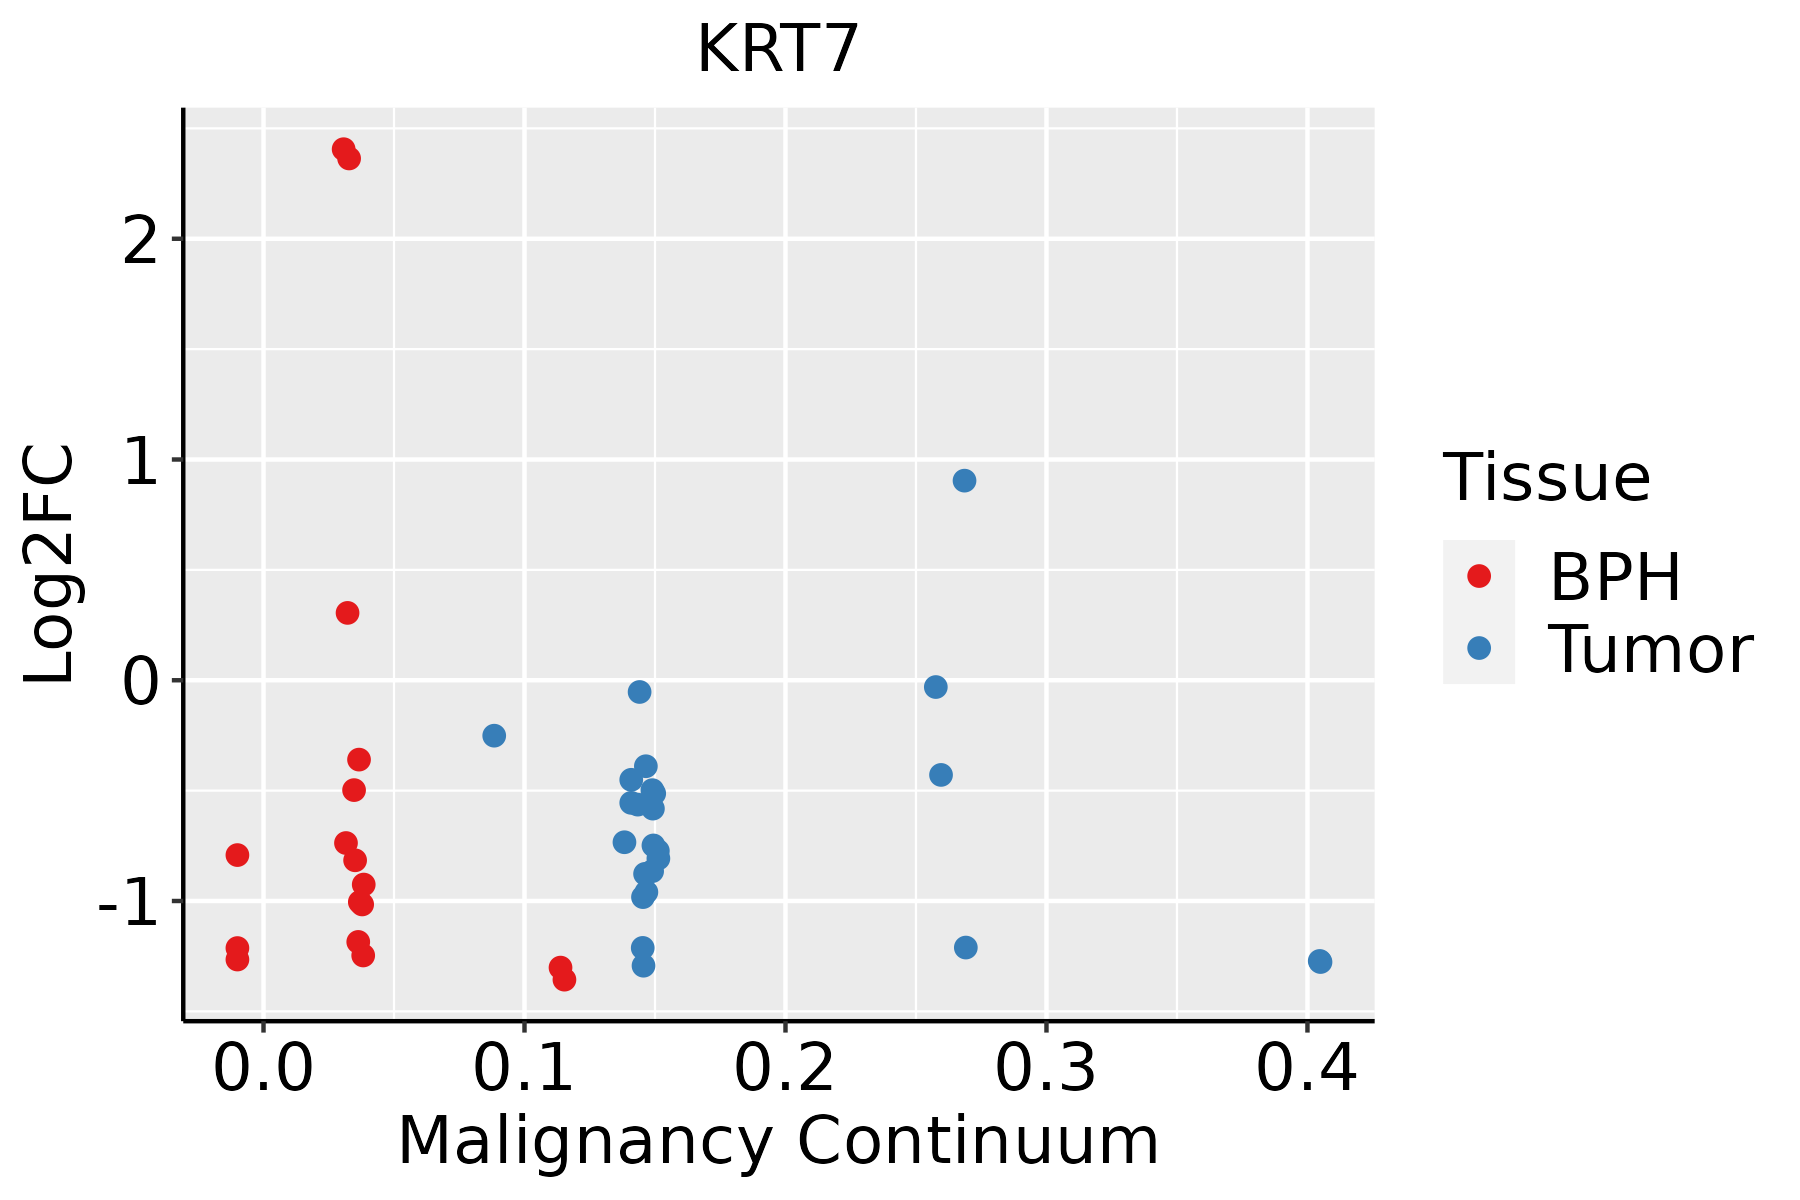 | BPH: Benign Prostatic Hyperplasia |
| Thyroid | 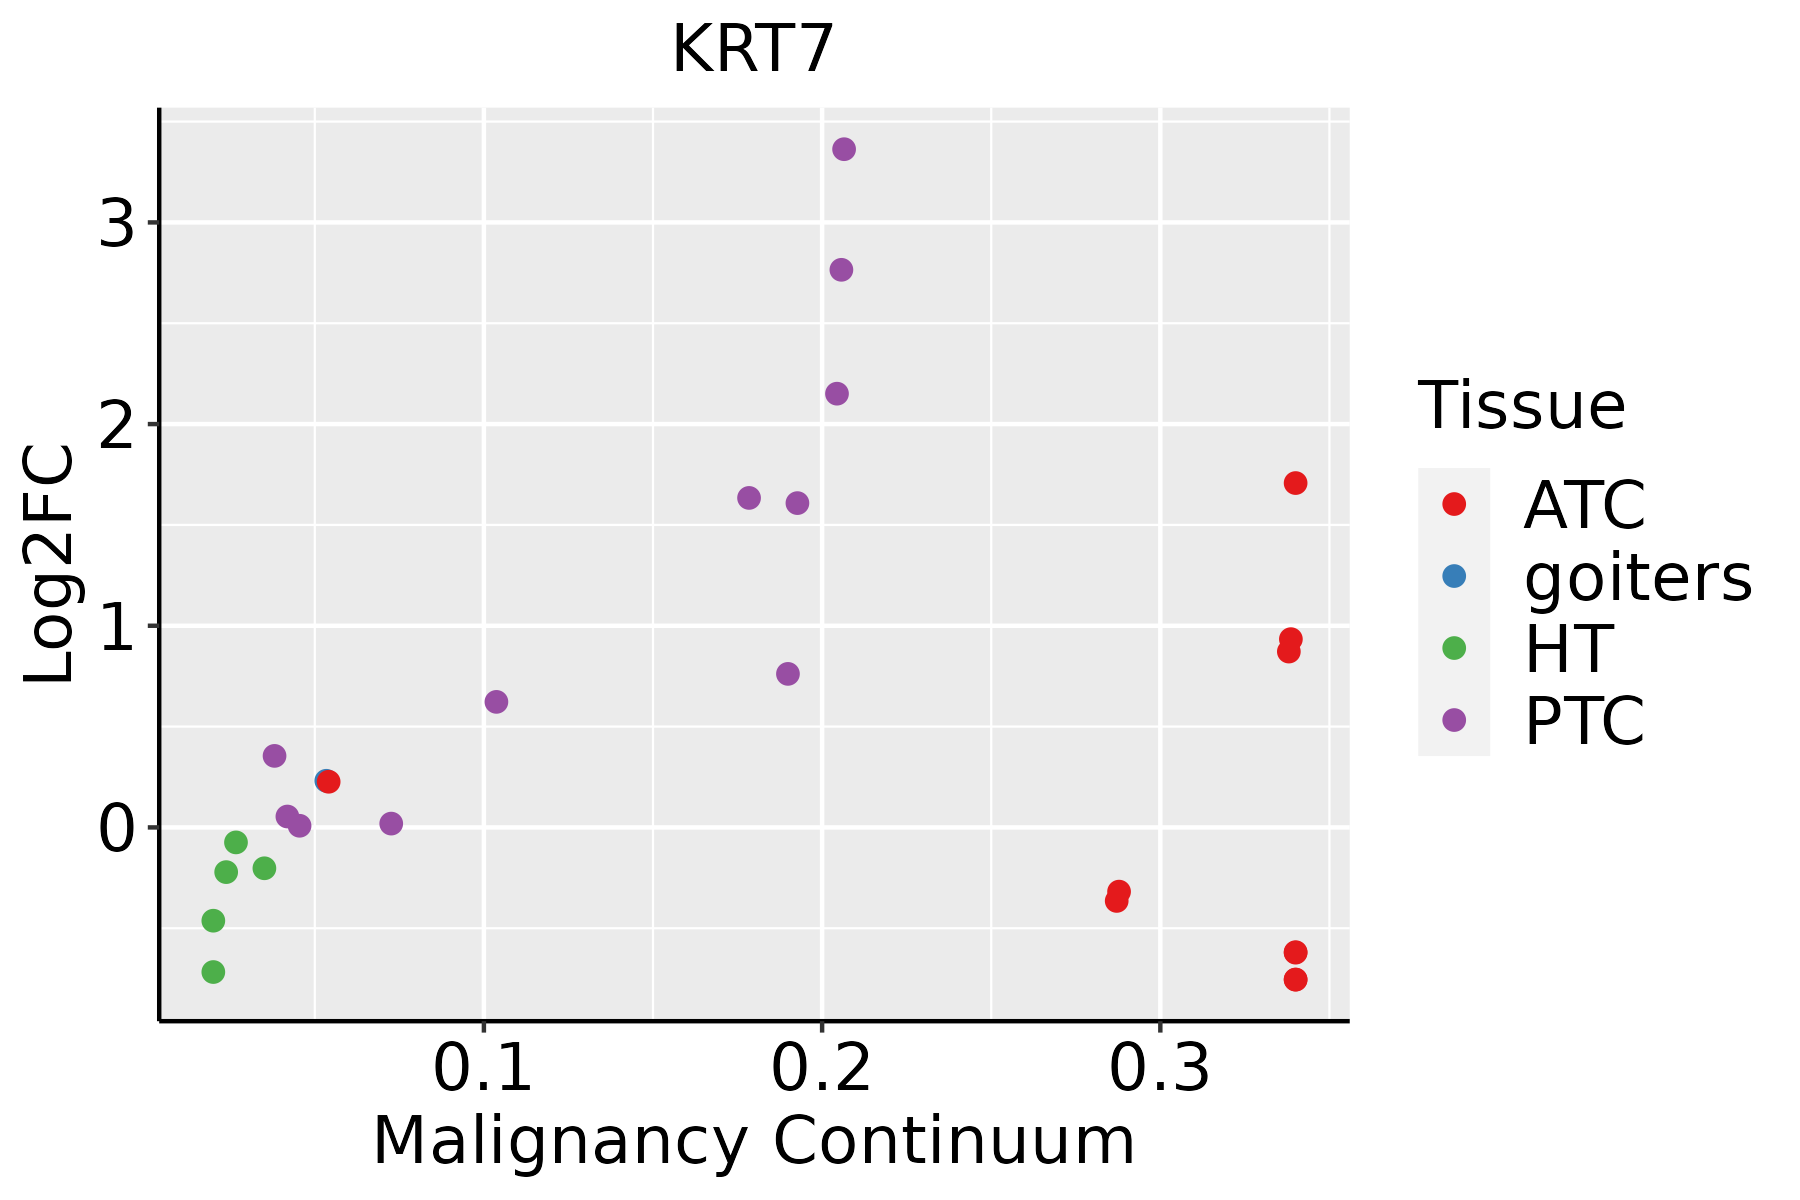 | ATC: Anaplastic thyroid cancer |
| HT: Hashimoto's thyroiditis | ||
| PTC: Papillary thyroid cancer |
| ∗log2FC in expression of this searched gene in stem-like cells from each diseased tissue sample relative to stem-like cells in normal samples in each tissue plotted against the malignancy continuum. Samples are colored based on if they are from different disease stage. |
Top |
Malignant transformation related pathway analysis |
| Find out the enriched GO biological processes and KEGG pathways involved in transition from healthy to precancer to cancer |
| Tissue | Disease Stage | Enriched GO biological Processes |
| Colorectum | AD |  |
| Colorectum | SER |  |
| Colorectum | MSS |  |
| Colorectum | MSI-H |  |
| Colorectum | FAP |  |
| ∗Top 15 enriched GO BP terms are showed in the bar plot of each disease state in each tissue. Each row represents a significant GO biological process which is colored according to the -log10(p.adjust). |
| Page: 1 2 3 4 5 6 7 8 9 |
| GO ID | Tissue | Disease Stage | Description | Gene Ratio | Bg Ratio | pvalue | p.adjust | Count |
| GO:0002244 | Colorectum | MSS | hematopoietic progenitor cell differentiation | 32/3467 | 114/18723 | 8.07e-03 | 4.91e-02 | 32 |
| GO:00022446 | Esophagus | ESCC | hematopoietic progenitor cell differentiation | 66/8552 | 114/18723 | 5.74e-03 | 2.13e-02 | 66 |
| GO:00022445 | Oral cavity | OSCC | hematopoietic progenitor cell differentiation | 57/7305 | 114/18723 | 1.09e-02 | 3.71e-02 | 57 |
| GO:000224413 | Skin | cSCC | hematopoietic progenitor cell differentiation | 42/4864 | 114/18723 | 6.74e-03 | 3.27e-02 | 42 |
| Page: 1 |
| Pathway ID | Tissue | Disease Stage | Description | Gene Ratio | Bg Ratio | pvalue | p.adjust | qvalue | Count |
| Page: 1 |
Top |
Cell-cell communication analysis |
| Identification of potential cell-cell interactions between two cell types and their ligand-receptor pairs for different disease states |
| Ligand | Receptor | LRpair | Pathway | Tissue | Disease Stage |
| Page: 1 |
Top |
Single-cell gene regulatory network inference analysis |
| Find out the significant the regulons (TFs) and the target genes of each regulon across cell types for different disease states |
| TF | Cell Type | Tissue | Disease Stage | Target Gene | RSS | Regulon Activity |
| ∗The dot plots of a searched regulon are shown for all cell subpopulations in each disease state of each tissue based on the regulon specific score inferred using pySCENIC and by calculating the average expression. |
| Page: 1 |
Top |
Somatic mutation of malignant transformation related genes |
| Annotation of somatic variants for genes involved in malignant transformation |
| Hugo Symbol | Variant Class | Variant Classification | dbSNP RS | HGVSc | HGVSp | HGVSp Short | SWISSPROT | BIOTYPE | SIFT | PolyPhen | Tumor Sample Barcode | Tissue | Histology | Sex | Age | Stage | Therapy Types | Drugs | Outcome |
| KRT7 | SNV | Missense_Mutation | novel | c.1205G>T | p.Arg402Leu | p.R402L | P08729 | protein_coding | deleterious(0) | probably_damaging(0.998) | TCGA-AN-A0FV-01 | Breast | breast invasive carcinoma | Female | <65 | I/II | Unknown | Unknown | SD |
| KRT7 | SNV | Missense_Mutation | novel | c.737T>G | p.Val246Gly | p.V246G | P08729 | protein_coding | deleterious(0) | probably_damaging(0.995) | TCGA-B6-A0IA-01 | Breast | breast invasive carcinoma | Female | <65 | I/II | Unknown | Unknown | SD |
| KRT7 | SNV | Missense_Mutation | novel | c.511G>A | p.Asp171Asn | p.D171N | P08729 | protein_coding | deleterious(0.05) | benign(0.159) | TCGA-BH-A1EN-01 | Breast | breast invasive carcinoma | Female | >=65 | I/II | Unknown | Unknown | SD |
| KRT7 | SNV | Missense_Mutation | rs367997288 | c.560N>A | p.Arg187His | p.R187H | P08729 | protein_coding | deleterious(0.02) | possibly_damaging(0.828) | TCGA-D8-A1Y1-01 | Breast | breast invasive carcinoma | Female | >=65 | III/IV | Hormone Therapy | tamoxiphen | PD |
| KRT7 | SNV | Missense_Mutation | c.961N>C | p.Glu321Gln | p.E321Q | P08729 | protein_coding | deleterious(0) | probably_damaging(0.992) | TCGA-EW-A1PH-01 | Breast | breast invasive carcinoma | Female | <65 | I/II | Chemotherapy | cyclophosphamide | SD | |
| KRT7 | insertion | Frame_Shift_Ins | novel | c.1329_1330insGGGTGGGG | p.Ser444GlyfsTer12 | p.S444Gfs*12 | P08729 | protein_coding | TCGA-A8-A08S-01 | Breast | breast invasive carcinoma | Female | >=65 | I/II | Hormone Therapy | anastrozole | SD | ||
| KRT7 | insertion | Frame_Shift_Ins | novel | c.1203_1204insTTTGTCAGCTGCCTGACAT | p.Arg402PhefsTer28 | p.R402Ffs*28 | P08729 | protein_coding | TCGA-AN-A0FV-01 | Breast | breast invasive carcinoma | Female | <65 | I/II | Unknown | Unknown | SD | ||
| KRT7 | SNV | Missense_Mutation | rs367997288 | c.560N>A | p.Arg187His | p.R187H | P08729 | protein_coding | deleterious(0.02) | possibly_damaging(0.828) | TCGA-2W-A8YY-01 | Cervix | cervical & endocervical cancer | Female | <65 | I/II | Chemotherapy | cisplatin | CR |
| KRT7 | SNV | Missense_Mutation | novel | c.801N>T | p.Gln267His | p.Q267H | P08729 | protein_coding | deleterious(0.01) | probably_damaging(0.929) | TCGA-2W-A8YY-01 | Cervix | cervical & endocervical cancer | Female | <65 | I/II | Chemotherapy | cisplatin | CR |
| KRT7 | SNV | Missense_Mutation | rs148429275 | c.1108C>T | p.Arg370Trp | p.R370W | P08729 | protein_coding | deleterious(0) | benign(0.159) | TCGA-VS-A9UJ-01 | Cervix | cervical & endocervical cancer | Female | <65 | I/II | Unknown | Unknown | PD |
| Page: 1 2 3 4 5 6 |
Top |
Related drugs of malignant transformation related genes |
| Identification of chemicals and drugs interact with genes involved in malignant transfromation |
| (DGIdb 4.0) |
| Entrez ID | Symbol | Category | Interaction Types | Drug Claim Name | Drug Name | PMIDs |
| Page: 1 |

Copyright 2023-Present -The University of Texas Health Science Center at Houston |