
|
|||||
|
 | |
| |
| |
| |
| |
| |
|
Gene: KRT6C |
Gene summary for KRT6C |
| Gene information | Species | Human | Gene symbol | KRT6C | Gene ID | 286887 |
| Gene name | keratin 6C | |
| Gene Alias | K6E | |
| Cytomap | 12q13.13 | |
| Gene Type | protein-coding | GO ID | GO:0006996 | UniProtAcc | P48668 |
Top |
Malignant transformation analysis |
| Identification of the aberrant gene expression in precancerous and cancerous lesions by comparing the gene expression of stem-like cells in diseased tissues with normal stem cells |
| Entrez ID | Symbol | Replicates | Species | Organ | Tissue | Adj P-value | Log2FC | Malignancy |
| 286887 | KRT6C | P1T-E | Human | Esophagus | ESCC | 3.68e-14 | 1.63e+00 | 0.0875 |
| 286887 | KRT6C | P4T-E | Human | Esophagus | ESCC | 1.79e-08 | 5.73e-01 | 0.1323 |
| 286887 | KRT6C | P5T-E | Human | Esophagus | ESCC | 4.31e-14 | 5.30e-01 | 0.1327 |
| 286887 | KRT6C | P11T-E | Human | Esophagus | ESCC | 3.27e-03 | 8.13e-01 | 0.1426 |
| 286887 | KRT6C | P12T-E | Human | Esophagus | ESCC | 2.70e-03 | 7.48e-02 | 0.1122 |
| 286887 | KRT6C | P19T-E | Human | Esophagus | ESCC | 6.74e-06 | 2.56e+00 | 0.1662 |
| 286887 | KRT6C | P20T-E | Human | Esophagus | ESCC | 1.04e-36 | 1.18e+00 | 0.1124 |
| 286887 | KRT6C | P23T-E | Human | Esophagus | ESCC | 1.57e-03 | 2.88e-01 | 0.108 |
| 286887 | KRT6C | P28T-E | Human | Esophagus | ESCC | 1.51e-12 | 1.96e-01 | 0.1149 |
| 286887 | KRT6C | P36T-E | Human | Esophagus | ESCC | 1.05e-09 | 2.04e-01 | 0.1187 |
| 286887 | KRT6C | P37T-E | Human | Esophagus | ESCC | 5.20e-05 | 5.26e-01 | 0.1371 |
| 286887 | KRT6C | P42T-E | Human | Esophagus | ESCC | 5.82e-06 | 3.30e-01 | 0.1175 |
| 286887 | KRT6C | P49T-E | Human | Esophagus | ESCC | 1.57e-08 | 9.18e-01 | 0.1768 |
| 286887 | KRT6C | P52T-E | Human | Esophagus | ESCC | 2.84e-09 | 3.74e-01 | 0.1555 |
| 286887 | KRT6C | P54T-E | Human | Esophagus | ESCC | 8.50e-10 | 1.08e-01 | 0.0975 |
| 286887 | KRT6C | P61T-E | Human | Esophagus | ESCC | 2.18e-03 | 1.37e-02 | 0.099 |
| 286887 | KRT6C | P62T-E | Human | Esophagus | ESCC | 1.01e-04 | 8.63e-02 | 0.1302 |
| 286887 | KRT6C | P74T-E | Human | Esophagus | ESCC | 5.55e-10 | 3.33e-01 | 0.1479 |
| 286887 | KRT6C | P80T-E | Human | Esophagus | ESCC | 1.69e-21 | 1.24e+00 | 0.155 |
| 286887 | KRT6C | P83T-E | Human | Esophagus | ESCC | 8.56e-12 | 3.92e-01 | 0.1738 |
| Page: 1 2 3 |
| Tissue | Expression Dynamics | Abbreviation |
| Esophagus | 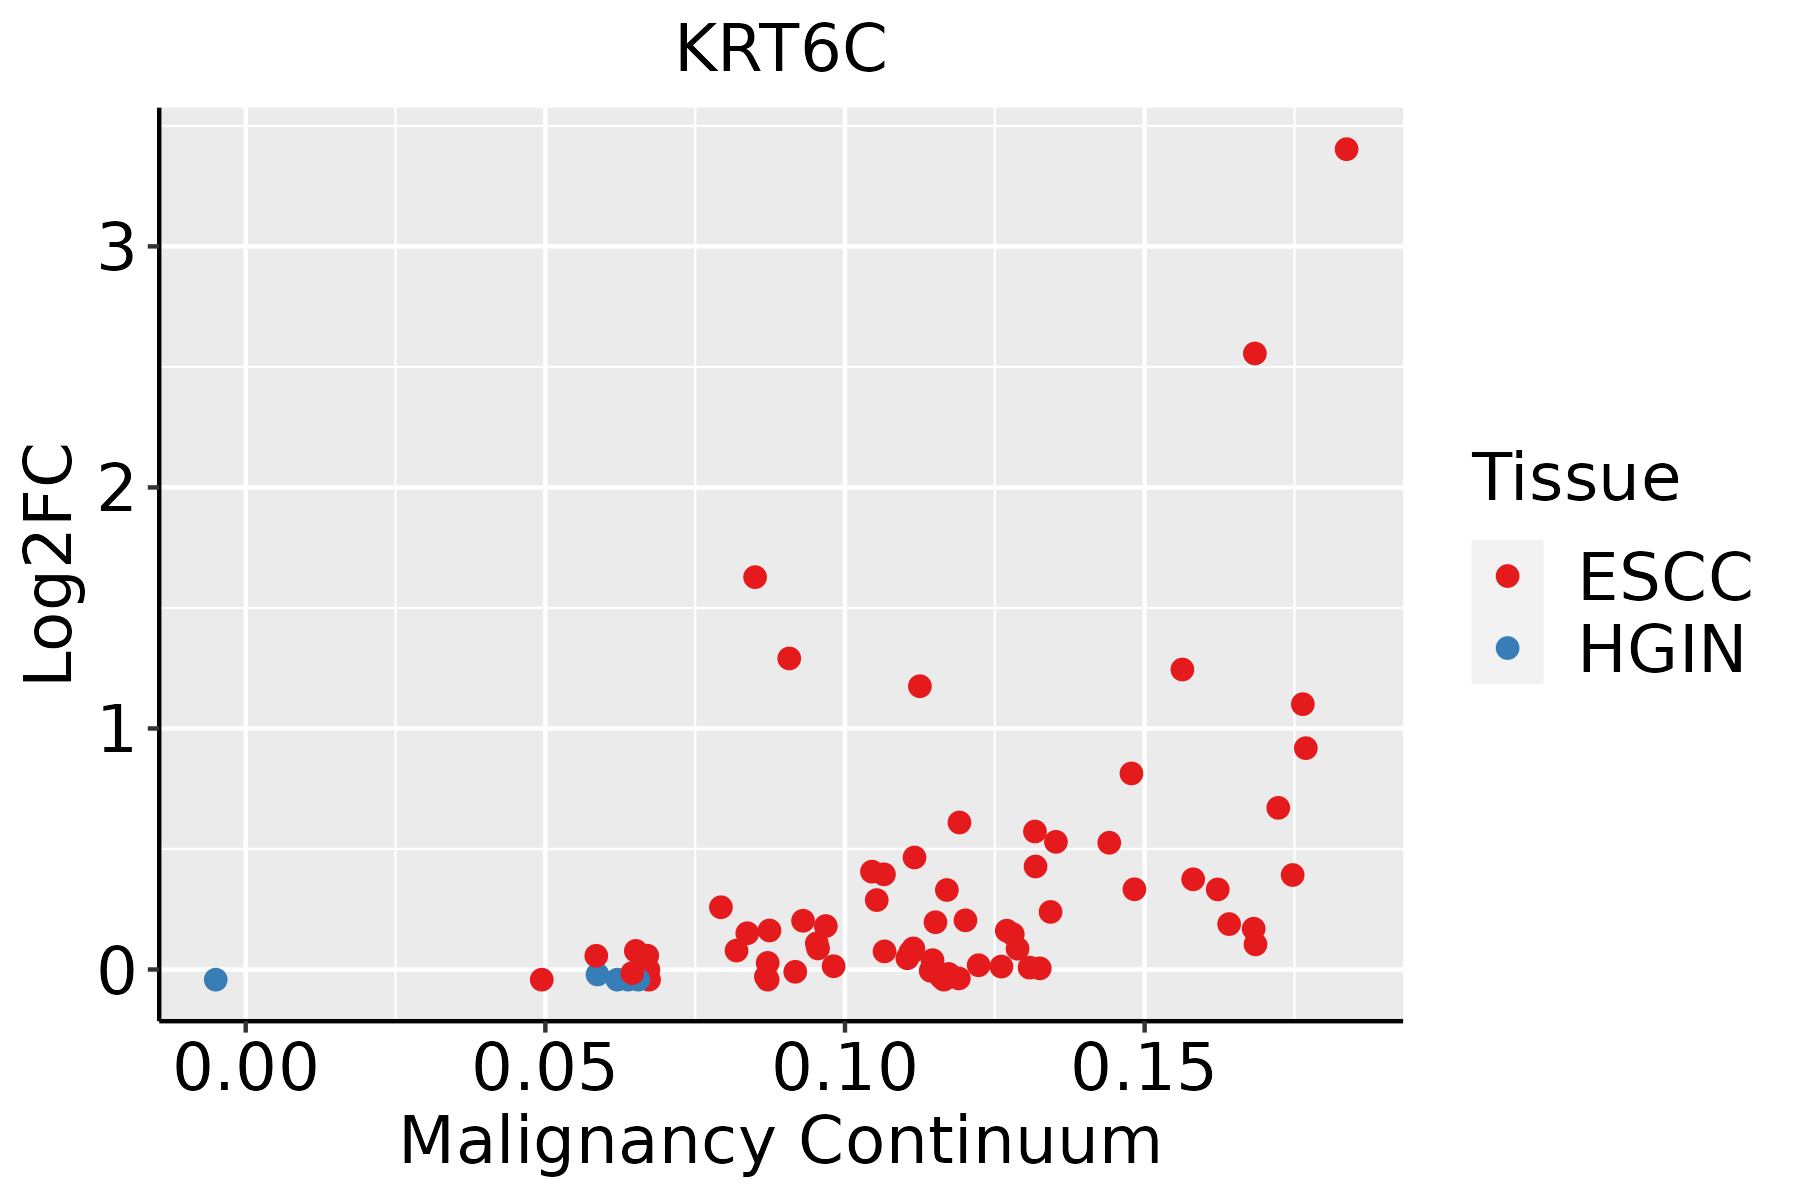 | ESCC: Esophageal squamous cell carcinoma |
| HGIN: High-grade intraepithelial neoplasias | ||
| LGIN: Low-grade intraepithelial neoplasias | ||
| Oral Cavity | 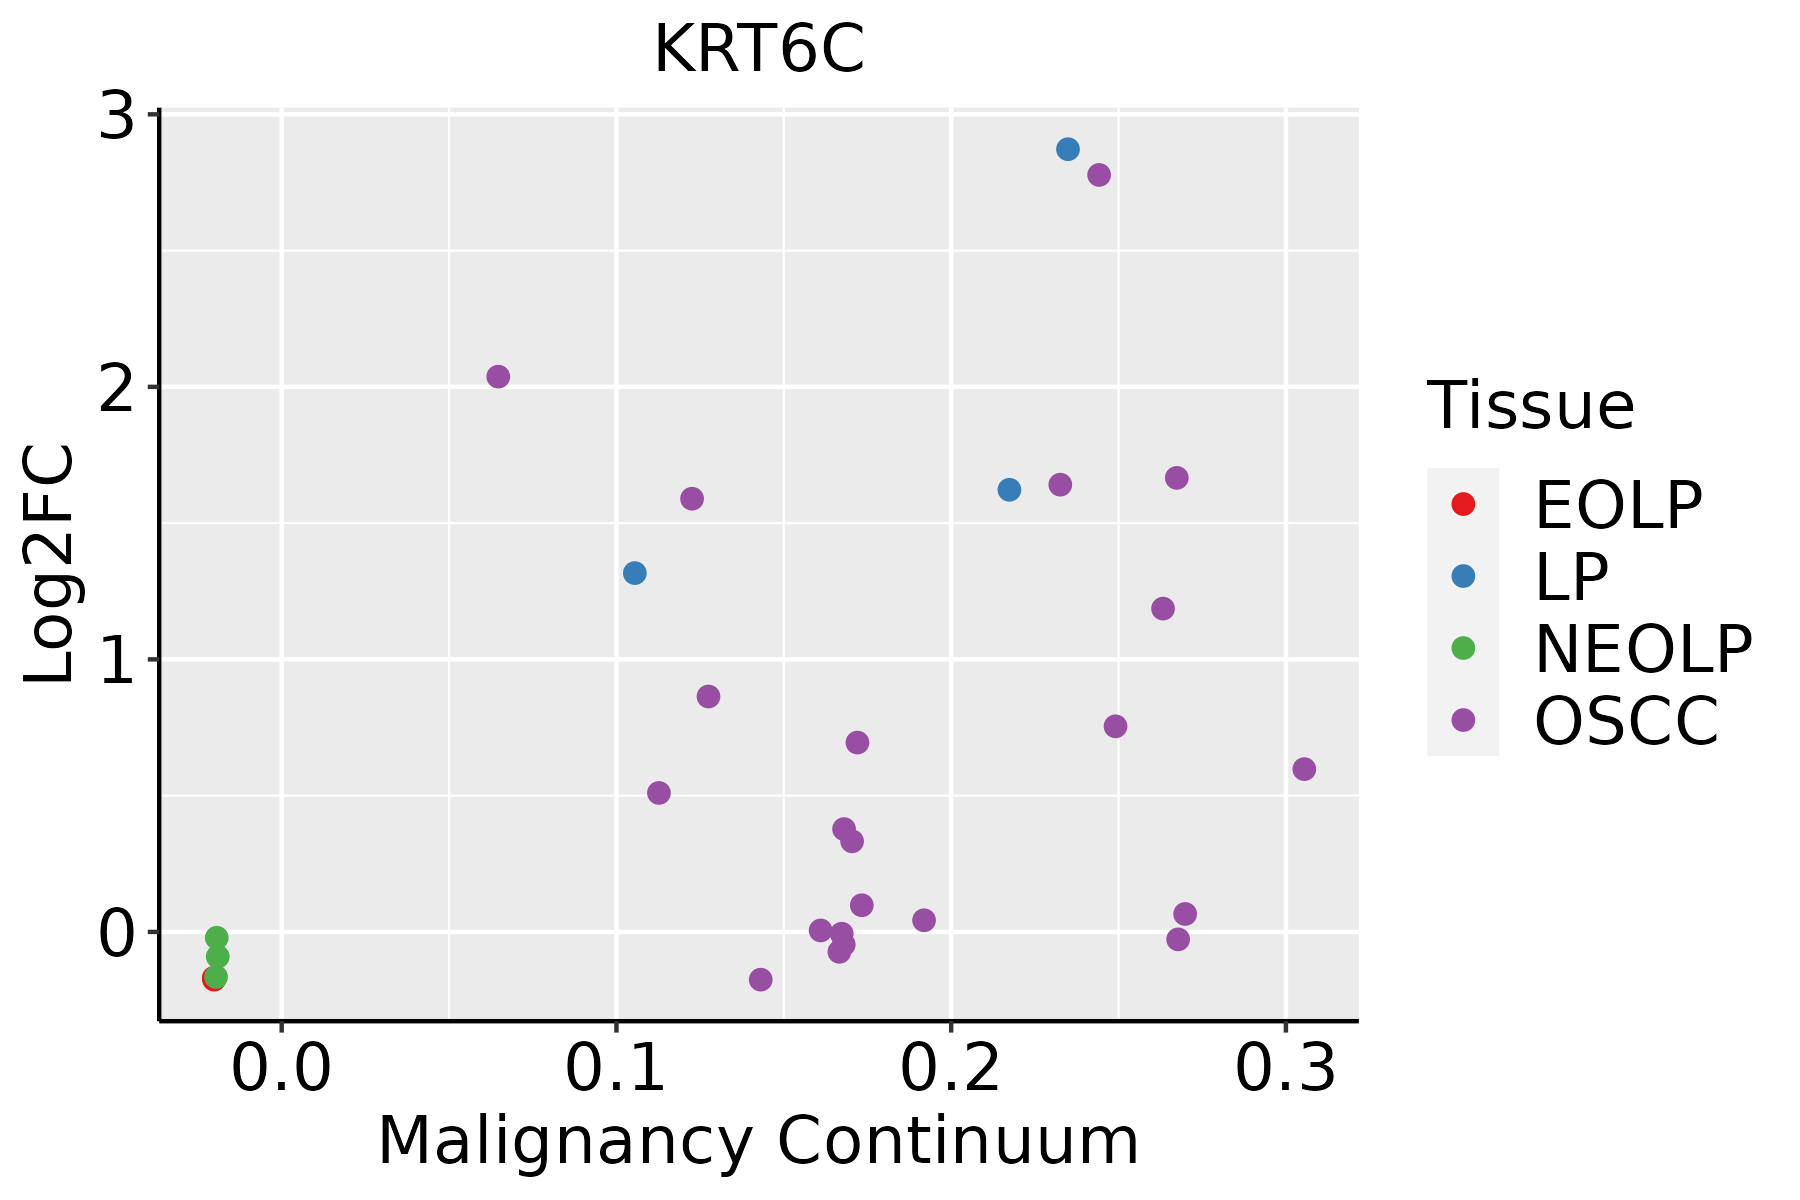 | EOLP: Erosive Oral lichen planus |
| LP: leukoplakia | ||
| NEOLP: Non-erosive oral lichen planus | ||
| OSCC: Oral squamous cell carcinoma | ||
| Skin | 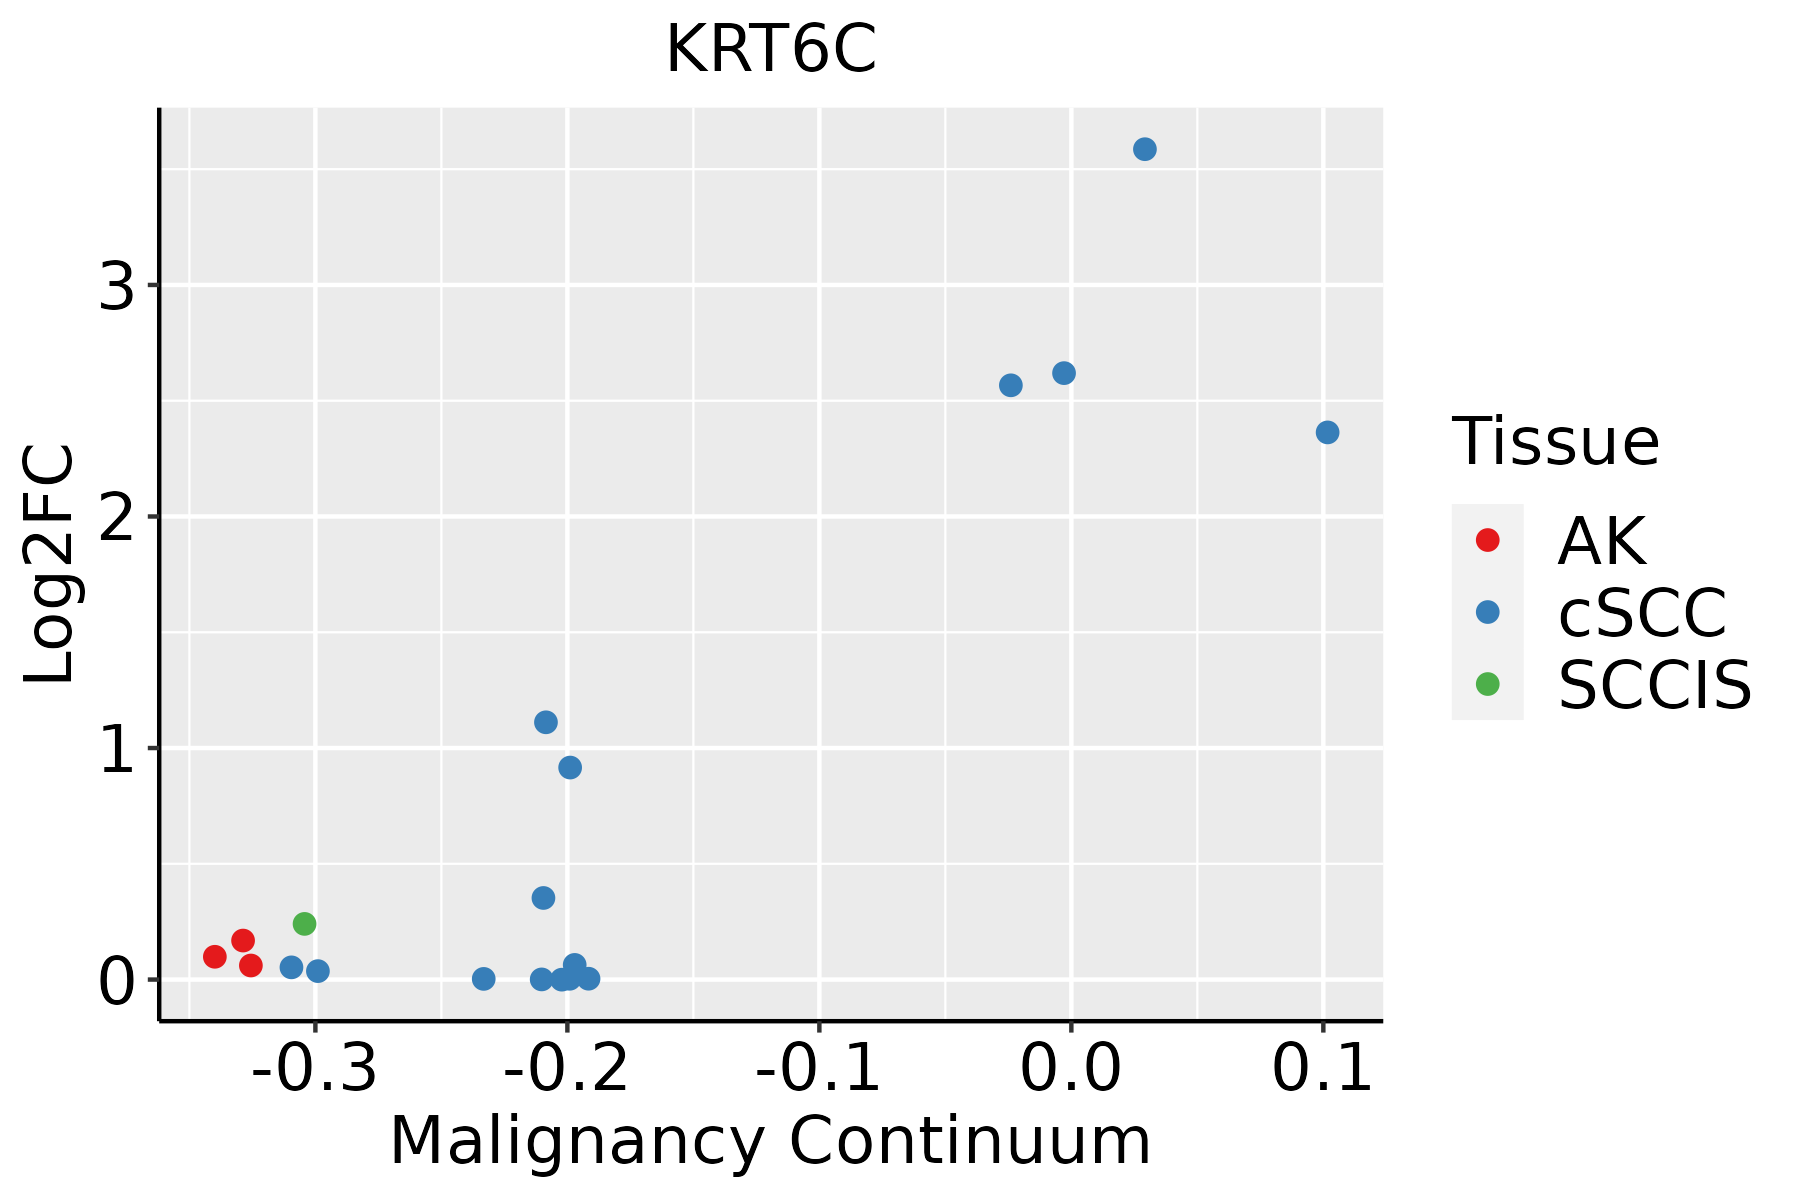 | AK: Actinic keratosis |
| cSCC: Cutaneous squamous cell carcinoma | ||
| SCCIS:squamous cell carcinoma in situ |
| ∗log2FC in expression of this searched gene in stem-like cells from each diseased tissue sample relative to stem-like cells in normal samples in each tissue plotted against the malignancy continuum. Samples are colored based on if they are from different disease stage. |
Top |
Malignant transformation related pathway analysis |
| Find out the enriched GO biological processes and KEGG pathways involved in transition from healthy to precancer to cancer |
| Tissue | Disease Stage | Enriched GO biological Processes |
| Colorectum | AD |  |
| Colorectum | SER |  |
| Colorectum | MSS |  |
| Colorectum | MSI-H |  |
| Colorectum | FAP |  |
| ∗Top 15 enriched GO BP terms are showed in the bar plot of each disease state in each tissue. Each row represents a significant GO biological process which is colored according to the -log10(p.adjust). |
| Page: 1 2 3 4 5 6 7 8 9 |
| GO ID | Tissue | Disease Stage | Description | Gene Ratio | Bg Ratio | pvalue | p.adjust | Count |
| GO:00451035 | Esophagus | ESCC | intermediate filament-based process | 32/8552 | 52/18723 | 1.55e-02 | 4.97e-02 | 32 |
| GO:00451044 | Oral cavity | OSCC | intermediate filament cytoskeleton organization | 31/7305 | 51/18723 | 1.34e-03 | 6.62e-03 | 31 |
| GO:00451034 | Oral cavity | OSCC | intermediate filament-based process | 31/7305 | 52/18723 | 2.08e-03 | 9.59e-03 | 31 |
| GO:00451045 | Skin | AK | intermediate filament cytoskeleton organization | 14/1910 | 51/18723 | 4.29e-04 | 4.05e-03 | 14 |
| GO:00451036 | Skin | AK | intermediate filament-based process | 14/1910 | 52/18723 | 5.32e-04 | 4.84e-03 | 14 |
| GO:004510413 | Skin | SCCIS | intermediate filament cytoskeleton organization | 9/919 | 51/18723 | 7.53e-04 | 1.03e-02 | 9 |
| GO:004510313 | Skin | SCCIS | intermediate filament-based process | 9/919 | 52/18723 | 8.72e-04 | 1.14e-02 | 9 |
| GO:004510423 | Skin | cSCC | intermediate filament cytoskeleton organization | 24/4864 | 51/18723 | 9.43e-04 | 6.42e-03 | 24 |
| GO:004510323 | Skin | cSCC | intermediate filament-based process | 24/4864 | 52/18723 | 1.32e-03 | 8.50e-03 | 24 |
| Page: 1 |
| Pathway ID | Tissue | Disease Stage | Description | Gene Ratio | Bg Ratio | pvalue | p.adjust | qvalue | Count |
| Page: 1 |
Top |
Cell-cell communication analysis |
| Identification of potential cell-cell interactions between two cell types and their ligand-receptor pairs for different disease states |
| Ligand | Receptor | LRpair | Pathway | Tissue | Disease Stage |
| Page: 1 |
Top |
Single-cell gene regulatory network inference analysis |
| Find out the significant the regulons (TFs) and the target genes of each regulon across cell types for different disease states |
| TF | Cell Type | Tissue | Disease Stage | Target Gene | RSS | Regulon Activity |
| ∗The dot plots of a searched regulon are shown for all cell subpopulations in each disease state of each tissue based on the regulon specific score inferred using pySCENIC and by calculating the average expression. |
| Page: 1 |
Top |
Somatic mutation of malignant transformation related genes |
| Annotation of somatic variants for genes involved in malignant transformation |
| Hugo Symbol | Variant Class | Variant Classification | dbSNP RS | HGVSc | HGVSp | HGVSp Short | SWISSPROT | BIOTYPE | SIFT | PolyPhen | Tumor Sample Barcode | Tissue | Histology | Sex | Age | Stage | Therapy Types | Drugs | Outcome |
| KRT6C | SNV | Missense_Mutation | novel | c.766G>A | p.Glu256Lys | p.E256K | P48668 | protein_coding | deleterious(0) | probably_damaging(1) | TCGA-5L-AAT1-01 | Breast | breast invasive carcinoma | Female | <65 | III/IV | Hormone Therapy | letrozol | SD |
| KRT6C | SNV | Missense_Mutation | rs746200592 | c.38N>A | p.Ser13Asn | p.S13N | P48668 | protein_coding | deleterious(0.03) | benign(0.031) | TCGA-A8-A07G-01 | Breast | breast invasive carcinoma | Female | >=65 | I/II | Chemotherapy | 5-fluorouracil | CR |
| KRT6C | SNV | Missense_Mutation | c.1447N>A | p.Gln483Lys | p.Q483K | P48668 | protein_coding | deleterious(0.03) | benign(0.01) | TCGA-A8-A09K-01 | Breast | breast invasive carcinoma | Female | >=65 | I/II | Unknown | Unknown | SD | |
| KRT6C | SNV | Missense_Mutation | novel | c.746N>A | p.Leu249His | p.L249H | P48668 | protein_coding | deleterious(0.01) | possibly_damaging(0.767) | TCGA-VS-A8EJ-01 | Cervix | cervical & endocervical cancer | Female | <65 | I/II | Chemotherapy | cisplatin | PD |
| KRT6C | SNV | Missense_Mutation | novel | c.1099N>A | p.Ala367Thr | p.A367T | P48668 | protein_coding | deleterious(0) | probably_damaging(0.997) | TCGA-5M-AAT6-01 | Colorectum | colon adenocarcinoma | Female | <65 | III/IV | Unknown | Unknown | PD |
| KRT6C | SNV | Missense_Mutation | rs541854809 | c.118C>T | p.Arg40Cys | p.R40C | P48668 | protein_coding | tolerated(0.07) | probably_damaging(0.958) | TCGA-A6-2680-01 | Colorectum | colon adenocarcinoma | Female | >=65 | I/II | Unknown | Unknown | SD |
| KRT6C | SNV | Missense_Mutation | rs779662593 | c.700N>T | p.Arg234Cys | p.R234C | P48668 | protein_coding | deleterious(0) | benign(0.398) | TCGA-A6-2686-01 | Colorectum | colon adenocarcinoma | Female | >=65 | I/II | Unknown | Unknown | SD |
| KRT6C | SNV | Missense_Mutation | rs771618302 | c.694C>T | p.Arg232Trp | p.R232W | P48668 | protein_coding | deleterious(0) | probably_damaging(0.999) | TCGA-AA-3492-01 | Colorectum | colon adenocarcinoma | Female | >=65 | I/II | Unknown | Unknown | SD |
| KRT6C | SNV | Missense_Mutation | novel | c.1663T>A | p.Ser555Thr | p.S555T | P48668 | protein_coding | tolerated(1) | benign(0) | TCGA-AA-3845-01 | Colorectum | colon adenocarcinoma | Female | >=65 | I/II | Unknown | Unknown | PD |
| KRT6C | SNV | Missense_Mutation | novel | c.676N>A | p.Asp226Asn | p.D226N | P48668 | protein_coding | tolerated(0.12) | benign(0.434) | TCGA-AA-3877-01 | Colorectum | colon adenocarcinoma | Female | >=65 | I/II | Unknown | Unknown | SD |
| Page: 1 2 3 4 5 6 7 |
Top |
Related drugs of malignant transformation related genes |
| Identification of chemicals and drugs interact with genes involved in malignant transfromation |
| (DGIdb 4.0) |
| Entrez ID | Symbol | Category | Interaction Types | Drug Claim Name | Drug Name | PMIDs |
| Page: 1 |

Copyright 2023-Present -The University of Texas Health Science Center at Houston |