
|
|||||
|
 | |
| |
| |
| |
| |
| |
|
Gene: KRT6B |
Gene summary for KRT6B |
| Gene information | Species | Human | Gene symbol | KRT6B | Gene ID | 3854 |
| Gene name | keratin 6B | |
| Gene Alias | CK-6B | |
| Cytomap | 12q13.13 | |
| Gene Type | protein-coding | GO ID | GO:0006996 | UniProtAcc | P04259 |
Top |
Malignant transformation analysis |
| Identification of the aberrant gene expression in precancerous and cancerous lesions by comparing the gene expression of stem-like cells in diseased tissues with normal stem cells |
| Entrez ID | Symbol | Replicates | Species | Organ | Tissue | Adj P-value | Log2FC | Malignancy |
| 3854 | KRT6B | GSM4909281 | Human | Breast | IDC | 1.31e-05 | -3.11e-01 | 0.21 |
| 3854 | KRT6B | GSM4909282 | Human | Breast | IDC | 4.07e-63 | 1.11e+00 | -0.0288 |
| 3854 | KRT6B | GSM4909285 | Human | Breast | IDC | 2.48e-39 | 8.07e-01 | 0.21 |
| 3854 | KRT6B | GSM4909286 | Human | Breast | IDC | 4.80e-16 | -3.97e-01 | 0.1081 |
| 3854 | KRT6B | GSM4909287 | Human | Breast | IDC | 1.65e-02 | -2.64e-01 | 0.2057 |
| 3854 | KRT6B | GSM4909290 | Human | Breast | IDC | 7.88e-13 | -3.97e-01 | 0.2096 |
| 3854 | KRT6B | GSM4909291 | Human | Breast | IDC | 2.70e-10 | -3.97e-01 | 0.1753 |
| 3854 | KRT6B | GSM4909293 | Human | Breast | IDC | 5.04e-08 | -3.32e-01 | 0.1581 |
| 3854 | KRT6B | GSM4909294 | Human | Breast | IDC | 4.81e-09 | -3.32e-01 | 0.2022 |
| 3854 | KRT6B | GSM4909296 | Human | Breast | IDC | 2.88e-12 | -3.79e-01 | 0.1524 |
| 3854 | KRT6B | GSM4909297 | Human | Breast | IDC | 2.52e-11 | -3.70e-01 | 0.1517 |
| 3854 | KRT6B | GSM4909298 | Human | Breast | IDC | 4.16e-08 | -3.67e-01 | 0.1551 |
| 3854 | KRT6B | GSM4909300 | Human | Breast | IDC | 2.24e-06 | 6.36e-01 | 0.0334 |
| 3854 | KRT6B | GSM4909301 | Human | Breast | IDC | 5.48e-15 | -3.97e-01 | 0.1577 |
| 3854 | KRT6B | GSM4909302 | Human | Breast | IDC | 8.97e-14 | -3.78e-01 | 0.1545 |
| 3854 | KRT6B | GSM4909304 | Human | Breast | IDC | 4.80e-16 | -3.96e-01 | 0.1636 |
| 3854 | KRT6B | GSM4909307 | Human | Breast | IDC | 5.06e-03 | -2.89e-01 | 0.1569 |
| 3854 | KRT6B | GSM4909308 | Human | Breast | IDC | 7.41e-16 | -3.97e-01 | 0.158 |
| 3854 | KRT6B | GSM4909311 | Human | Breast | IDC | 2.26e-07 | -2.24e-01 | 0.1534 |
| 3854 | KRT6B | GSM4909312 | Human | Breast | IDC | 2.44e-15 | -3.97e-01 | 0.1552 |
| Page: 1 2 3 4 5 6 |
| Tissue | Expression Dynamics | Abbreviation |
| Breast |  | IDC: Invasive ductal carcinoma |
| DCIS: Ductal carcinoma in situ | ||
| Precancer(BRCA1-mut): Precancerous lesion from BRCA1 mutation carriers | ||
| Cervix | 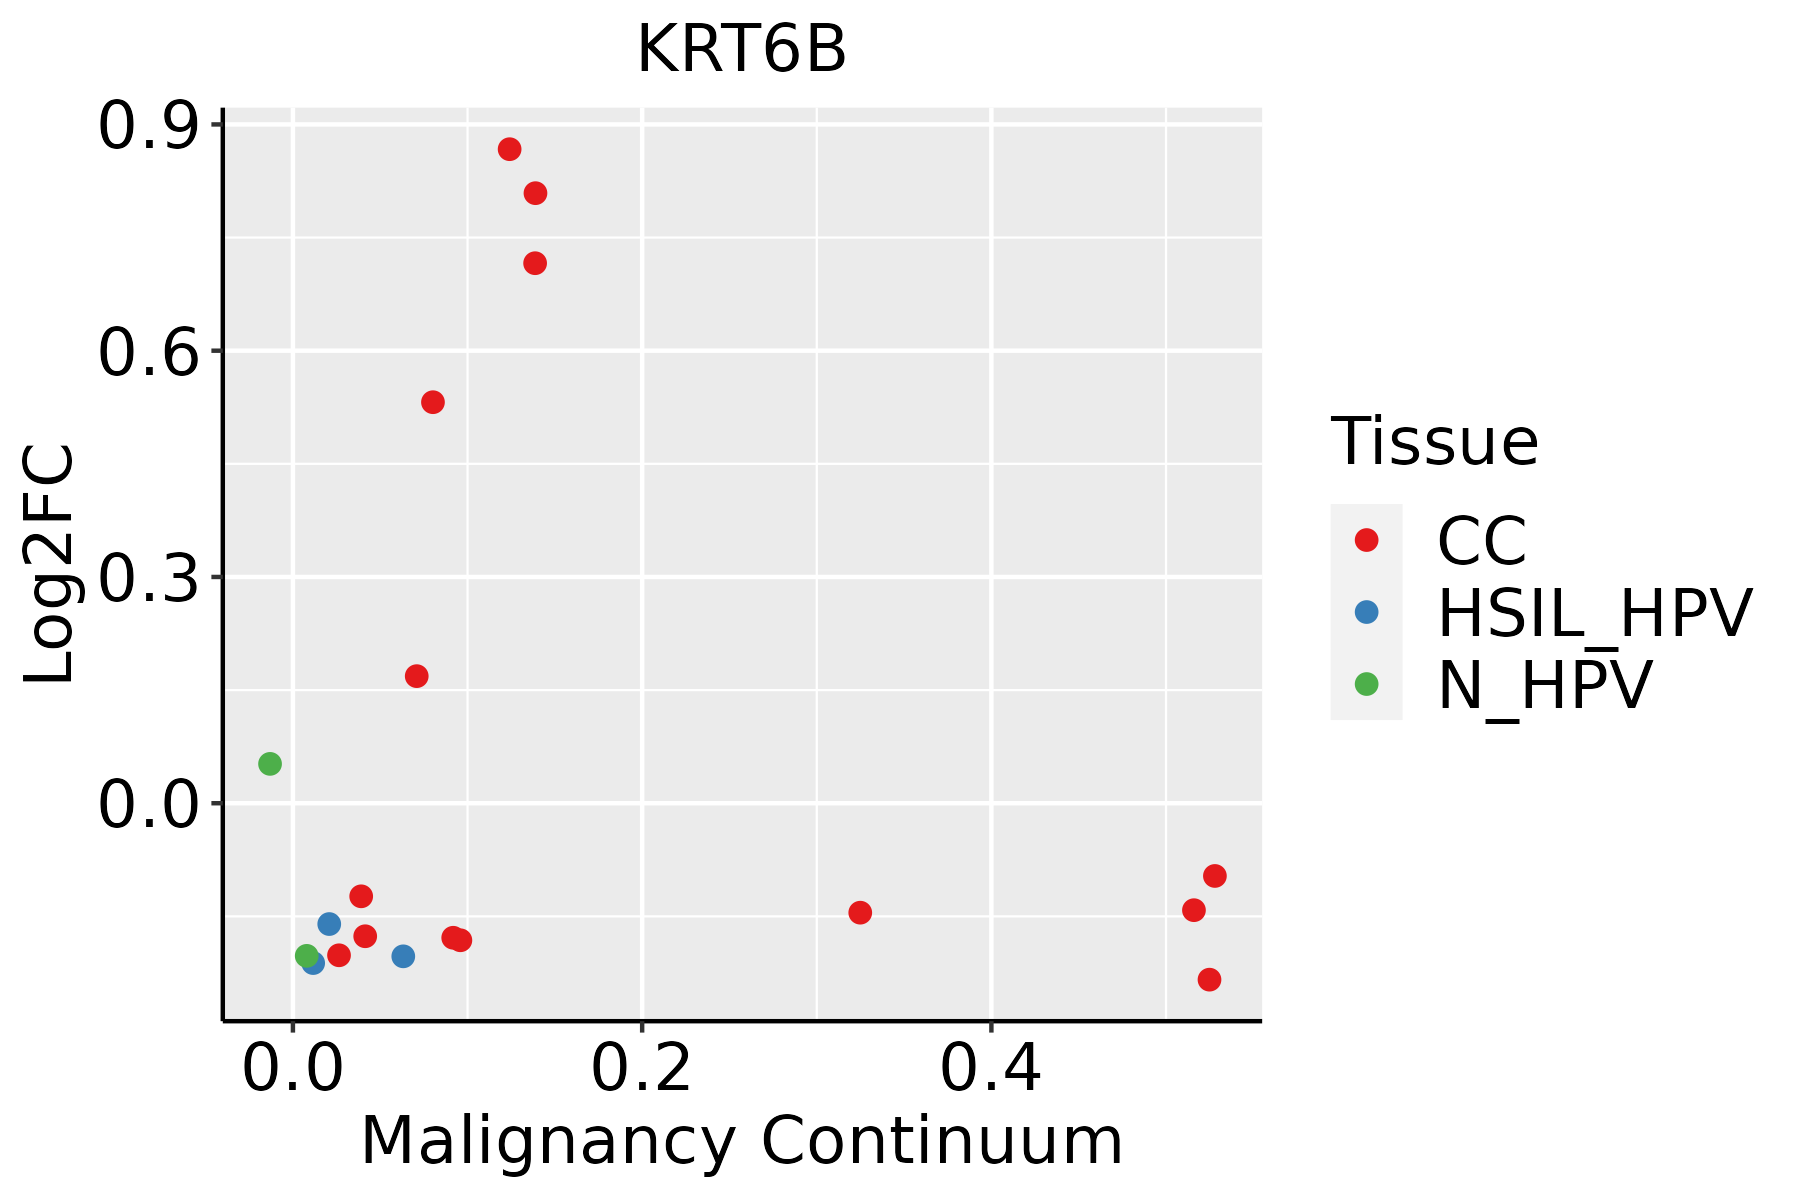 | CC: Cervix cancer |
| HSIL_HPV: HPV-infected high-grade squamous intraepithelial lesions | ||
| N_HPV: HPV-infected normal cervix | ||
| Esophagus |  | ESCC: Esophageal squamous cell carcinoma |
| HGIN: High-grade intraepithelial neoplasias | ||
| LGIN: Low-grade intraepithelial neoplasias | ||
| Oral Cavity |  | EOLP: Erosive Oral lichen planus |
| LP: leukoplakia | ||
| NEOLP: Non-erosive oral lichen planus | ||
| OSCC: Oral squamous cell carcinoma | ||
| Skin | 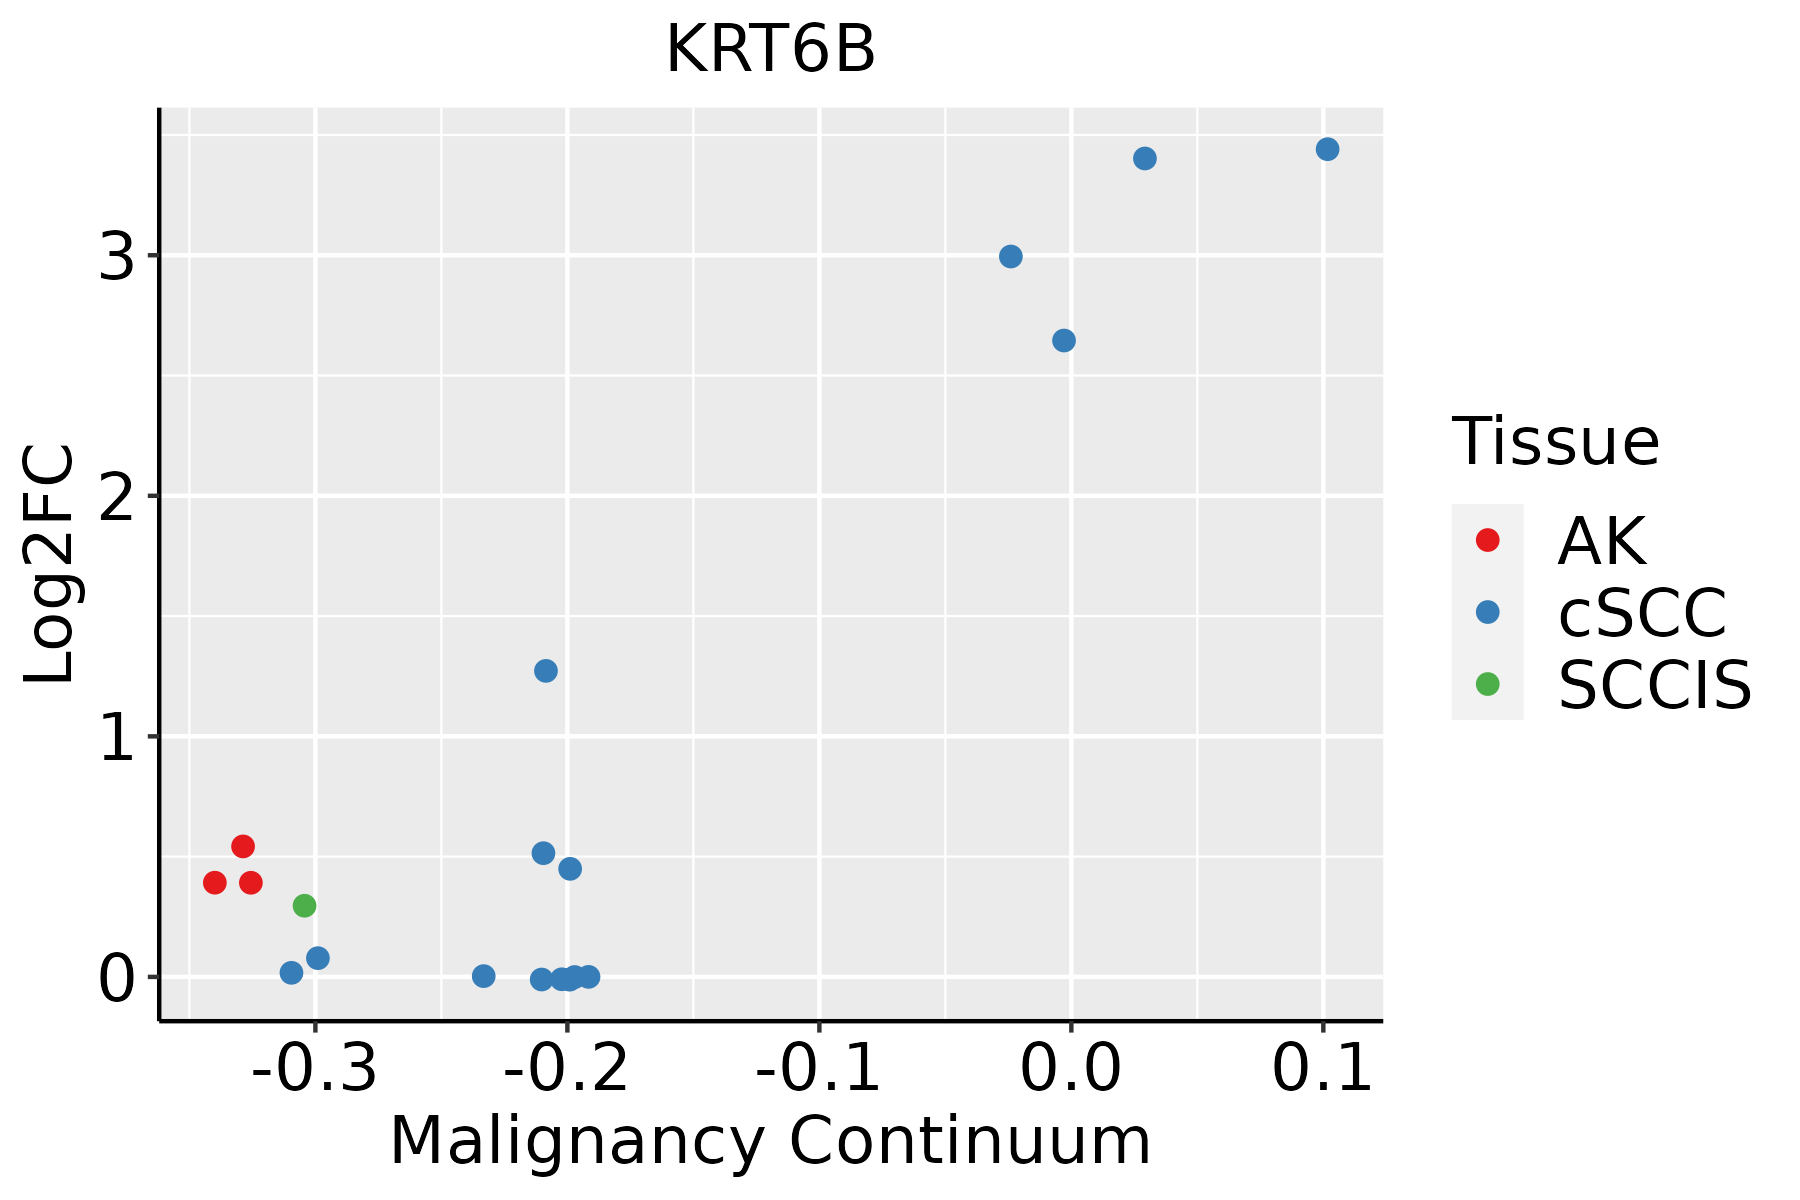 | AK: Actinic keratosis |
| cSCC: Cutaneous squamous cell carcinoma | ||
| SCCIS:squamous cell carcinoma in situ |
| ∗log2FC in expression of this searched gene in stem-like cells from each diseased tissue sample relative to stem-like cells in normal samples in each tissue plotted against the malignancy continuum. Samples are colored based on if they are from different disease stage. |
Top |
Malignant transformation related pathway analysis |
| Find out the enriched GO biological processes and KEGG pathways involved in transition from healthy to precancer to cancer |
| Tissue | Disease Stage | Enriched GO biological Processes |
| Colorectum | AD |  |
| Colorectum | SER |  |
| Colorectum | MSS |  |
| Colorectum | MSI-H |  |
| Colorectum | FAP |  |
| ∗Top 15 enriched GO BP terms are showed in the bar plot of each disease state in each tissue. Each row represents a significant GO biological process which is colored according to the -log10(p.adjust). |
| Page: 1 2 3 4 5 6 7 8 9 |
| GO ID | Tissue | Disease Stage | Description | Gene Ratio | Bg Ratio | pvalue | p.adjust | Count |
| GO:0007398 | Skin | AK | ectoderm development | 7/1910 | 22/18723 | 4.88e-03 | 2.77e-02 | 7 |
| GO:00073981 | Skin | SCCIS | ectoderm development | 5/919 | 22/18723 | 3.69e-03 | 3.22e-02 | 5 |
| Page: 1 |
| Pathway ID | Tissue | Disease Stage | Description | Gene Ratio | Bg Ratio | pvalue | p.adjust | qvalue | Count |
| Page: 1 |
Top |
Cell-cell communication analysis |
| Identification of potential cell-cell interactions between two cell types and their ligand-receptor pairs for different disease states |
| Ligand | Receptor | LRpair | Pathway | Tissue | Disease Stage |
| Page: 1 |
Top |
Single-cell gene regulatory network inference analysis |
| Find out the significant the regulons (TFs) and the target genes of each regulon across cell types for different disease states |
| TF | Cell Type | Tissue | Disease Stage | Target Gene | RSS | Regulon Activity |
| ∗The dot plots of a searched regulon are shown for all cell subpopulations in each disease state of each tissue based on the regulon specific score inferred using pySCENIC and by calculating the average expression. |
| Page: 1 |
Top |
Somatic mutation of malignant transformation related genes |
| Annotation of somatic variants for genes involved in malignant transformation |
| Hugo Symbol | Variant Class | Variant Classification | dbSNP RS | HGVSc | HGVSp | HGVSp Short | SWISSPROT | BIOTYPE | SIFT | PolyPhen | Tumor Sample Barcode | Tissue | Histology | Sex | Age | Stage | Therapy Types | Drugs | Outcome |
| KRT6B | SNV | Missense_Mutation | novel | c.706G>C | p.Asp236His | p.D236H | P04259 | protein_coding | deleterious(0) | possibly_damaging(0.519) | TCGA-5L-AAT1-01 | Breast | breast invasive carcinoma | Female | <65 | III/IV | Hormone Therapy | letrozol | SD |
| KRT6B | SNV | Missense_Mutation | rs374275504 | c.89N>A | p.Arg30His | p.R30H | P04259 | protein_coding | tolerated(0.17) | benign(0) | TCGA-AN-A0FZ-01 | Breast | breast invasive carcinoma | Female | <65 | III/IV | Unknown | Unknown | SD |
| KRT6B | SNV | Missense_Mutation | rs769168555 | c.286G>A | p.Ala96Thr | p.A96T | P04259 | protein_coding | tolerated(0.06) | benign(0.028) | TCGA-AQ-A1H2-01 | Breast | breast invasive carcinoma | Female | >=65 | III/IV | Chemotherapy | herceptin | SD |
| KRT6B | SNV | Missense_Mutation | novel | c.92N>G | p.Ser31Cys | p.S31C | P04259 | protein_coding | deleterious(0.01) | possibly_damaging(0.536) | TCGA-BH-A2L8-01 | Breast | breast invasive carcinoma | Female | <65 | I/II | Chemotherapy | cytoxan | CR |
| KRT6B | SNV | Missense_Mutation | rs749339703 | c.1328N>A | p.Arg443Gln | p.R443Q | P04259 | protein_coding | tolerated(0.06) | possibly_damaging(0.786) | TCGA-C8-A8HR-01 | Breast | breast invasive carcinoma | Female | <65 | III/IV | Chemotherapy | 5-fluorouracil | CR |
| KRT6B | SNV | Missense_Mutation | rs756538750 | c.701N>A | p.Arg234His | p.R234H | P04259 | protein_coding | deleterious(0.05) | benign(0.315) | TCGA-D8-A1XM-01 | Breast | breast invasive carcinoma | Female | <65 | I/II | Unknown | Unknown | SD |
| KRT6B | SNV | Missense_Mutation | c.1057G>C | p.Glu353Gln | p.E353Q | P04259 | protein_coding | deleterious(0) | possibly_damaging(0.893) | TCGA-C5-A1M6-01 | Cervix | cervical & endocervical cancer | Female | <65 | I/II | Chemotherapy | cisplatin | PD | |
| KRT6B | SNV | Missense_Mutation | rs767365375 | c.1586N>T | p.Ser529Phe | p.S529F | P04259 | protein_coding | tolerated(0.19) | benign(0) | TCGA-DG-A2KM-01 | Cervix | cervical & endocervical cancer | Female | <65 | I/II | Chemotherapy | cisplatin | SD |
| KRT6B | SNV | Missense_Mutation | novel | c.257N>C | p.Arg86Thr | p.R86T | P04259 | protein_coding | tolerated(0.12) | benign(0.058) | TCGA-DS-A1OC-01 | Cervix | cervical & endocervical cancer | Female | <65 | I/II | Chemotherapy | gemcitabine | SD |
| KRT6B | SNV | Missense_Mutation | c.1318N>C | p.Asp440His | p.D440H | P04259 | protein_coding | deleterious(0.02) | probably_damaging(0.995) | TCGA-EA-A44S-01 | Cervix | cervical & endocervical cancer | Female | <65 | III/IV | Chemotherapy | carboplatin | SD |
| Page: 1 2 3 4 5 6 7 8 |
Top |
Related drugs of malignant transformation related genes |
| Identification of chemicals and drugs interact with genes involved in malignant transfromation |
| (DGIdb 4.0) |
| Entrez ID | Symbol | Category | Interaction Types | Drug Claim Name | Drug Name | PMIDs |
| Page: 1 |

Copyright 2023-Present -The University of Texas Health Science Center at Houston |