
|
|||||
|
 | |
| |
| |
| |
| |
| |
|
Gene: KRT6A |
Gene summary for KRT6A |
| Gene information | Species | Human | Gene symbol | KRT6A | Gene ID | 3853 |
| Gene name | keratin 6A | |
| Gene Alias | CK-6C | |
| Cytomap | 12q13.13 | |
| Gene Type | protein-coding | GO ID | GO:0001897 | UniProtAcc | A0A0S2Z428 |
Top |
Malignant transformation analysis |
| Identification of the aberrant gene expression in precancerous and cancerous lesions by comparing the gene expression of stem-like cells in diseased tissues with normal stem cells |
| Entrez ID | Symbol | Replicates | Species | Organ | Tissue | Adj P-value | Log2FC | Malignancy |
| 3853 | KRT6A | CA_HPV_1 | Human | Cervix | CC | 1.14e-36 | -7.68e-01 | 0.0264 |
| 3853 | KRT6A | HSIL_HPV_1 | Human | Cervix | HSIL_HPV | 2.47e-22 | -7.24e-01 | 0.0116 |
| 3853 | KRT6A | HSIL_HPV_2 | Human | Cervix | HSIL_HPV | 1.03e-29 | -7.82e-01 | 0.0208 |
| 3853 | KRT6A | N_HPV_1 | Human | Cervix | N_HPV | 4.25e-16 | -6.31e-01 | 0.0079 |
| 3853 | KRT6A | N_HPV_2 | Human | Cervix | N_HPV | 2.93e-11 | 3.51e-01 | -0.0131 |
| 3853 | KRT6A | CCI_2 | Human | Cervix | CC | 1.37e-03 | 1.25e+00 | 0.5249 |
| 3853 | KRT6A | CCI_3 | Human | Cervix | CC | 1.62e-02 | 1.03e+00 | 0.516 |
| 3853 | KRT6A | Tumor | Human | Cervix | CC | 1.02e-113 | 1.34e+00 | 0.1241 |
| 3853 | KRT6A | sample3 | Human | Cervix | CC | 4.06e-94 | 1.25e+00 | 0.1387 |
| 3853 | KRT6A | H2 | Human | Cervix | HSIL_HPV | 1.28e-05 | -3.60e-01 | 0.0632 |
| 3853 | KRT6A | L1 | Human | Cervix | CC | 2.24e-03 | 4.64e-01 | 0.0802 |
| 3853 | KRT6A | T3 | Human | Cervix | CC | 6.77e-103 | 1.27e+00 | 0.1389 |
| 3853 | KRT6A | LZE11D | Human | Esophagus | HGIN | 2.57e-03 | 6.54e-02 | -0.005 |
| 3853 | KRT6A | LZE2T | Human | Esophagus | ESCC | 2.97e-13 | 2.83e+00 | 0.082 |
| 3853 | KRT6A | LZE3D | Human | Esophagus | HGIN | 1.01e-09 | 2.01e+00 | 0.0668 |
| 3853 | KRT6A | LZE4T | Human | Esophagus | ESCC | 7.90e-47 | 3.54e+00 | 0.0811 |
| 3853 | KRT6A | LZE7T | Human | Esophagus | ESCC | 6.26e-20 | 3.71e+00 | 0.0667 |
| 3853 | KRT6A | LZE8T | Human | Esophagus | ESCC | 8.73e-09 | 2.14e+00 | 0.067 |
| 3853 | KRT6A | LZE20T | Human | Esophagus | ESCC | 2.29e-27 | 3.04e+00 | 0.0662 |
| 3853 | KRT6A | LZE21D1 | Human | Esophagus | HGIN | 8.54e-05 | 1.27e+00 | 0.0632 |
| Page: 1 2 3 4 5 6 |
| Tissue | Expression Dynamics | Abbreviation |
| Cervix | 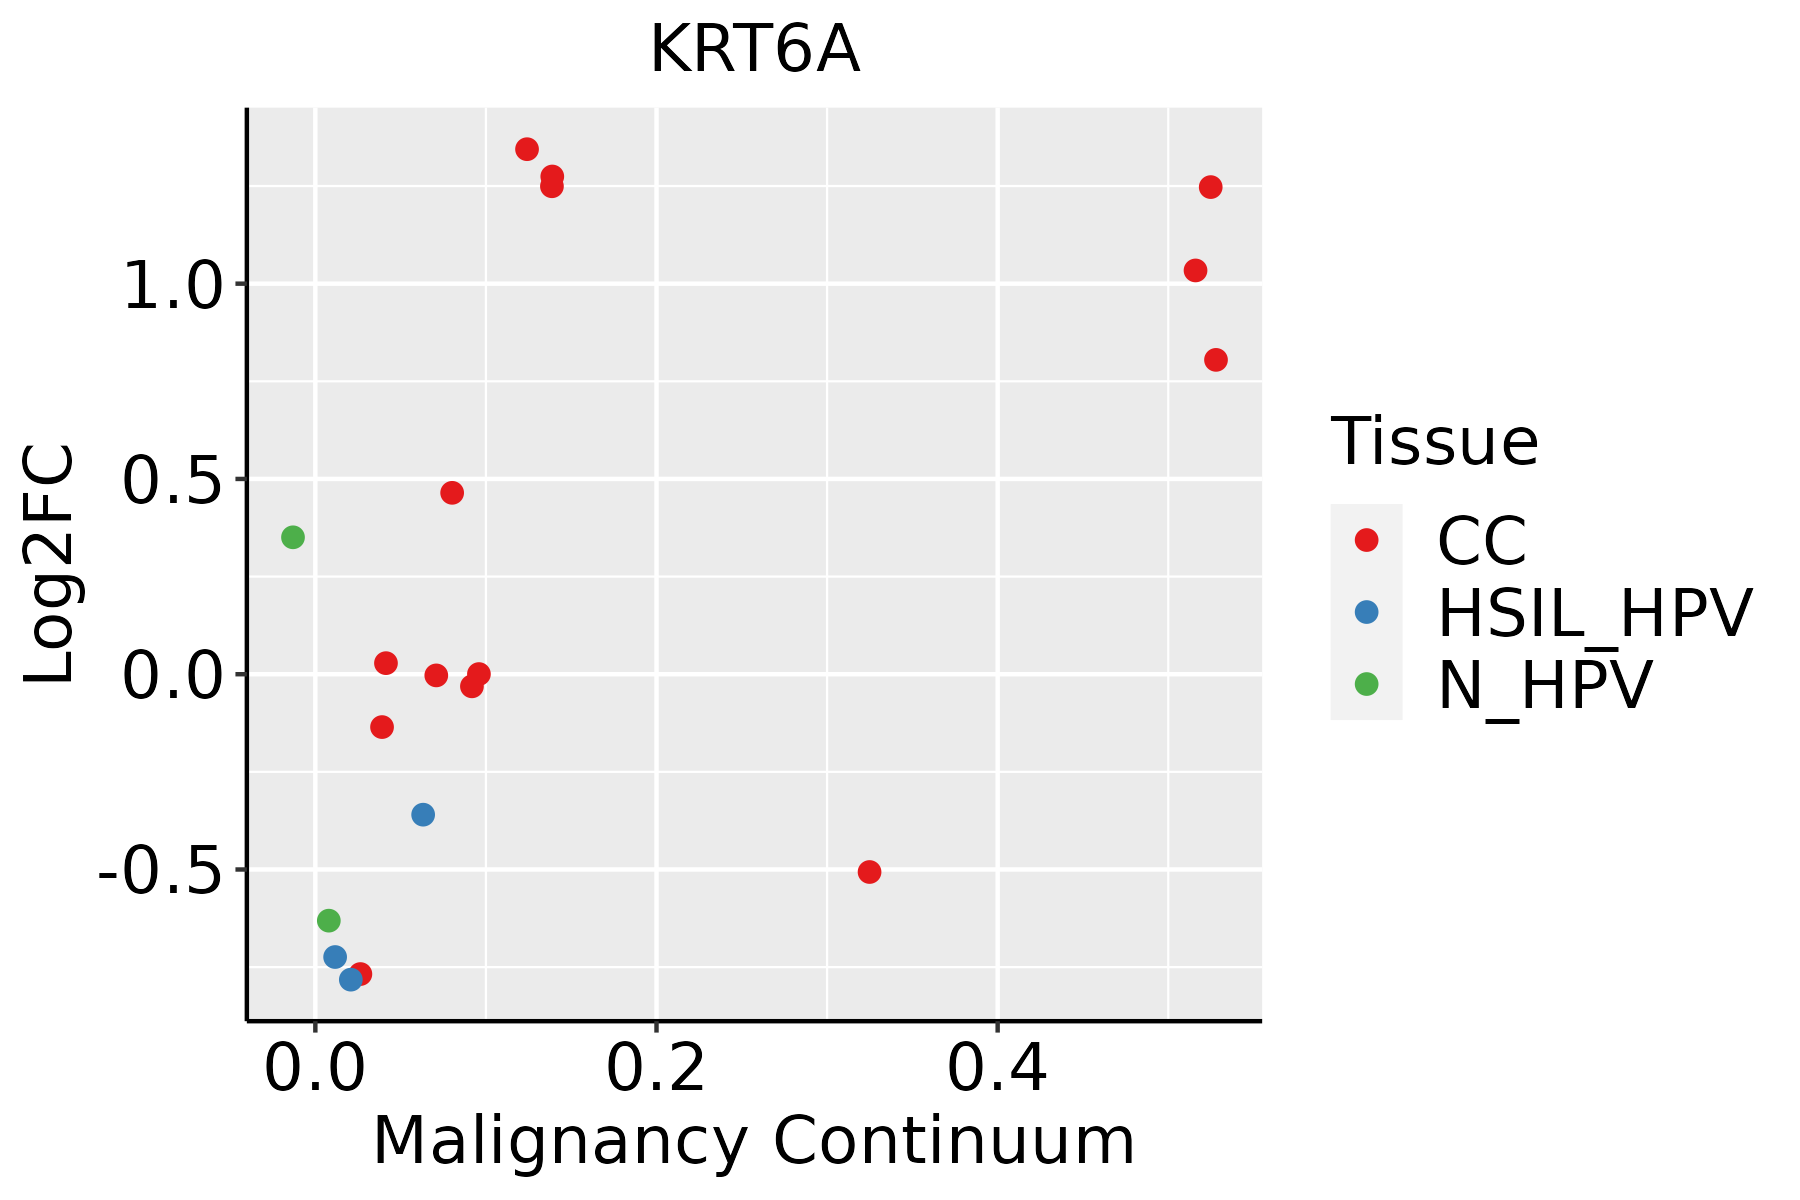 | CC: Cervix cancer |
| HSIL_HPV: HPV-infected high-grade squamous intraepithelial lesions | ||
| N_HPV: HPV-infected normal cervix | ||
| Esophagus | 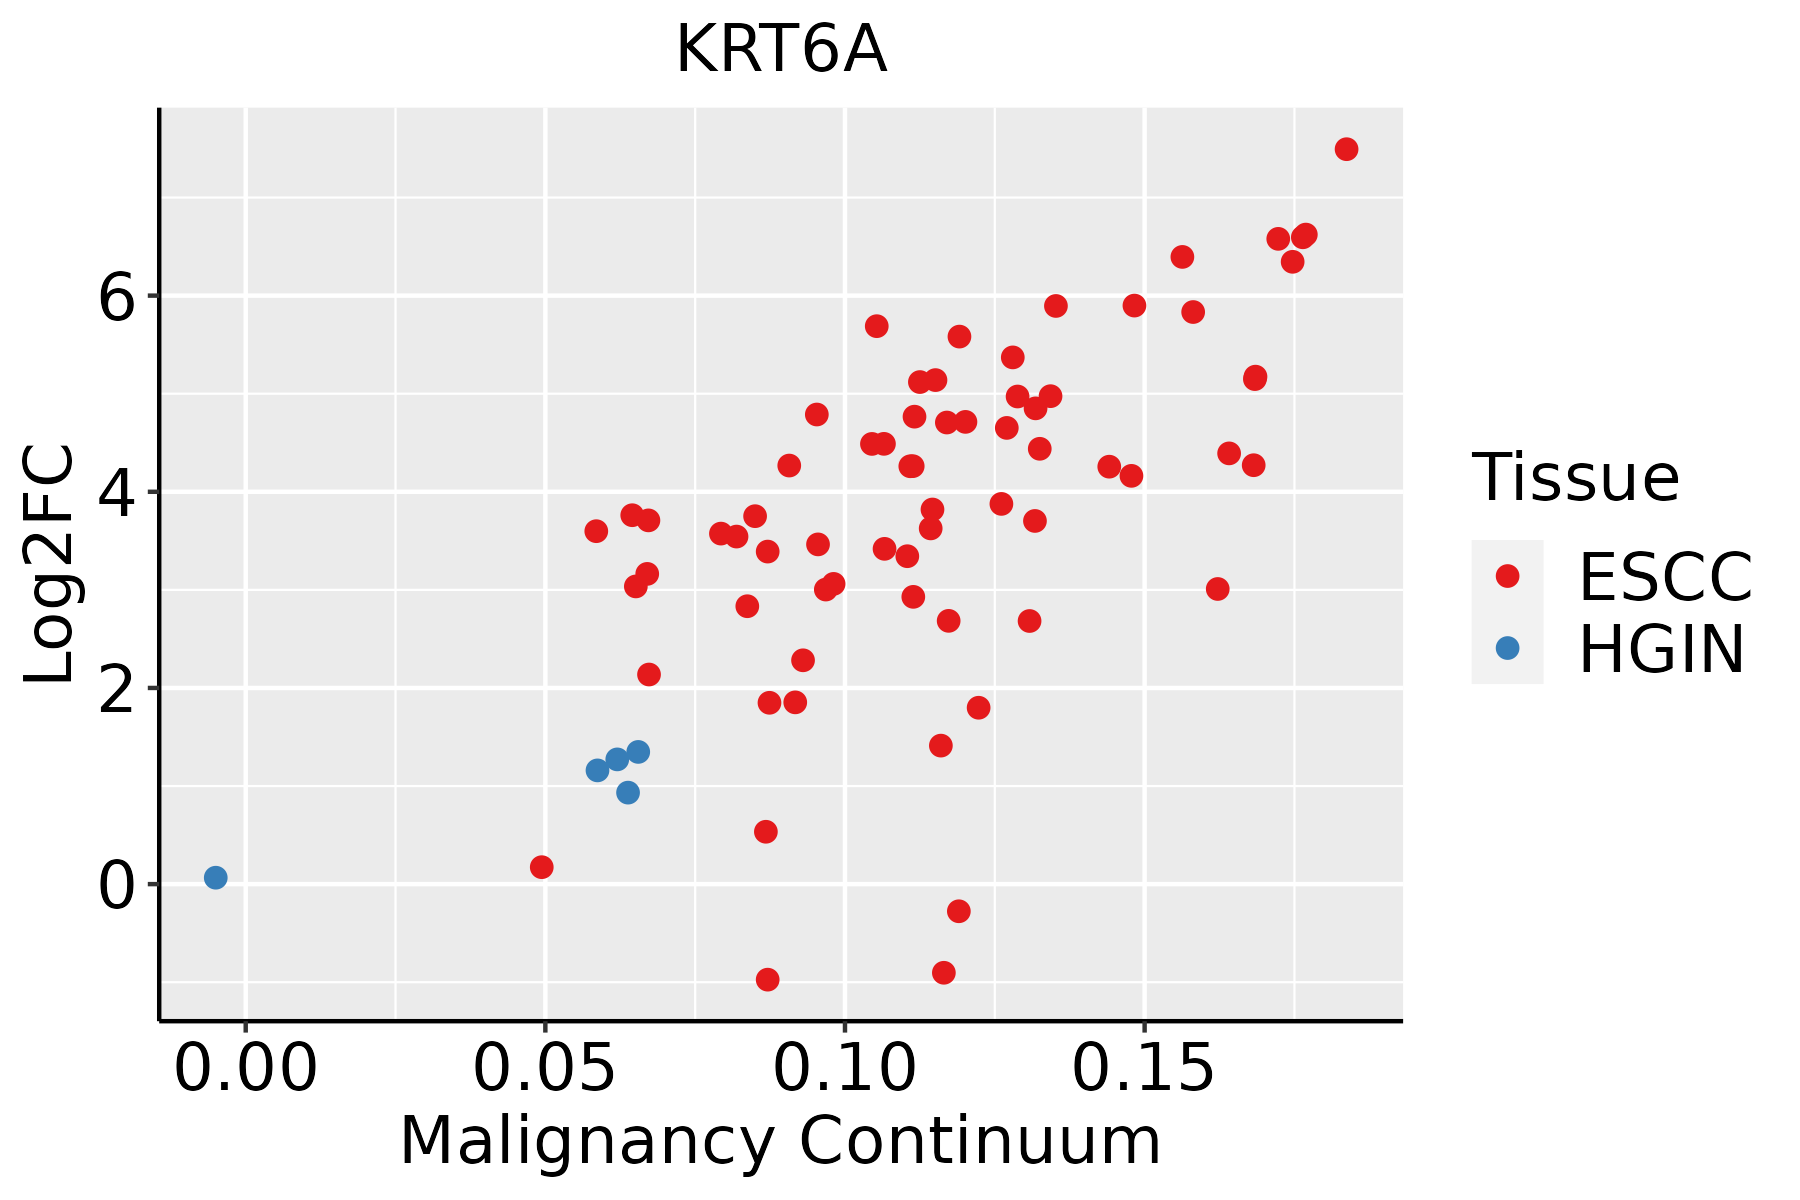 | ESCC: Esophageal squamous cell carcinoma |
| HGIN: High-grade intraepithelial neoplasias | ||
| LGIN: Low-grade intraepithelial neoplasias | ||
| Oral Cavity | 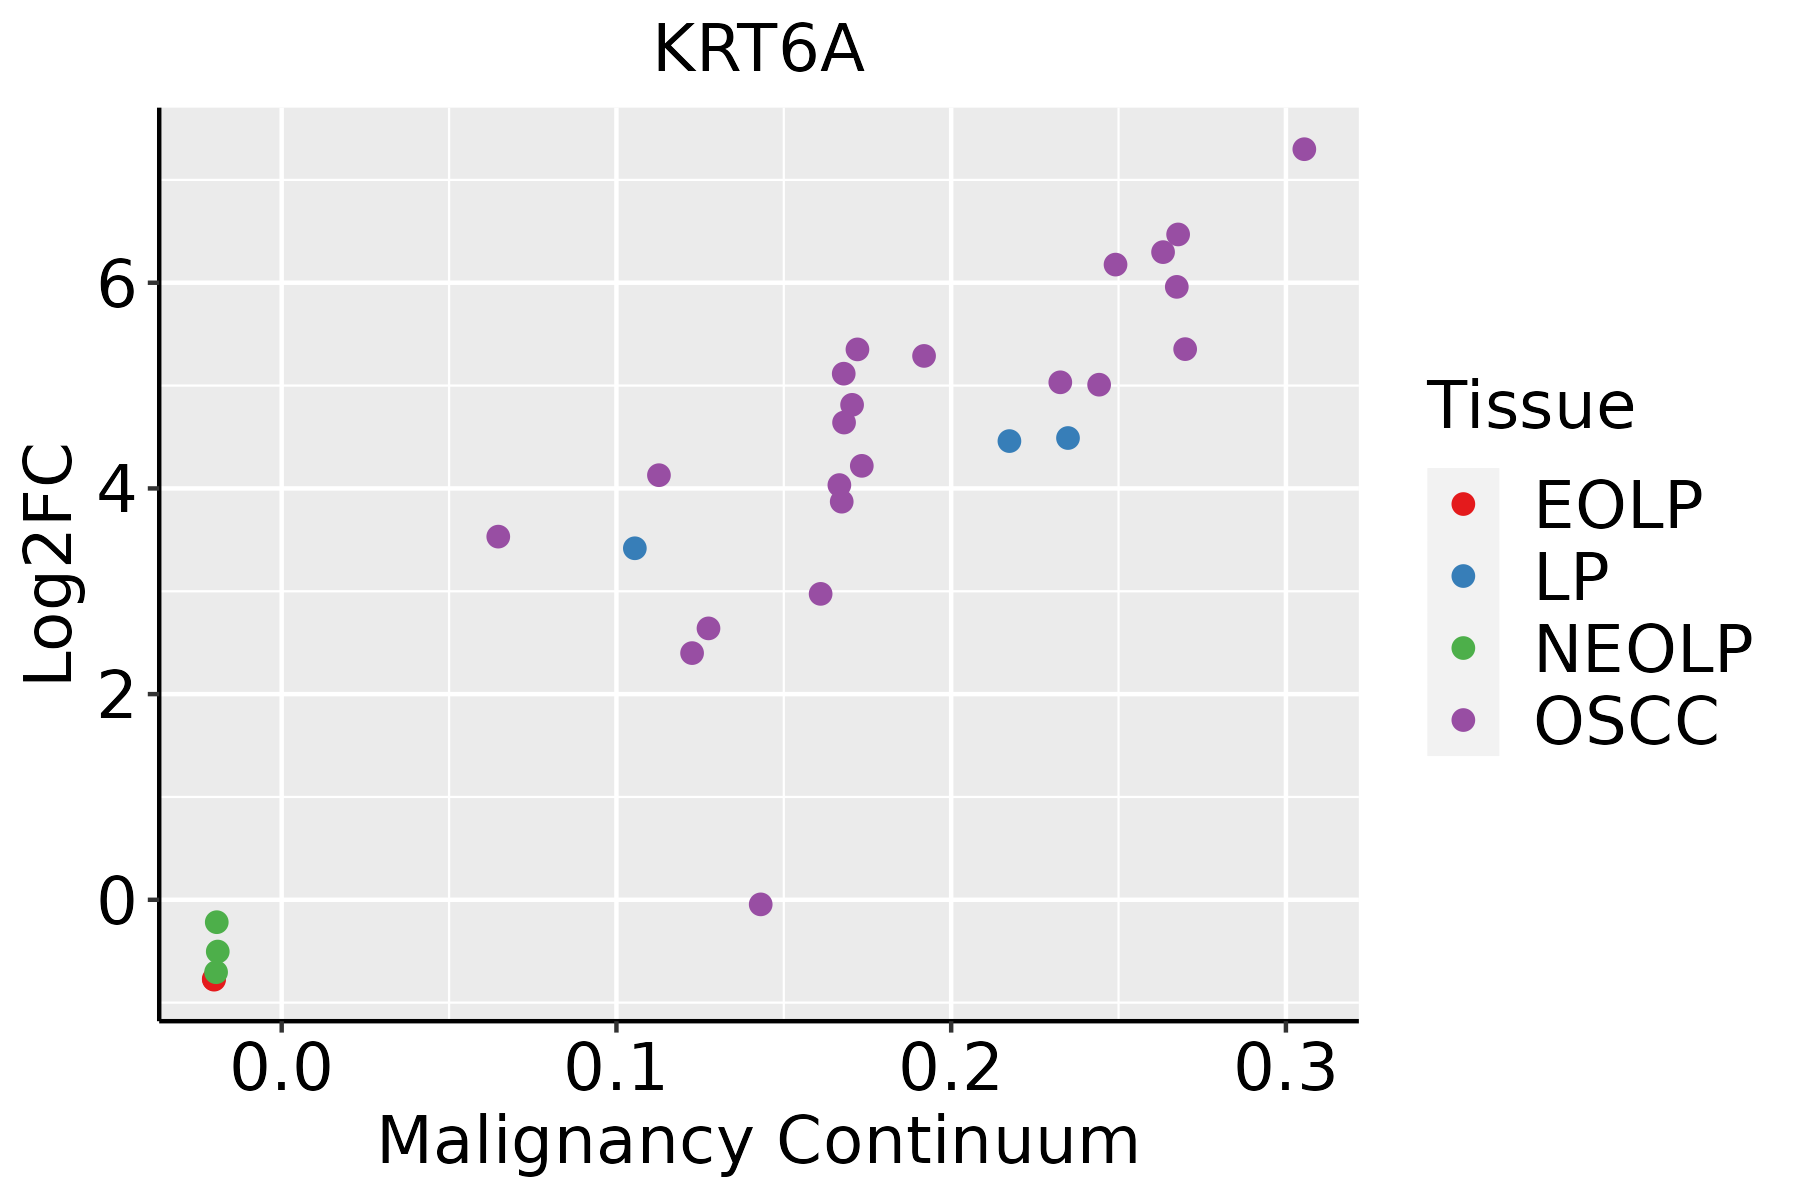 | EOLP: Erosive Oral lichen planus |
| LP: leukoplakia | ||
| NEOLP: Non-erosive oral lichen planus | ||
| OSCC: Oral squamous cell carcinoma | ||
| Skin |  | AK: Actinic keratosis |
| cSCC: Cutaneous squamous cell carcinoma | ||
| SCCIS:squamous cell carcinoma in situ |
| ∗log2FC in expression of this searched gene in stem-like cells from each diseased tissue sample relative to stem-like cells in normal samples in each tissue plotted against the malignancy continuum. Samples are colored based on if they are from different disease stage. |
Top |
Malignant transformation related pathway analysis |
| Find out the enriched GO biological processes and KEGG pathways involved in transition from healthy to precancer to cancer |
| Tissue | Disease Stage | Enriched GO biological Processes |
| Colorectum | AD |  |
| Colorectum | SER |  |
| Colorectum | MSS |  |
| Colorectum | MSI-H |  |
| Colorectum | FAP |  |
| ∗Top 15 enriched GO BP terms are showed in the bar plot of each disease state in each tissue. Each row represents a significant GO biological process which is colored according to the -log10(p.adjust). |
| Page: 1 2 3 4 5 6 7 8 9 |
| GO ID | Tissue | Disease Stage | Description | Gene Ratio | Bg Ratio | pvalue | p.adjust | Count |
| GO:004206010 | Cervix | CC | wound healing | 109/2311 | 422/18723 | 1.84e-14 | 1.57e-11 | 109 |
| GO:005212610 | Cervix | CC | movement in host environment | 52/2311 | 175/18723 | 7.03e-10 | 8.76e-08 | 52 |
| GO:004440910 | Cervix | CC | entry into host | 47/2311 | 151/18723 | 8.45e-10 | 1.03e-07 | 47 |
| GO:005170110 | Cervix | CC | biological process involved in interaction with host | 57/2311 | 203/18723 | 1.18e-09 | 1.41e-07 | 57 |
| GO:004440310 | Cervix | CC | biological process involved in symbiotic interaction | 71/2311 | 290/18723 | 7.94e-09 | 6.98e-07 | 71 |
| GO:00523728 | Cervix | CC | modulation by symbiont of entry into host | 15/2311 | 49/18723 | 5.81e-04 | 5.52e-03 | 15 |
| GO:004390310 | Cervix | CC | regulation of biological process involved in symbiotic interaction | 19/2311 | 72/18723 | 9.11e-04 | 7.81e-03 | 19 |
| GO:00313423 | Cervix | CC | negative regulation of cell killing | 10/2311 | 28/18723 | 1.28e-03 | 1.02e-02 | 10 |
| GO:00197308 | Cervix | CC | antimicrobial humoral response | 27/2311 | 122/18723 | 1.70e-03 | 1.29e-02 | 27 |
| GO:00019067 | Cervix | CC | cell killing | 37/2311 | 188/18723 | 2.61e-03 | 1.80e-02 | 37 |
| GO:00618447 | Cervix | CC | antimicrobial humoral immune response mediated by antimicrobial peptide | 18/2311 | 79/18723 | 6.82e-03 | 3.74e-02 | 18 |
| GO:00069597 | Cervix | CC | humoral immune response | 54/2311 | 317/18723 | 8.57e-03 | 4.42e-02 | 54 |
| GO:000695912 | Cervix | HSIL_HPV | humoral immune response | 39/737 | 317/18723 | 2.88e-10 | 7.02e-08 | 39 |
| GO:004440915 | Cervix | HSIL_HPV | entry into host | 24/737 | 151/18723 | 5.42e-09 | 7.61e-07 | 24 |
| GO:005212615 | Cervix | HSIL_HPV | movement in host environment | 25/737 | 175/18723 | 2.41e-08 | 2.18e-06 | 25 |
| GO:004440315 | Cervix | HSIL_HPV | biological process involved in symbiotic interaction | 33/737 | 290/18723 | 4.67e-08 | 3.59e-06 | 33 |
| GO:004206015 | Cervix | HSIL_HPV | wound healing | 40/737 | 422/18723 | 2.80e-07 | 1.61e-05 | 40 |
| GO:005170115 | Cervix | HSIL_HPV | biological process involved in interaction with host | 25/737 | 203/18723 | 4.50e-07 | 2.36e-05 | 25 |
| GO:001973012 | Cervix | HSIL_HPV | antimicrobial humoral response | 18/737 | 122/18723 | 1.35e-06 | 6.21e-05 | 18 |
| GO:000190611 | Cervix | HSIL_HPV | cell killing | 23/737 | 188/18723 | 1.45e-06 | 6.47e-05 | 23 |
| Page: 1 2 3 4 5 6 |
| Pathway ID | Tissue | Disease Stage | Description | Gene Ratio | Bg Ratio | pvalue | p.adjust | qvalue | Count |
| Page: 1 |
Top |
Cell-cell communication analysis |
| Identification of potential cell-cell interactions between two cell types and their ligand-receptor pairs for different disease states |
| Ligand | Receptor | LRpair | Pathway | Tissue | Disease Stage |
| Page: 1 |
Top |
Single-cell gene regulatory network inference analysis |
| Find out the significant the regulons (TFs) and the target genes of each regulon across cell types for different disease states |
| TF | Cell Type | Tissue | Disease Stage | Target Gene | RSS | Regulon Activity |
| ∗The dot plots of a searched regulon are shown for all cell subpopulations in each disease state of each tissue based on the regulon specific score inferred using pySCENIC and by calculating the average expression. |
| Page: 1 |
Top |
Somatic mutation of malignant transformation related genes |
| Annotation of somatic variants for genes involved in malignant transformation |
| Hugo Symbol | Variant Class | Variant Classification | dbSNP RS | HGVSc | HGVSp | HGVSp Short | SWISSPROT | BIOTYPE | SIFT | PolyPhen | Tumor Sample Barcode | Tissue | Histology | Sex | Age | Stage | Therapy Types | Drugs | Outcome |
| KRT6A | SNV | Missense_Mutation | rs369911781 | c.1081G>A | p.Glu361Lys | p.E361K | P02538 | protein_coding | deleterious(0.01) | benign(0.394) | TCGA-AN-A0XW-01 | Breast | breast invasive carcinoma | Female | <65 | III/IV | Unknown | Unknown | SD |
| KRT6A | SNV | Missense_Mutation | c.1610N>A | p.Gly537Asp | p.G537D | P02538 | protein_coding | tolerated(0.05) | benign(0.071) | TCGA-D8-A1J8-01 | Breast | breast invasive carcinoma | Female | >=65 | I/II | Hormone Therapy | nolvadex | SD | |
| KRT6A | SNV | Missense_Mutation | rs533157590 | c.44G>A | p.Arg15His | p.R15H | P02538 | protein_coding | tolerated(0.28) | benign(0) | TCGA-LD-A66U-01 | Breast | breast invasive carcinoma | Female | <65 | I/II | Chemotherapy | adriamycin | SD |
| KRT6A | SNV | Missense_Mutation | novel | c.314N>A | p.Gly105Glu | p.G105E | P02538 | protein_coding | deleterious(0.02) | benign(0.154) | TCGA-DS-A1OB-01 | Cervix | cervical & endocervical cancer | Female | <65 | I/II | Chemotherapy | carboplatin | PD |
| KRT6A | SNV | Missense_Mutation | c.1502N>A | p.Ser501Asn | p.S501N | P02538 | protein_coding | tolerated(0.39) | benign(0.035) | TCGA-FU-A3TQ-01 | Cervix | cervical & endocervical cancer | Female | <65 | III/IV | Unknown | Unknown | SD | |
| KRT6A | SNV | Missense_Mutation | c.1117G>T | p.Asp373Tyr | p.D373Y | P02538 | protein_coding | deleterious(0) | possibly_damaging(0.787) | TCGA-FU-A3WB-01 | Cervix | cervical & endocervical cancer | Female | <65 | I/II | Chemotherapy | cisplatin | CR | |
| KRT6A | SNV | Missense_Mutation | novel | c.1278G>T | p.Lys426Asn | p.K426N | P02538 | protein_coding | deleterious(0) | probably_damaging(1) | TCGA-A6-3809-01 | Colorectum | colon adenocarcinoma | Female | >=65 | I/II | Unknown | Unknown | SD |
| KRT6A | SNV | Missense_Mutation | c.799N>G | p.Phe267Val | p.F267V | P02538 | protein_coding | deleterious(0) | probably_damaging(0.998) | TCGA-AA-3977-01 | Colorectum | colon adenocarcinoma | Male | >=65 | I/II | Unknown | Unknown | SD | |
| KRT6A | SNV | Missense_Mutation | novel | c.457N>A | p.Asp153Asn | p.D153N | P02538 | protein_coding | deleterious(0) | probably_damaging(0.989) | TCGA-AA-3984-01 | Colorectum | colon adenocarcinoma | Female | <65 | I/II | Unknown | Unknown | SD |
| KRT6A | SNV | Missense_Mutation | rs758984854 | c.244N>A | p.Gly82Ser | p.G82S | P02538 | protein_coding | tolerated(0.15) | benign(0.005) | TCGA-AA-A010-01 | Colorectum | colon adenocarcinoma | Female | <65 | I/II | Chemotherapy | folinic | CR |
| Page: 1 2 3 4 5 6 7 8 9 |
Top |
Related drugs of malignant transformation related genes |
| Identification of chemicals and drugs interact with genes involved in malignant transfromation |
| (DGIdb 4.0) |
| Entrez ID | Symbol | Category | Interaction Types | Drug Claim Name | Drug Name | PMIDs |
| 3853 | KRT6A | NA | TD101 |
| Page: 1 |

Copyright 2023-Present -The University of Texas Health Science Center at Houston |