
|
|||||
|
 | |
| |
| |
| |
| |
| |
|
Gene: KRT5 |
Gene summary for KRT5 |
| Gene information | Species | Human | Gene symbol | KRT5 | Gene ID | 3852 |
| Gene name | keratin 5 | |
| Gene Alias | CK5 | |
| Cytomap | 12q13.13 | |
| Gene Type | protein-coding | GO ID | GO:0006996 | UniProtAcc | P13647 |
Top |
Malignant transformation analysis |
| Identification of the aberrant gene expression in precancerous and cancerous lesions by comparing the gene expression of stem-like cells in diseased tissues with normal stem cells |
| Entrez ID | Symbol | Replicates | Species | Organ | Tissue | Adj P-value | Log2FC | Malignancy |
| 3852 | KRT5 | GSM4909277 | Human | Breast | Precancer | 1.35e-03 | 5.99e-01 | 0.0177 |
| 3852 | KRT5 | GSM4909281 | Human | Breast | IDC | 5.75e-07 | 3.57e-01 | 0.21 |
| 3852 | KRT5 | GSM4909282 | Human | Breast | IDC | 1.35e-35 | 8.42e-01 | -0.0288 |
| 3852 | KRT5 | GSM4909285 | Human | Breast | IDC | 5.00e-87 | 1.37e+00 | 0.21 |
| 3852 | KRT5 | GSM4909290 | Human | Breast | IDC | 7.99e-05 | -2.33e-01 | 0.2096 |
| 3852 | KRT5 | GSM4909291 | Human | Breast | IDC | 1.66e-05 | -2.40e-01 | 0.1753 |
| 3852 | KRT5 | GSM4909293 | Human | Breast | IDC | 1.07e-03 | -1.96e-01 | 0.1581 |
| 3852 | KRT5 | GSM4909294 | Human | Breast | IDC | 3.42e-03 | -2.11e-01 | 0.2022 |
| 3852 | KRT5 | GSM4909295 | Human | Breast | IDC | 1.00e-11 | 7.14e-01 | 0.0898 |
| 3852 | KRT5 | GSM4909296 | Human | Breast | IDC | 1.47e-02 | -2.30e-01 | 0.1524 |
| 3852 | KRT5 | GSM4909297 | Human | Breast | IDC | 3.43e-03 | -1.95e-01 | 0.1517 |
| 3852 | KRT5 | GSM4909299 | Human | Breast | IDC | 1.21e-08 | 4.00e-01 | 0.035 |
| 3852 | KRT5 | GSM4909301 | Human | Breast | IDC | 3.84e-07 | -2.40e-01 | 0.1577 |
| 3852 | KRT5 | GSM4909302 | Human | Breast | IDC | 3.26e-05 | -2.05e-01 | 0.1545 |
| 3852 | KRT5 | GSM4909304 | Human | Breast | IDC | 8.25e-07 | -2.39e-01 | 0.1636 |
| 3852 | KRT5 | GSM4909305 | Human | Breast | IDC | 3.62e-03 | 4.01e-01 | 0.0436 |
| 3852 | KRT5 | GSM4909308 | Human | Breast | IDC | 3.63e-09 | -2.40e-01 | 0.158 |
| 3852 | KRT5 | GSM4909311 | Human | Breast | IDC | 6.92e-04 | 2.91e-03 | 0.1534 |
| 3852 | KRT5 | GSM4909312 | Human | Breast | IDC | 8.25e-07 | -2.40e-01 | 0.1552 |
| 3852 | KRT5 | GSM4909315 | Human | Breast | IDC | 1.79e-07 | -2.38e-01 | 0.21 |
| Page: 1 2 3 4 5 6 7 8 9 10 |
| Tissue | Expression Dynamics | Abbreviation |
| Breast | 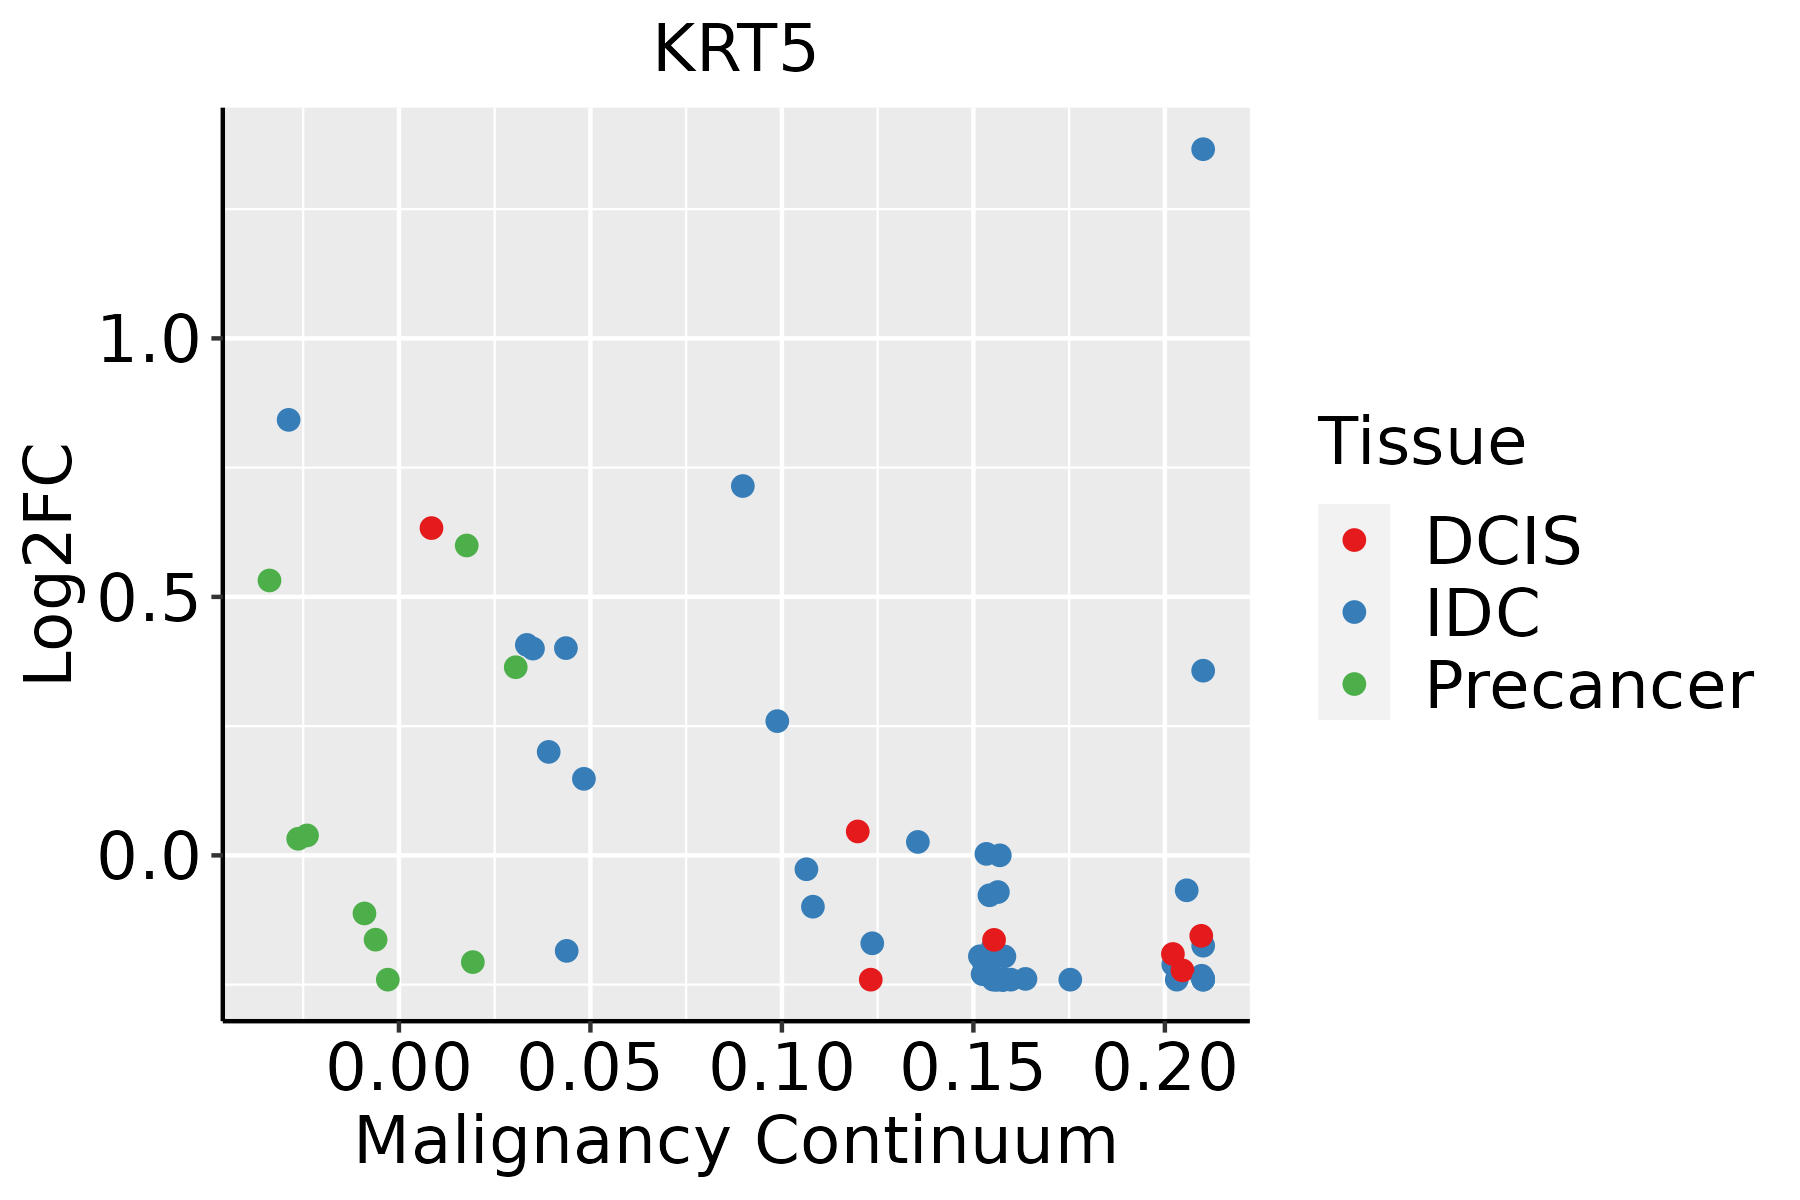 | IDC: Invasive ductal carcinoma |
| DCIS: Ductal carcinoma in situ | ||
| Precancer(BRCA1-mut): Precancerous lesion from BRCA1 mutation carriers | ||
| Cervix |  | CC: Cervix cancer |
| HSIL_HPV: HPV-infected high-grade squamous intraepithelial lesions | ||
| N_HPV: HPV-infected normal cervix | ||
| Esophagus | 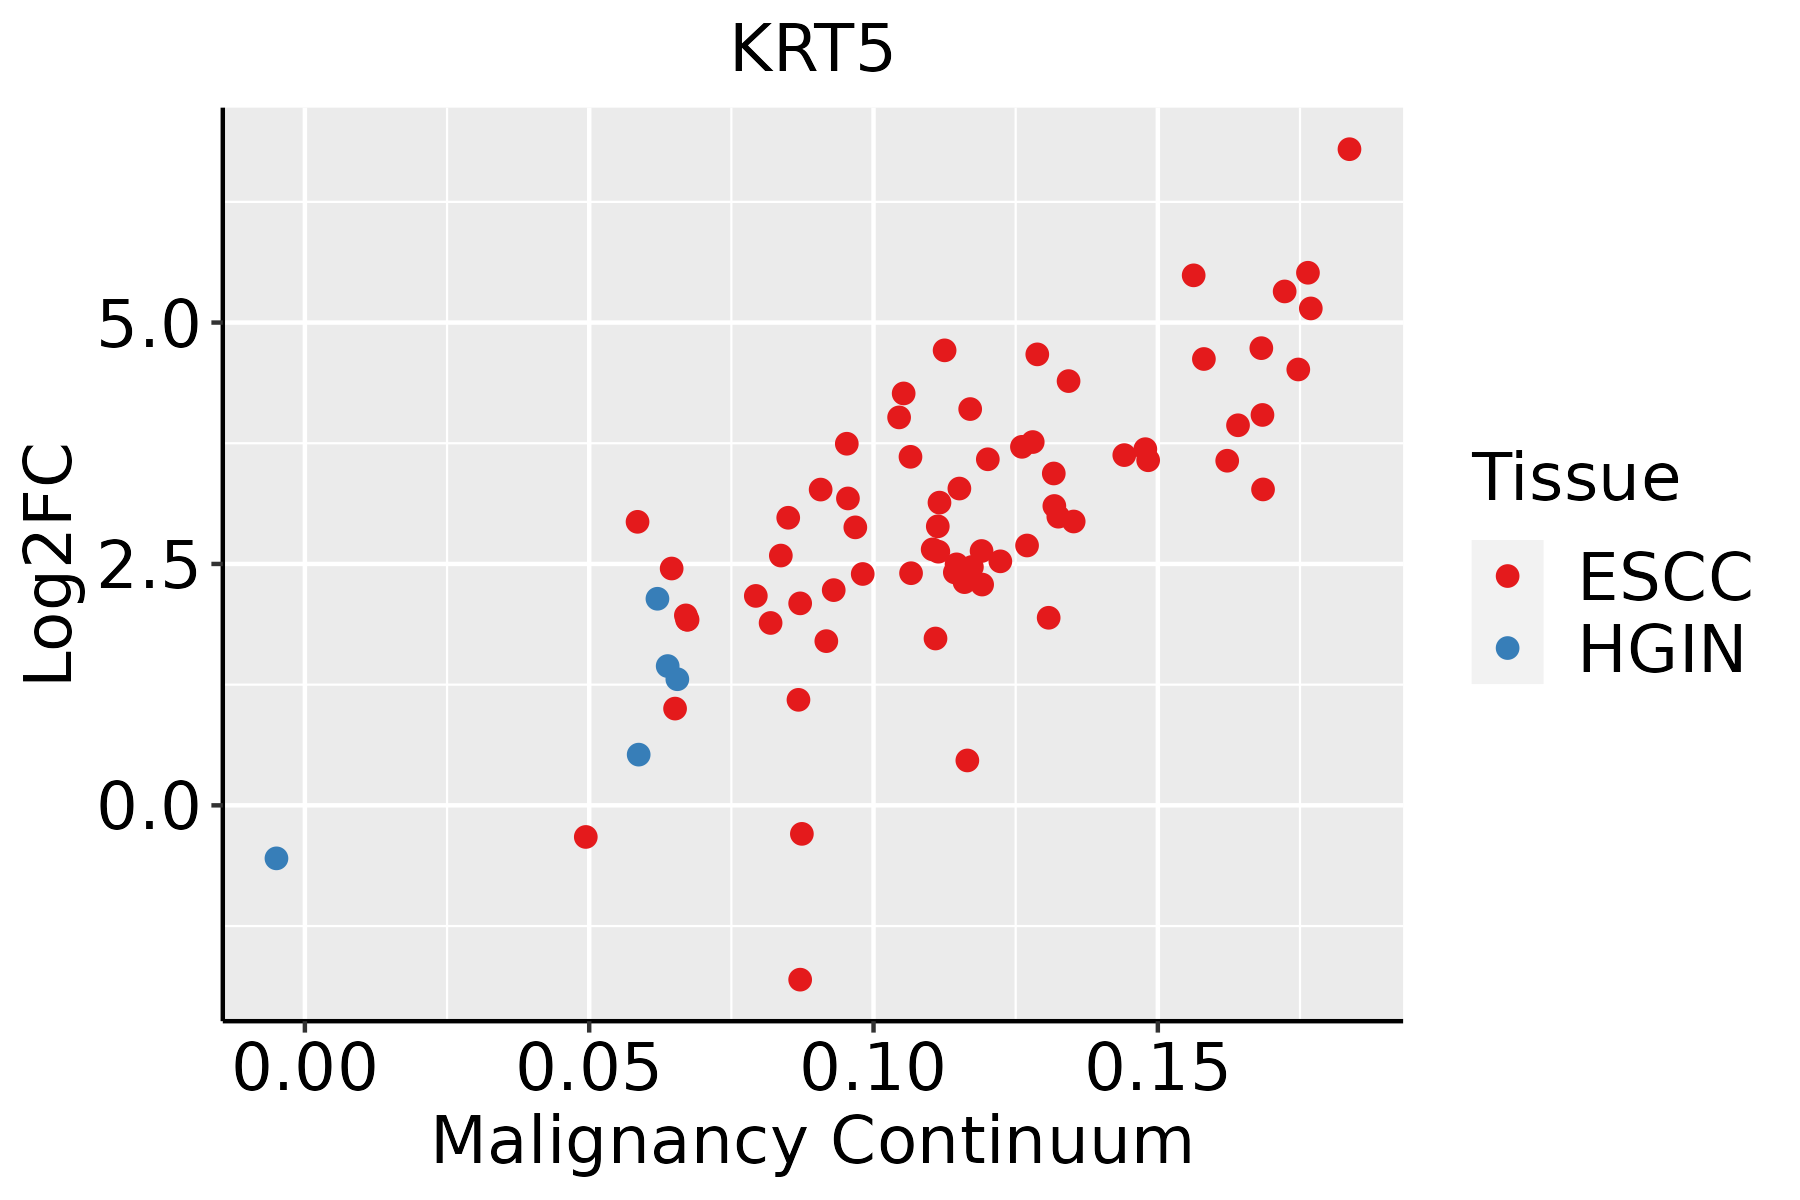 | ESCC: Esophageal squamous cell carcinoma |
| HGIN: High-grade intraepithelial neoplasias | ||
| LGIN: Low-grade intraepithelial neoplasias | ||
| Oral Cavity |  | EOLP: Erosive Oral lichen planus |
| LP: leukoplakia | ||
| NEOLP: Non-erosive oral lichen planus | ||
| OSCC: Oral squamous cell carcinoma | ||
| Prostate | 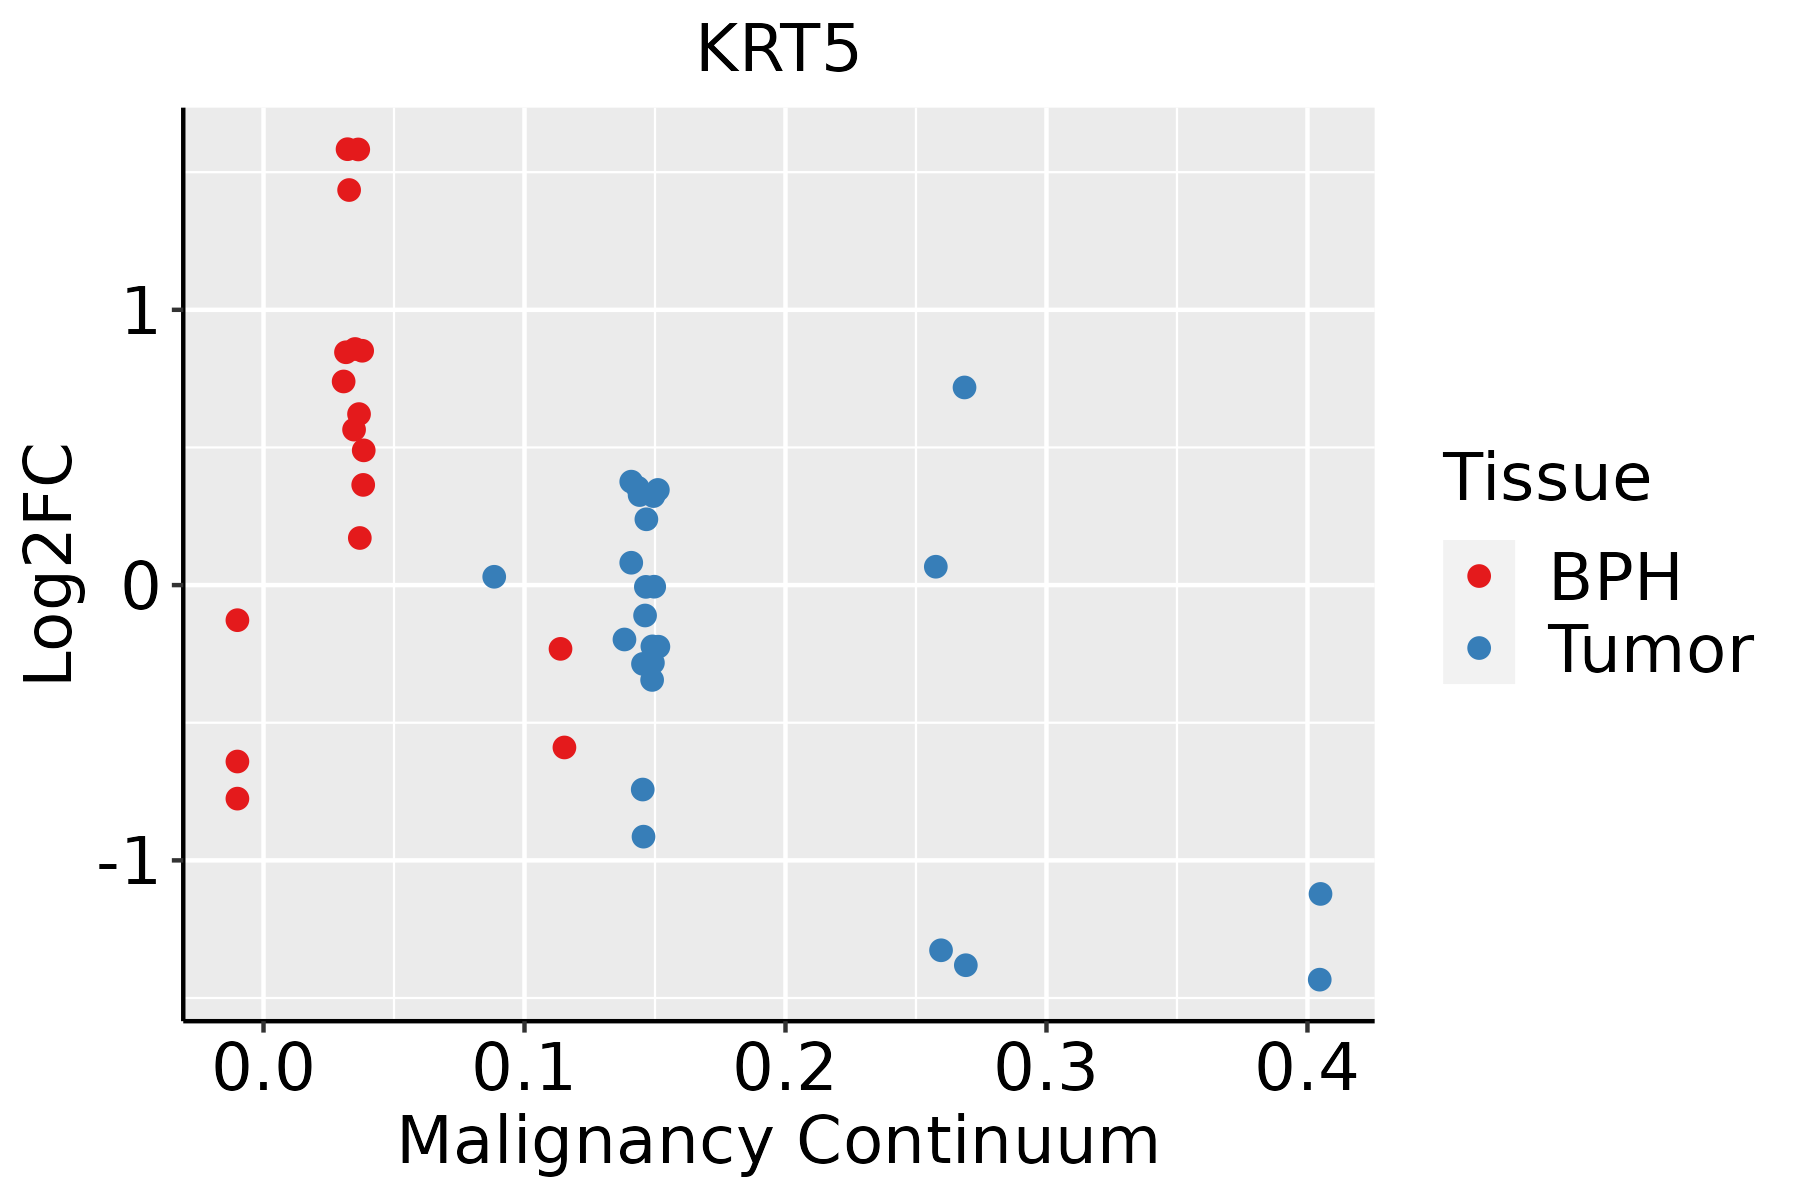 | BPH: Benign Prostatic Hyperplasia |
| Skin |  | AK: Actinic keratosis |
| cSCC: Cutaneous squamous cell carcinoma | ||
| SCCIS:squamous cell carcinoma in situ |
| ∗log2FC in expression of this searched gene in stem-like cells from each diseased tissue sample relative to stem-like cells in normal samples in each tissue plotted against the malignancy continuum. Samples are colored based on if they are from different disease stage. |
Top |
Malignant transformation related pathway analysis |
| Find out the enriched GO biological processes and KEGG pathways involved in transition from healthy to precancer to cancer |
| Tissue | Disease Stage | Enriched GO biological Processes |
| Colorectum | AD |  |
| Colorectum | SER |  |
| Colorectum | MSS |  |
| Colorectum | MSI-H |  |
| Colorectum | FAP |  |
| ∗Top 15 enriched GO BP terms are showed in the bar plot of each disease state in each tissue. Each row represents a significant GO biological process which is colored according to the -log10(p.adjust). |
| Page: 1 2 3 4 5 6 7 8 9 |
| GO ID | Tissue | Disease Stage | Description | Gene Ratio | Bg Ratio | pvalue | p.adjust | Count |
| GO:00085445 | Breast | Precancer | epidermis development | 35/1080 | 324/18723 | 2.71e-04 | 3.96e-03 | 35 |
| GO:000854412 | Breast | IDC | epidermis development | 41/1434 | 324/18723 | 1.03e-03 | 1.14e-02 | 41 |
| GO:000854422 | Breast | DCIS | epidermis development | 40/1390 | 324/18723 | 1.05e-03 | 1.16e-02 | 40 |
| GO:00085446 | Cervix | CC | epidermis development | 83/2311 | 324/18723 | 3.91e-11 | 8.54e-09 | 83 |
| GO:000854413 | Cervix | HSIL_HPV | epidermis development | 38/737 | 324/18723 | 1.92e-09 | 3.23e-07 | 38 |
| GO:000854423 | Cervix | N_HPV | epidermis development | 21/534 | 324/18723 | 4.32e-04 | 6.01e-03 | 21 |
| GO:000854410 | Esophagus | ESCC | epidermis development | 193/8552 | 324/18723 | 2.87e-07 | 4.19e-06 | 193 |
| GO:00085449 | Oral cavity | OSCC | epidermis development | 171/7305 | 324/18723 | 2.89e-07 | 4.43e-06 | 171 |
| GO:000854416 | Oral cavity | LP | epidermis development | 112/4623 | 324/18723 | 3.81e-05 | 5.61e-04 | 112 |
| GO:000854424 | Oral cavity | EOLP | epidermis development | 64/2218 | 324/18723 | 2.48e-05 | 3.68e-04 | 64 |
| GO:000854431 | Oral cavity | NEOLP | epidermis development | 57/2005 | 324/18723 | 1.13e-04 | 1.35e-03 | 57 |
| GO:00085448 | Prostate | BPH | epidermis development | 80/3107 | 324/18723 | 1.12e-04 | 1.02e-03 | 80 |
| GO:000854415 | Prostate | Tumor | epidermis development | 89/3246 | 324/18723 | 3.15e-06 | 5.18e-05 | 89 |
| GO:000854417 | Skin | AK | epidermis development | 79/1910 | 324/18723 | 1.04e-13 | 3.25e-11 | 79 |
| GO:000854418 | Skin | SCCIS | epidermis development | 40/919 | 324/18723 | 7.81e-08 | 1.15e-05 | 40 |
| GO:000854425 | Skin | cSCC | epidermis development | 131/4864 | 324/18723 | 7.38e-09 | 2.39e-07 | 131 |
| Page: 1 |
| Pathway ID | Tissue | Disease Stage | Description | Gene Ratio | Bg Ratio | pvalue | p.adjust | qvalue | Count |
| Page: 1 |
Top |
Cell-cell communication analysis |
| Identification of potential cell-cell interactions between two cell types and their ligand-receptor pairs for different disease states |
| Ligand | Receptor | LRpair | Pathway | Tissue | Disease Stage |
| Page: 1 |
Top |
Single-cell gene regulatory network inference analysis |
| Find out the significant the regulons (TFs) and the target genes of each regulon across cell types for different disease states |
| TF | Cell Type | Tissue | Disease Stage | Target Gene | RSS | Regulon Activity |
| ∗The dot plots of a searched regulon are shown for all cell subpopulations in each disease state of each tissue based on the regulon specific score inferred using pySCENIC and by calculating the average expression. |
| Page: 1 |
Top |
Somatic mutation of malignant transformation related genes |
| Annotation of somatic variants for genes involved in malignant transformation |
| Hugo Symbol | Variant Class | Variant Classification | dbSNP RS | HGVSc | HGVSp | HGVSp Short | SWISSPROT | BIOTYPE | SIFT | PolyPhen | Tumor Sample Barcode | Tissue | Histology | Sex | Age | Stage | Therapy Types | Drugs | Outcome |
| KRT5 | SNV | Missense_Mutation | c.1153N>A | p.Glu385Lys | p.E385K | P13647 | protein_coding | deleterious(0) | probably_damaging(0.997) | TCGA-AC-A23H-01 | Breast | breast invasive carcinoma | Female | >=65 | I/II | Unknown | Unknown | PD | |
| KRT5 | SNV | Missense_Mutation | c.1031C>A | p.Ala344Asp | p.A344D | P13647 | protein_coding | deleterious(0) | probably_damaging(0.988) | TCGA-BH-A1FH-01 | Breast | breast invasive carcinoma | Female | <65 | III/IV | Unknown | Unknown | PD | |
| KRT5 | insertion | In_Frame_Ins | novel | c.1138_1139insTGG | p.Arg380delinsLeuGly | p.R380delinsLG | P13647 | protein_coding | TCGA-A8-A07R-01 | Breast | breast invasive carcinoma | Female | >=65 | III/IV | Ancillary | zoledronic | SD | ||
| KRT5 | insertion | In_Frame_Ins | novel | c.1137_1138insACTTTTCTGGTCTCTTTTCCCCCACCGGTGTTC | p.Leu379_Arg380insThrPheLeuValSerPheProProProValPhe | p.L379_R380insTFLVSFPPPVF | P13647 | protein_coding | TCGA-A8-A07R-01 | Breast | breast invasive carcinoma | Female | >=65 | III/IV | Ancillary | zoledronic | SD | ||
| KRT5 | SNV | Missense_Mutation | c.415G>A | p.Gly139Ser | p.G139S | P13647 | protein_coding | deleterious(0) | benign(0.015) | TCGA-EK-A2RK-01 | Cervix | cervical & endocervical cancer | Female | >=65 | I/II | Unknown | Unknown | SD | |
| KRT5 | SNV | Missense_Mutation | rs182482982 | c.1676N>A | p.Arg559Gln | p.R559Q | P13647 | protein_coding | tolerated(0.51) | benign(0) | TCGA-IR-A3LK-01 | Cervix | cervical & endocervical cancer | Female | >=65 | I/II | Chemotherapy | cisplatin | PD |
| KRT5 | SNV | Missense_Mutation | c.1540N>A | p.Gly514Arg | p.G514R | P13647 | protein_coding | tolerated(0.17) | benign(0.265) | TCGA-IR-A3LK-01 | Cervix | cervical & endocervical cancer | Female | >=65 | I/II | Chemotherapy | cisplatin | PD | |
| KRT5 | SNV | Missense_Mutation | novel | c.959N>G | p.Asp320Gly | p.D320G | P13647 | protein_coding | deleterious(0) | probably_damaging(0.992) | TCGA-AA-3984-01 | Colorectum | colon adenocarcinoma | Female | <65 | I/II | Unknown | Unknown | SD |
| KRT5 | SNV | Missense_Mutation | rs766857995 | c.1055N>A | p.Arg352His | p.R352H | P13647 | protein_coding | deleterious(0.03) | possibly_damaging(0.708) | TCGA-AA-A010-01 | Colorectum | colon adenocarcinoma | Female | <65 | I/II | Chemotherapy | folinic | CR |
| KRT5 | SNV | Missense_Mutation | rs543574061 | c.86N>A | p.Arg29His | p.R29H | P13647 | protein_coding | tolerated(0.18) | benign(0.197) | TCGA-AD-6895-01 | Colorectum | colon adenocarcinoma | Male | >=65 | III/IV | Unknown | Unknown | SD |
| Page: 1 2 3 4 5 6 7 8 9 10 |
Top |
Related drugs of malignant transformation related genes |
| Identification of chemicals and drugs interact with genes involved in malignant transfromation |
| (DGIdb 4.0) |
| Entrez ID | Symbol | Category | Interaction Types | Drug Claim Name | Drug Name | PMIDs |
| Page: 1 |

Copyright 2023-Present -The University of Texas Health Science Center at Houston |