
|
|||||
|
 | |
| |
| |
| |
| |
| |
|
Gene: KRT31 |
Gene summary for KRT31 |
| Gene information | Species | Human | Gene symbol | KRT31 | Gene ID | 3881 |
| Gene name | keratin 31 | |
| Gene Alias | HA1 | |
| Cytomap | 17q21.2 | |
| Gene Type | protein-coding | GO ID | GO:0006996 | UniProtAcc | Q15323 |
Top |
Malignant transformation analysis |
| Identification of the aberrant gene expression in precancerous and cancerous lesions by comparing the gene expression of stem-like cells in diseased tissues with normal stem cells |
| Entrez ID | Symbol | Replicates | Species | Organ | Tissue | Adj P-value | Log2FC | Malignancy |
| 3881 | KRT31 | LZE4T | Human | Esophagus | ESCC | 4.62e-04 | 1.77e-01 | 0.0811 |
| 3881 | KRT31 | LZE24T | Human | Esophagus | ESCC | 2.51e-02 | 9.75e-02 | 0.0596 |
| 3881 | KRT31 | P4T-E | Human | Esophagus | ESCC | 2.83e-15 | 3.93e-01 | 0.1323 |
| 3881 | KRT31 | P9T-E | Human | Esophagus | ESCC | 2.98e-03 | 1.86e-01 | 0.1131 |
| 3881 | KRT31 | P20T-E | Human | Esophagus | ESCC | 1.14e-05 | 8.53e-02 | 0.1124 |
| 3881 | KRT31 | P21T-E | Human | Esophagus | ESCC | 6.90e-09 | 2.83e-01 | 0.1617 |
| 3881 | KRT31 | P26T-E | Human | Esophagus | ESCC | 5.03e-03 | 1.03e-01 | 0.1276 |
| 3881 | KRT31 | P27T-E | Human | Esophagus | ESCC | 5.68e-47 | 1.44e+00 | 0.1055 |
| 3881 | KRT31 | P31T-E | Human | Esophagus | ESCC | 1.04e-04 | 1.35e-01 | 0.1251 |
| 3881 | KRT31 | P32T-E | Human | Esophagus | ESCC | 7.67e-03 | 1.76e-01 | 0.1666 |
| 3881 | KRT31 | P39T-E | Human | Esophagus | ESCC | 2.17e-07 | 2.78e-01 | 0.0894 |
| 3881 | KRT31 | P42T-E | Human | Esophagus | ESCC | 7.88e-07 | 2.50e-01 | 0.1175 |
| 3881 | KRT31 | P48T-E | Human | Esophagus | ESCC | 1.32e-03 | 1.51e-01 | 0.0959 |
| 3881 | KRT31 | P52T-E | Human | Esophagus | ESCC | 1.41e-03 | 8.04e-02 | 0.1555 |
| 3881 | KRT31 | P54T-E | Human | Esophagus | ESCC | 2.80e-13 | 4.34e-01 | 0.0975 |
| 3881 | KRT31 | P57T-E | Human | Esophagus | ESCC | 7.31e-07 | 8.18e-01 | 0.0926 |
| 3881 | KRT31 | P62T-E | Human | Esophagus | ESCC | 3.31e-11 | 2.88e-01 | 0.1302 |
| 3881 | KRT31 | P65T-E | Human | Esophagus | ESCC | 5.05e-37 | 1.26e+00 | 0.0978 |
| 3881 | KRT31 | P74T-E | Human | Esophagus | ESCC | 1.86e-04 | 1.03e-01 | 0.1479 |
| 3881 | KRT31 | P80T-E | Human | Esophagus | ESCC | 3.42e-07 | 3.74e-01 | 0.155 |
| Page: 1 2 3 |
| Tissue | Expression Dynamics | Abbreviation |
| Esophagus | 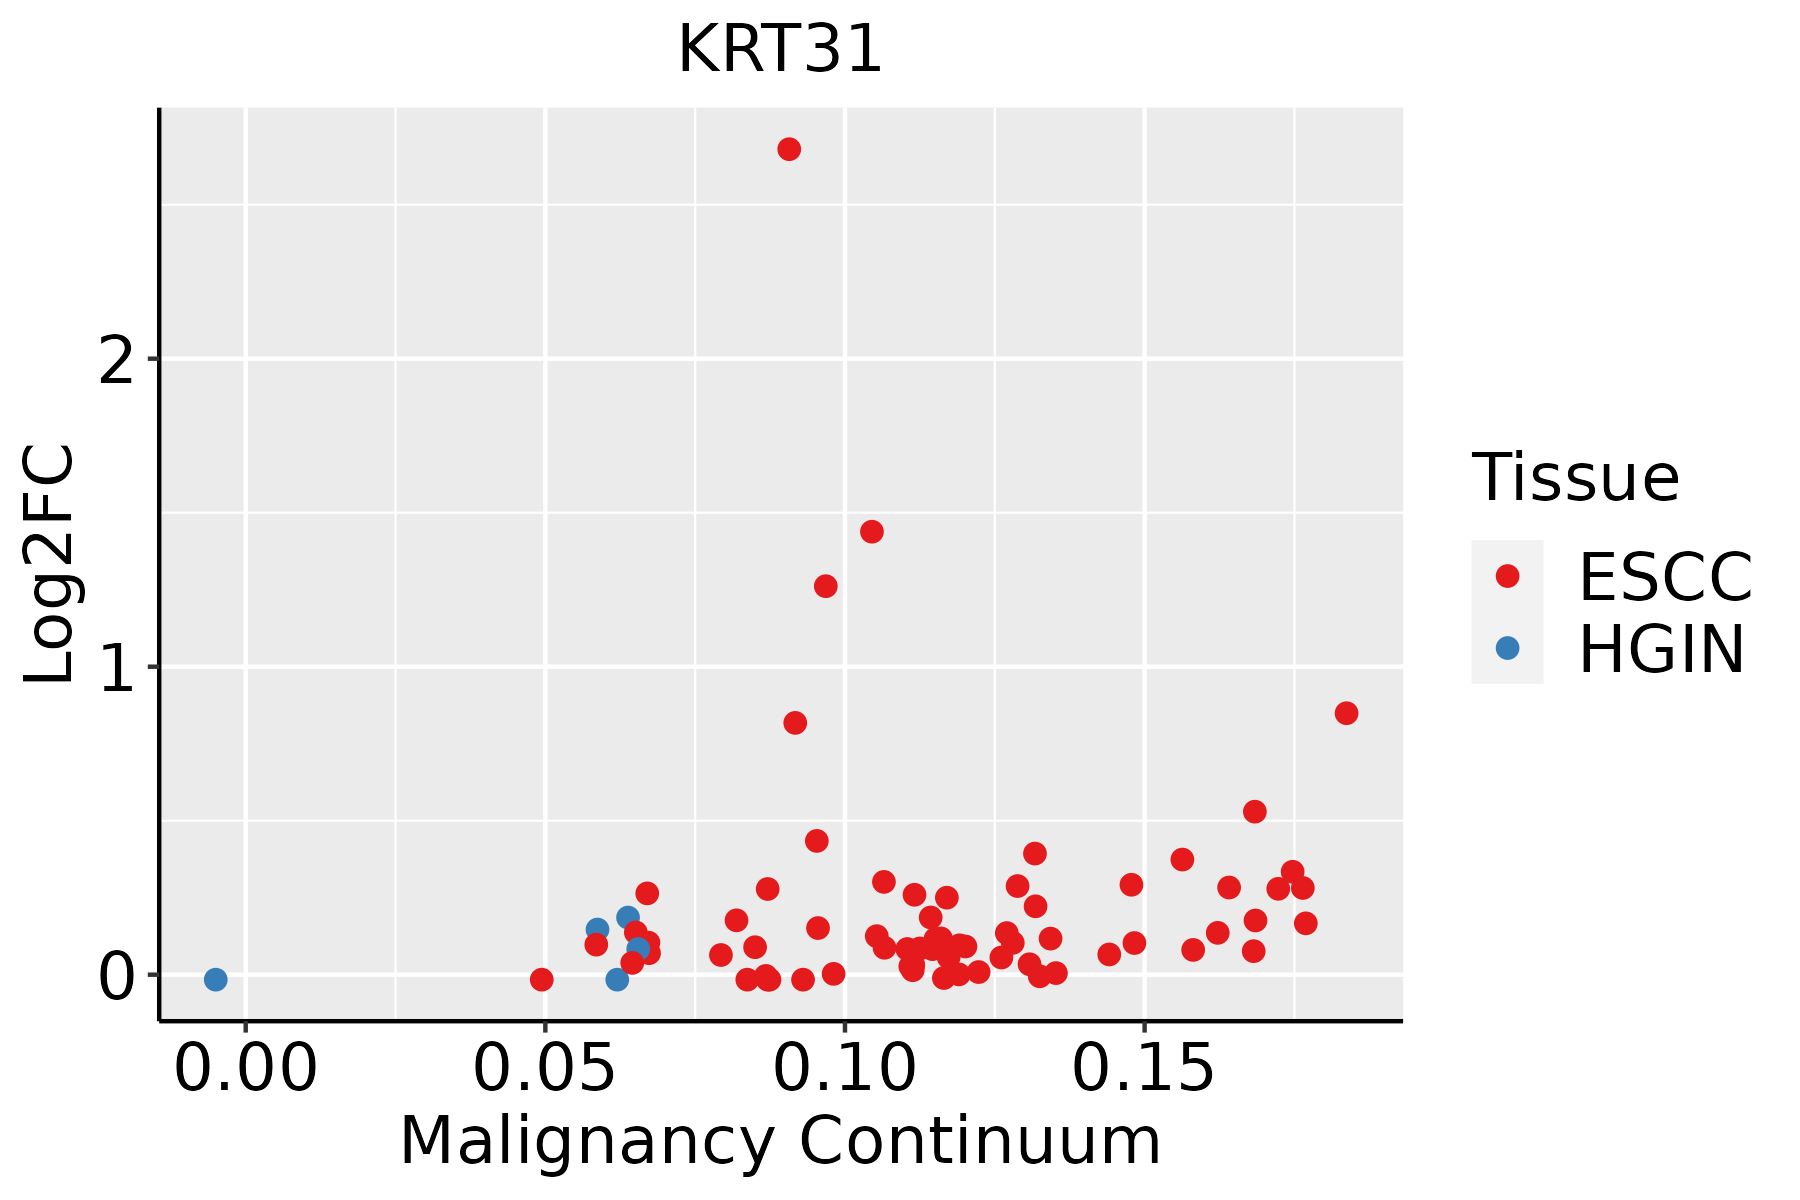 | ESCC: Esophageal squamous cell carcinoma |
| HGIN: High-grade intraepithelial neoplasias | ||
| LGIN: Low-grade intraepithelial neoplasias | ||
| Oral Cavity |  | EOLP: Erosive Oral lichen planus |
| LP: leukoplakia | ||
| NEOLP: Non-erosive oral lichen planus | ||
| OSCC: Oral squamous cell carcinoma | ||
| Skin |  | AK: Actinic keratosis |
| cSCC: Cutaneous squamous cell carcinoma | ||
| SCCIS:squamous cell carcinoma in situ |
| ∗log2FC in expression of this searched gene in stem-like cells from each diseased tissue sample relative to stem-like cells in normal samples in each tissue plotted against the malignancy continuum. Samples are colored based on if they are from different disease stage. |
Top |
Malignant transformation related pathway analysis |
| Find out the enriched GO biological processes and KEGG pathways involved in transition from healthy to precancer to cancer |
| Tissue | Disease Stage | Enriched GO biological Processes |
| Colorectum | AD |  |
| Colorectum | SER |  |
| Colorectum | MSS |  |
| Colorectum | MSI-H |  |
| Colorectum | FAP |  |
| ∗Top 15 enriched GO BP terms are showed in the bar plot of each disease state in each tissue. Each row represents a significant GO biological process which is colored according to the -log10(p.adjust). |
| Page: 1 2 3 4 5 6 7 8 9 |
| GO ID | Tissue | Disease Stage | Description | Gene Ratio | Bg Ratio | pvalue | p.adjust | Count |
| GO:000854410 | Esophagus | ESCC | epidermis development | 193/8552 | 324/18723 | 2.87e-07 | 4.19e-06 | 193 |
| GO:00085449 | Oral cavity | OSCC | epidermis development | 171/7305 | 324/18723 | 2.89e-07 | 4.43e-06 | 171 |
| GO:000854416 | Oral cavity | LP | epidermis development | 112/4623 | 324/18723 | 3.81e-05 | 5.61e-04 | 112 |
| GO:000854425 | Skin | cSCC | epidermis development | 131/4864 | 324/18723 | 7.38e-09 | 2.39e-07 | 131 |
| Page: 1 |
| Pathway ID | Tissue | Disease Stage | Description | Gene Ratio | Bg Ratio | pvalue | p.adjust | qvalue | Count |
| Page: 1 |
Top |
Cell-cell communication analysis |
| Identification of potential cell-cell interactions between two cell types and their ligand-receptor pairs for different disease states |
| Ligand | Receptor | LRpair | Pathway | Tissue | Disease Stage |
| Page: 1 |
Top |
Single-cell gene regulatory network inference analysis |
| Find out the significant the regulons (TFs) and the target genes of each regulon across cell types for different disease states |
| TF | Cell Type | Tissue | Disease Stage | Target Gene | RSS | Regulon Activity |
| ∗The dot plots of a searched regulon are shown for all cell subpopulations in each disease state of each tissue based on the regulon specific score inferred using pySCENIC and by calculating the average expression. |
| Page: 1 |
Top |
Somatic mutation of malignant transformation related genes |
| Annotation of somatic variants for genes involved in malignant transformation |
| Hugo Symbol | Variant Class | Variant Classification | dbSNP RS | HGVSc | HGVSp | HGVSp Short | SWISSPROT | BIOTYPE | SIFT | PolyPhen | Tumor Sample Barcode | Tissue | Histology | Sex | Age | Stage | Therapy Types | Drugs | Outcome |
| KRT31 | SNV | Missense_Mutation | novel | c.343C>A | p.Gln115Lys | p.Q115K | Q15323 | protein_coding | tolerated(0.14) | benign(0.02) | TCGA-AC-A8OR-01 | Breast | breast invasive carcinoma | Female | >=65 | I/II | Unknown | Unknown | SD |
| KRT31 | SNV | Missense_Mutation | c.178N>G | p.Met60Val | p.M60V | Q15323 | protein_coding | deleterious(0.02) | probably_damaging(0.998) | TCGA-AO-A128-01 | Breast | breast invasive carcinoma | Female | <65 | I/II | Chemotherapy | doxorubicin | SD | |
| KRT31 | SNV | Missense_Mutation | c.1178N>C | p.Cys393Ser | p.C393S | Q15323 | protein_coding | tolerated(0.16) | possibly_damaging(0.879) | TCGA-D8-A1XL-01 | Breast | breast invasive carcinoma | Female | <65 | I/II | Chemotherapy | doxorubicine+cyclophosphamide+tamoxifen | SD | |
| KRT31 | SNV | Missense_Mutation | novel | c.125N>T | p.Ser42Ile | p.S42I | Q15323 | protein_coding | deleterious(0.01) | benign(0.136) | TCGA-2W-A8YY-01 | Cervix | cervical & endocervical cancer | Female | <65 | I/II | Chemotherapy | cisplatin | CR |
| KRT31 | SNV | Missense_Mutation | c.365N>T | p.Ser122Phe | p.S122F | Q15323 | protein_coding | deleterious(0) | benign(0.393) | TCGA-C5-A1ME-01 | Cervix | cervical & endocervical cancer | Female | <65 | I/II | Unknown | Unknown | SD | |
| KRT31 | SNV | Missense_Mutation | novel | c.813N>C | p.Glu271Asp | p.E271D | Q15323 | protein_coding | tolerated(0.14) | possibly_damaging(0.533) | TCGA-C5-A2LZ-01 | Cervix | cervical & endocervical cancer | Female | >=65 | III/IV | Unknown | Unknown | PD |
| KRT31 | SNV | Missense_Mutation | c.1216N>G | p.Pro406Ala | p.P406A | Q15323 | protein_coding | tolerated(0.23) | benign(0.02) | TCGA-DR-A0ZM-01 | Cervix | cervical & endocervical cancer | Female | <65 | III/IV | Unspecific | Cisplatin | SD | |
| KRT31 | SNV | Missense_Mutation | c.667N>T | p.Arg223Trp | p.R223W | Q15323 | protein_coding | deleterious(0.01) | possibly_damaging(0.773) | TCGA-5M-AATA-01 | Colorectum | colon adenocarcinoma | Unknown | Unknown | I/II | Unknown | Unknown | Unknown | |
| KRT31 | SNV | Missense_Mutation | c.994C>A | p.Leu332Met | p.L332M | Q15323 | protein_coding | tolerated(0.11) | possibly_damaging(0.587) | TCGA-A6-5661-01 | Colorectum | colon adenocarcinoma | Female | >=65 | I/II | Unknown | Unknown | SD | |
| KRT31 | SNV | Missense_Mutation | c.442N>A | p.Glu148Lys | p.E148K | Q15323 | protein_coding | deleterious(0) | probably_damaging(1) | TCGA-AA-3510-01 | Colorectum | colon adenocarcinoma | Male | >=65 | I/II | Unknown | Unknown | SD |
| Page: 1 2 3 4 5 6 7 8 |
Top |
Related drugs of malignant transformation related genes |
| Identification of chemicals and drugs interact with genes involved in malignant transfromation |
| (DGIdb 4.0) |
| Entrez ID | Symbol | Category | Interaction Types | Drug Claim Name | Drug Name | PMIDs |
| Page: 1 |

Copyright 2023-Present -The University of Texas Health Science Center at Houston |