
|
|||||
|
 | |
| |
| |
| |
| |
| |
|
Gene: KRT23 |
Gene summary for KRT23 |
| Gene information | Species | Human | Gene symbol | KRT23 | Gene ID | 25984 |
| Gene name | keratin 23 | |
| Gene Alias | CK23 | |
| Cytomap | 17q21.2 | |
| Gene Type | protein-coding | GO ID | GO:0005575 | UniProtAcc | Q9C075 |
Top |
Malignant transformation analysis |
| Identification of the aberrant gene expression in precancerous and cancerous lesions by comparing the gene expression of stem-like cells in diseased tissues with normal stem cells |
| Entrez ID | Symbol | Replicates | Species | Organ | Tissue | Adj P-value | Log2FC | Malignancy |
| 25984 | KRT23 | GSM4909281 | Human | Breast | IDC | 3.06e-06 | 3.65e-01 | 0.21 |
| 25984 | KRT23 | GSM4909285 | Human | Breast | IDC | 1.60e-12 | -4.05e-01 | 0.21 |
| 25984 | KRT23 | GSM4909286 | Human | Breast | IDC | 1.44e-05 | -2.02e-01 | 0.1081 |
| 25984 | KRT23 | GSM4909291 | Human | Breast | IDC | 2.70e-10 | -4.70e-01 | 0.1753 |
| 25984 | KRT23 | GSM4909293 | Human | Breast | IDC | 7.46e-13 | -4.26e-01 | 0.1581 |
| 25984 | KRT23 | GSM4909294 | Human | Breast | IDC | 1.32e-15 | -4.11e-01 | 0.2022 |
| 25984 | KRT23 | GSM4909295 | Human | Breast | IDC | 1.64e-05 | 4.97e-01 | 0.0898 |
| 25984 | KRT23 | GSM4909296 | Human | Breast | IDC | 1.84e-07 | -3.77e-01 | 0.1524 |
| 25984 | KRT23 | GSM4909297 | Human | Breast | IDC | 2.45e-13 | -3.88e-01 | 0.1517 |
| 25984 | KRT23 | GSM4909298 | Human | Breast | IDC | 1.81e-04 | -7.37e-02 | 0.1551 |
| 25984 | KRT23 | GSM4909301 | Human | Breast | IDC | 7.78e-22 | -4.65e-01 | 0.1577 |
| 25984 | KRT23 | GSM4909305 | Human | Breast | IDC | 4.45e-04 | 4.27e-01 | 0.0436 |
| 25984 | KRT23 | GSM4909308 | Human | Breast | IDC | 7.79e-07 | 4.75e-02 | 0.158 |
| 25984 | KRT23 | GSM4909311 | Human | Breast | IDC | 3.89e-11 | -3.98e-01 | 0.1534 |
| 25984 | KRT23 | GSM4909312 | Human | Breast | IDC | 3.43e-17 | -4.50e-01 | 0.1552 |
| 25984 | KRT23 | GSM4909315 | Human | Breast | IDC | 1.32e-08 | -3.84e-01 | 0.21 |
| 25984 | KRT23 | GSM4909319 | Human | Breast | IDC | 8.07e-15 | -2.87e-01 | 0.1563 |
| 25984 | KRT23 | GSM4909320 | Human | Breast | IDC | 1.59e-05 | -4.70e-01 | 0.1575 |
| 25984 | KRT23 | GSM4909321 | Human | Breast | IDC | 1.11e-10 | -3.96e-01 | 0.1559 |
| 25984 | KRT23 | brca1 | Human | Breast | Precancer | 1.62e-40 | 1.10e+00 | -0.0338 |
| Page: 1 2 3 4 5 6 |
| Tissue | Expression Dynamics | Abbreviation |
| Breast |  | IDC: Invasive ductal carcinoma |
| DCIS: Ductal carcinoma in situ | ||
| Precancer(BRCA1-mut): Precancerous lesion from BRCA1 mutation carriers | ||
| Colorectum (GSE201348) |  | FAP: Familial adenomatous polyposis |
| CRC: Colorectal cancer | ||
| Colorectum (HTA11) |  | AD: Adenomas |
| SER: Sessile serrated lesions | ||
| MSI-H: Microsatellite-high colorectal cancer | ||
| MSS: Microsatellite stable colorectal cancer | ||
| Esophagus |  | ESCC: Esophageal squamous cell carcinoma |
| HGIN: High-grade intraepithelial neoplasias | ||
| LGIN: Low-grade intraepithelial neoplasias | ||
| Liver | 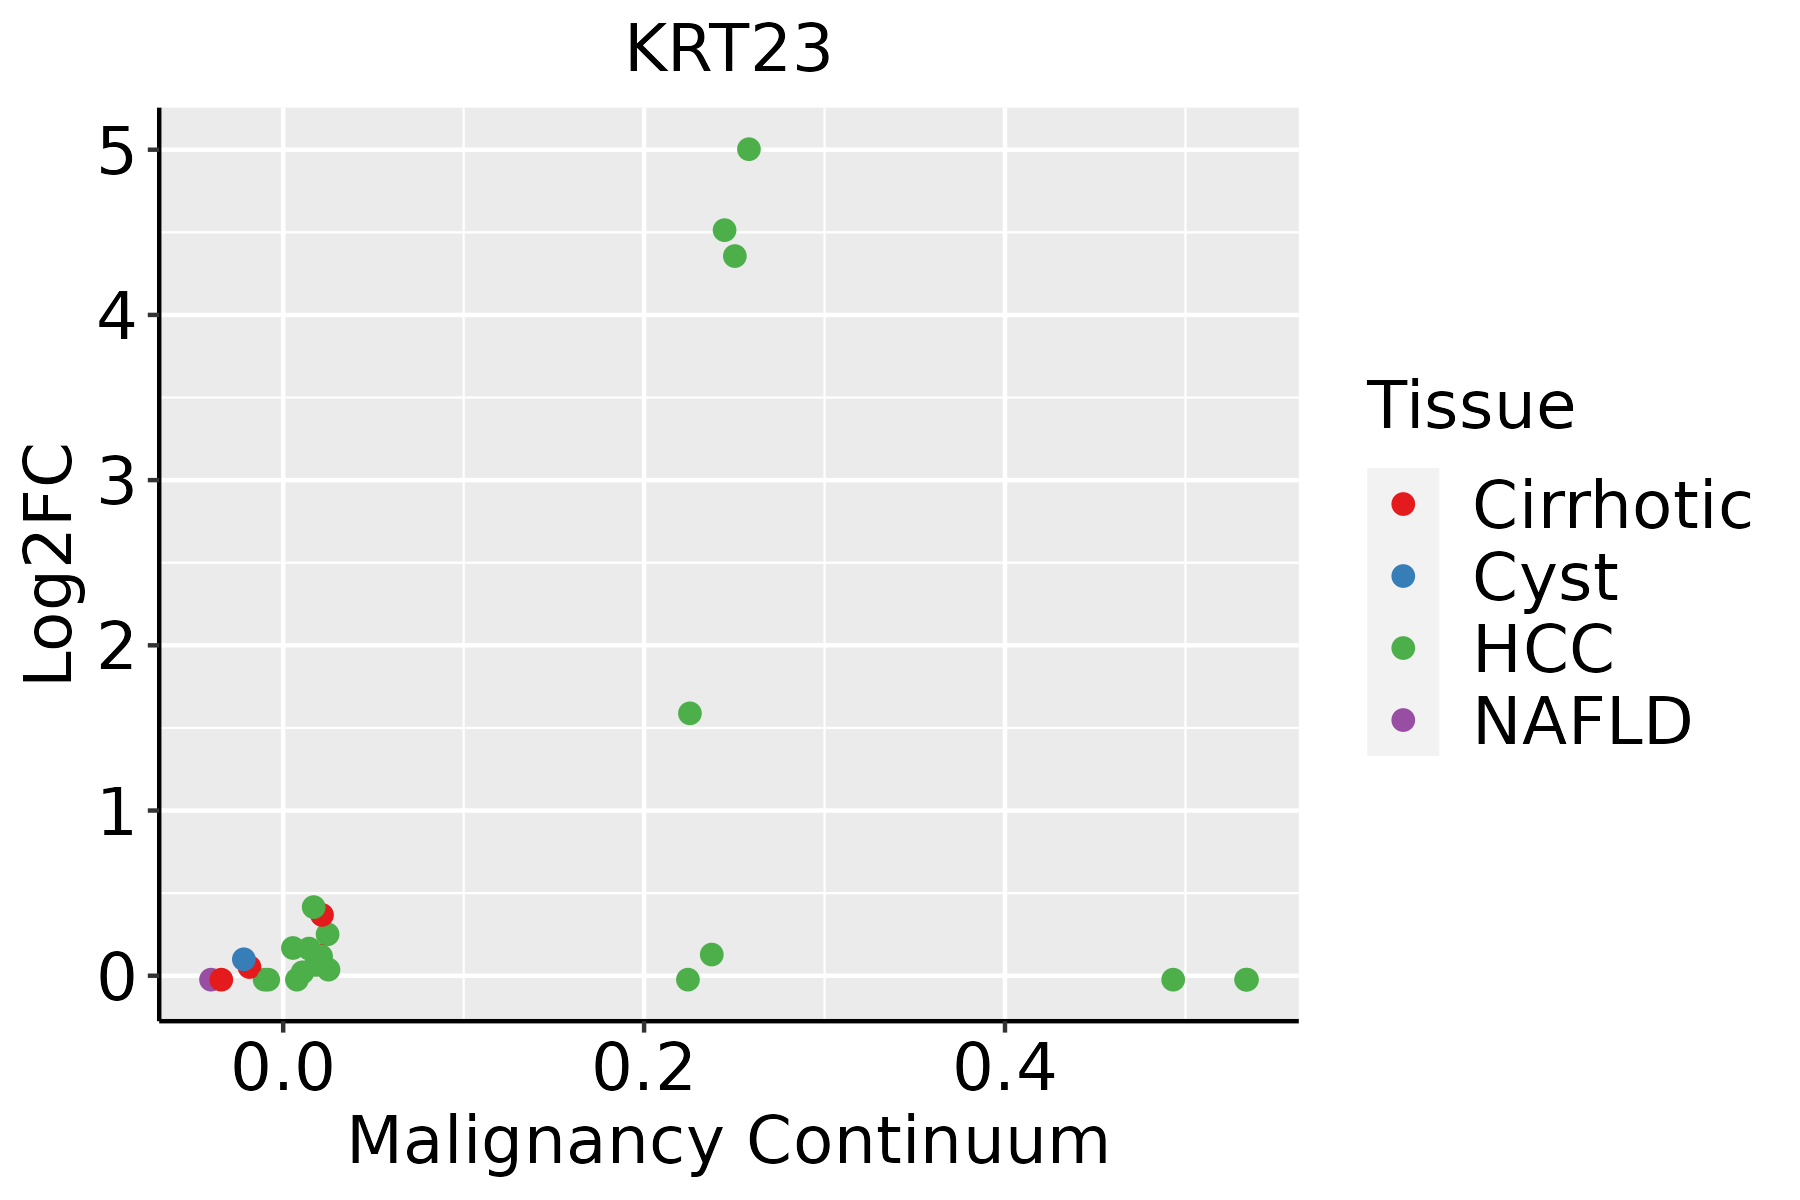 | HCC: Hepatocellular carcinoma |
| NAFLD: Non-alcoholic fatty liver disease | ||
| Oral Cavity |  | EOLP: Erosive Oral lichen planus |
| LP: leukoplakia | ||
| NEOLP: Non-erosive oral lichen planus | ||
| OSCC: Oral squamous cell carcinoma | ||
| Prostate | 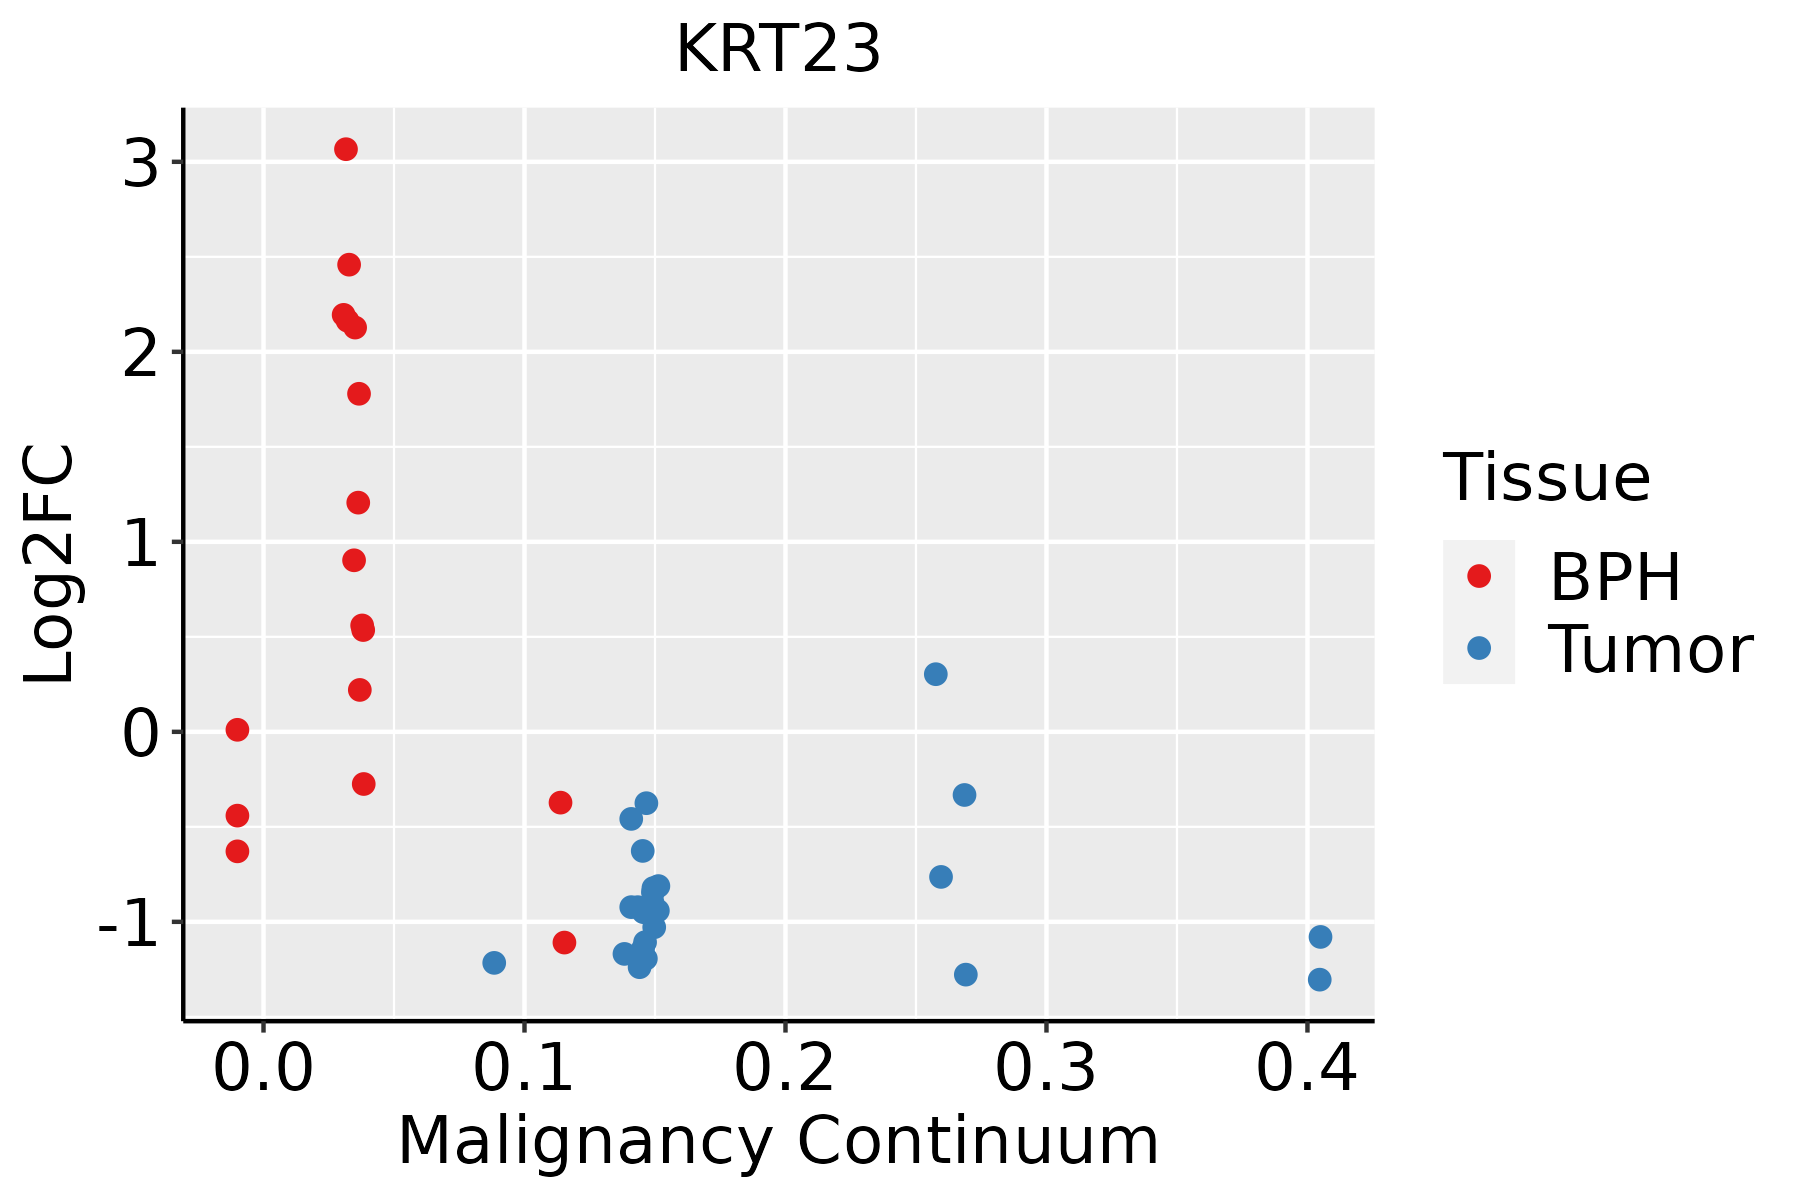 | BPH: Benign Prostatic Hyperplasia |
| Skin | 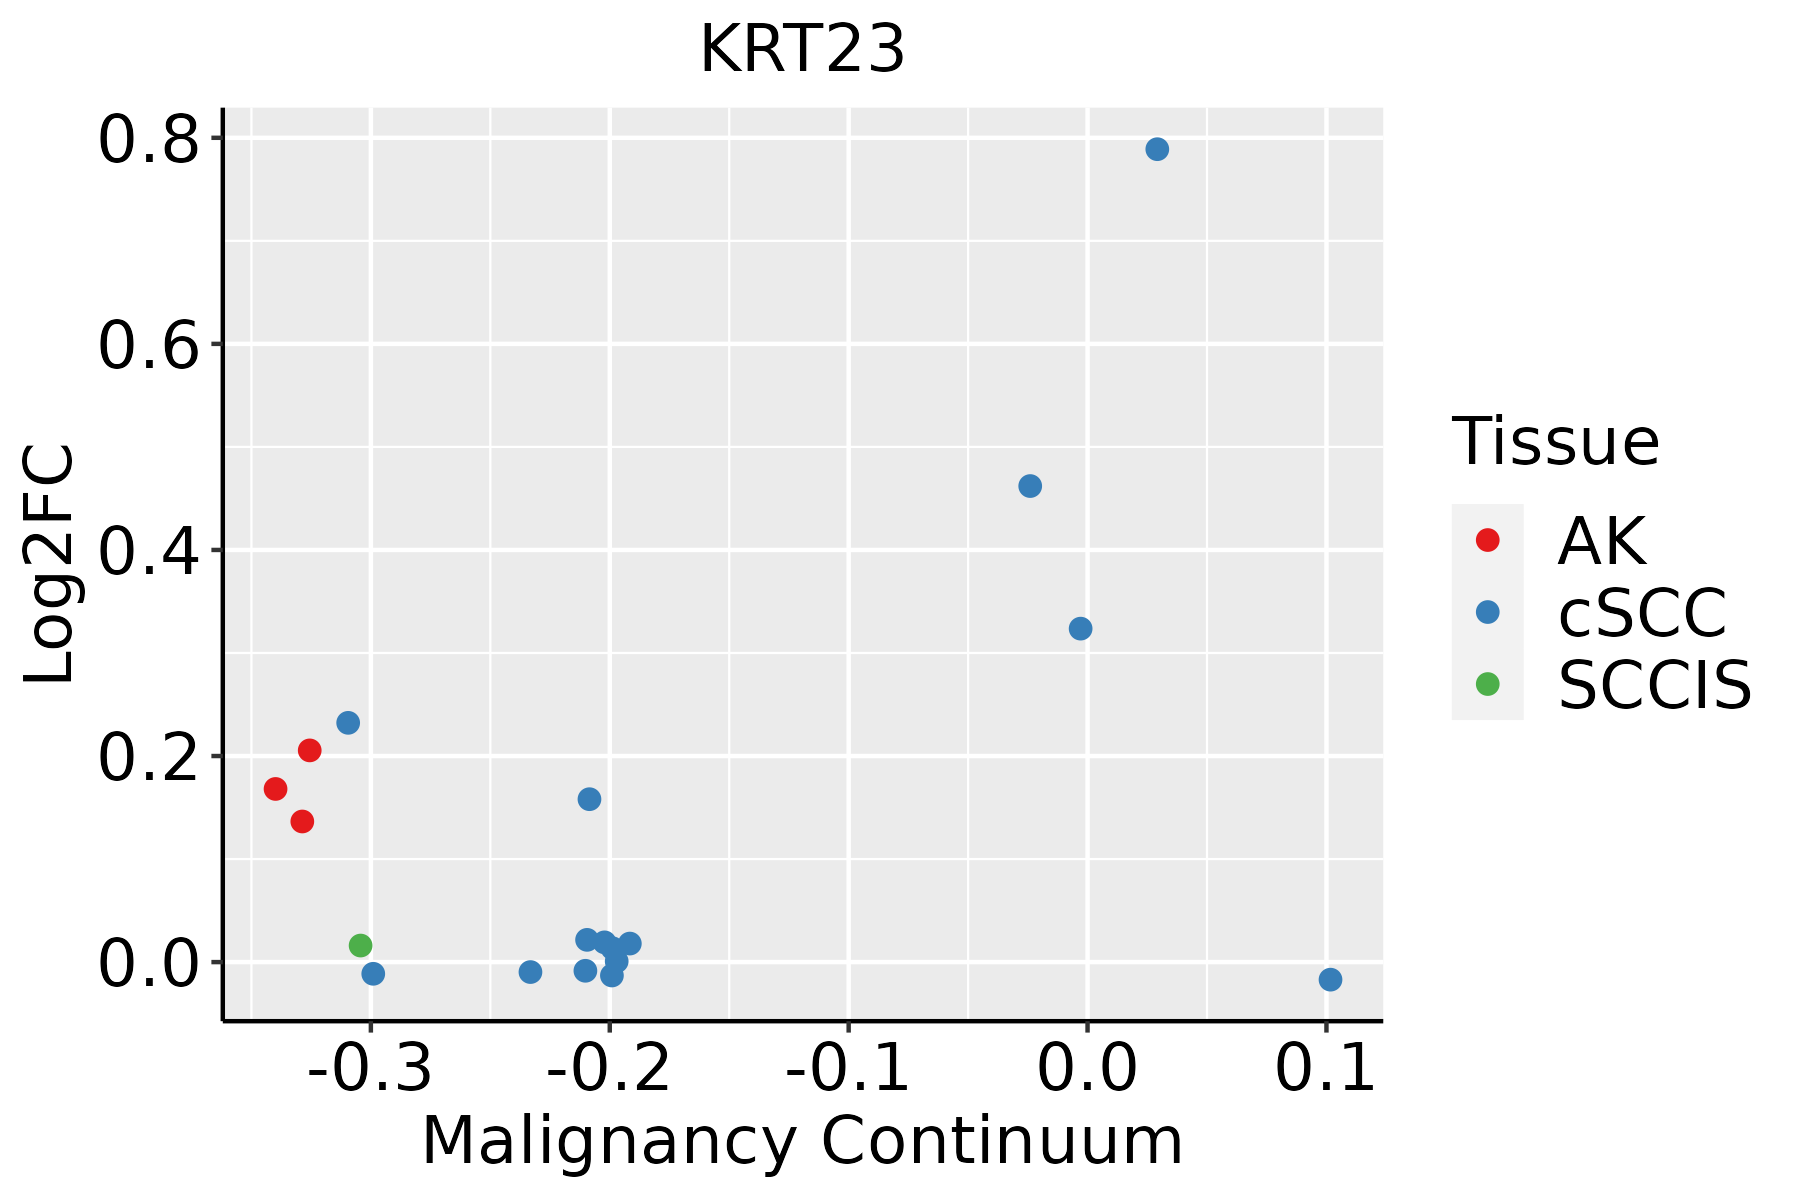 | AK: Actinic keratosis |
| cSCC: Cutaneous squamous cell carcinoma | ||
| SCCIS:squamous cell carcinoma in situ |
| ∗log2FC in expression of this searched gene in stem-like cells from each diseased tissue sample relative to stem-like cells in normal samples in each tissue plotted against the malignancy continuum. Samples are colored based on if they are from different disease stage. |
Top |
Malignant transformation related pathway analysis |
| Find out the enriched GO biological processes and KEGG pathways involved in transition from healthy to precancer to cancer |
| Tissue | Disease Stage | Enriched GO biological Processes |
| Colorectum | AD |  |
| Colorectum | SER |  |
| Colorectum | MSS |  |
| Colorectum | MSI-H |  |
| Colorectum | FAP |  |
| ∗Top 15 enriched GO BP terms are showed in the bar plot of each disease state in each tissue. Each row represents a significant GO biological process which is colored according to the -log10(p.adjust). |
| Page: 1 2 3 4 5 6 7 8 9 |
| GO ID | Tissue | Disease Stage | Description | Gene Ratio | Bg Ratio | pvalue | p.adjust | Count |
| Page: 1 |
| Pathway ID | Tissue | Disease Stage | Description | Gene Ratio | Bg Ratio | pvalue | p.adjust | qvalue | Count |
| hsa0491518 | Breast | Precancer | Estrogen signaling pathway | 28/684 | 138/8465 | 4.10e-06 | 5.39e-05 | 4.13e-05 | 28 |
| hsa0491519 | Breast | Precancer | Estrogen signaling pathway | 28/684 | 138/8465 | 4.10e-06 | 5.39e-05 | 4.13e-05 | 28 |
| hsa0491523 | Breast | IDC | Estrogen signaling pathway | 35/867 | 138/8465 | 2.55e-07 | 5.18e-06 | 3.88e-06 | 35 |
| hsa0491533 | Breast | IDC | Estrogen signaling pathway | 35/867 | 138/8465 | 2.55e-07 | 5.18e-06 | 3.88e-06 | 35 |
| hsa0491542 | Breast | DCIS | Estrogen signaling pathway | 35/846 | 138/8465 | 1.40e-07 | 2.51e-06 | 1.85e-06 | 35 |
| hsa05150 | Breast | DCIS | Staphylococcus aureus infection | 19/846 | 96/8465 | 2.68e-03 | 1.67e-02 | 1.23e-02 | 19 |
| hsa0491552 | Breast | DCIS | Estrogen signaling pathway | 35/846 | 138/8465 | 1.40e-07 | 2.51e-06 | 1.85e-06 | 35 |
| hsa051501 | Breast | DCIS | Staphylococcus aureus infection | 19/846 | 96/8465 | 2.68e-03 | 1.67e-02 | 1.23e-02 | 19 |
| hsa049152 | Colorectum | MSS | Estrogen signaling pathway | 48/1875 | 138/8465 | 4.23e-04 | 3.08e-03 | 1.89e-03 | 48 |
| hsa049153 | Colorectum | MSS | Estrogen signaling pathway | 48/1875 | 138/8465 | 4.23e-04 | 3.08e-03 | 1.89e-03 | 48 |
| hsa049154 | Colorectum | CRC | Estrogen signaling pathway | 29/1091 | 138/8465 | 4.83e-03 | 2.66e-02 | 1.80e-02 | 29 |
| hsa049155 | Colorectum | CRC | Estrogen signaling pathway | 29/1091 | 138/8465 | 4.83e-03 | 2.66e-02 | 1.80e-02 | 29 |
| hsa0491527 | Prostate | BPH | Estrogen signaling pathway | 48/1718 | 138/8465 | 4.60e-05 | 3.16e-04 | 1.96e-04 | 48 |
| hsa04915112 | Prostate | BPH | Estrogen signaling pathway | 48/1718 | 138/8465 | 4.60e-05 | 3.16e-04 | 1.96e-04 | 48 |
| hsa0491528 | Prostate | Tumor | Estrogen signaling pathway | 48/1791 | 138/8465 | 1.36e-04 | 8.33e-04 | 5.17e-04 | 48 |
| hsa0491536 | Prostate | Tumor | Estrogen signaling pathway | 48/1791 | 138/8465 | 1.36e-04 | 8.33e-04 | 5.17e-04 | 48 |
| Page: 1 |
Top |
Cell-cell communication analysis |
| Identification of potential cell-cell interactions between two cell types and their ligand-receptor pairs for different disease states |
| Ligand | Receptor | LRpair | Pathway | Tissue | Disease Stage |
| Page: 1 |
Top |
Single-cell gene regulatory network inference analysis |
| Find out the significant the regulons (TFs) and the target genes of each regulon across cell types for different disease states |
| TF | Cell Type | Tissue | Disease Stage | Target Gene | RSS | Regulon Activity |
| ∗The dot plots of a searched regulon are shown for all cell subpopulations in each disease state of each tissue based on the regulon specific score inferred using pySCENIC and by calculating the average expression. |
| Page: 1 |
Top |
Somatic mutation of malignant transformation related genes |
| Annotation of somatic variants for genes involved in malignant transformation |
| Hugo Symbol | Variant Class | Variant Classification | dbSNP RS | HGVSc | HGVSp | HGVSp Short | SWISSPROT | BIOTYPE | SIFT | PolyPhen | Tumor Sample Barcode | Tissue | Histology | Sex | Age | Stage | Therapy Types | Drugs | Outcome |
| KRT23 | SNV | Missense_Mutation | c.604N>C | p.Glu202Gln | p.E202Q | Q9C075 | protein_coding | deleterious(0) | probably_damaging(0.999) | TCGA-AC-A23H-01 | Breast | breast invasive carcinoma | Female | >=65 | I/II | Unknown | Unknown | PD | |
| KRT23 | SNV | Missense_Mutation | c.484N>A | p.Glu162Lys | p.E162K | Q9C075 | protein_coding | deleterious(0) | possibly_damaging(0.894) | TCGA-AC-A23H-01 | Breast | breast invasive carcinoma | Female | >=65 | I/II | Unknown | Unknown | PD | |
| KRT23 | insertion | Frame_Shift_Ins | novel | c.769_770insTTGCAACTGGACTTATTGGGTTGTGCTG | p.Arg257LeufsTer17 | p.R257Lfs*17 | Q9C075 | protein_coding | TCGA-C8-A12M-01 | Breast | breast invasive carcinoma | Female | >=65 | I/II | Unknown | Unknown | SD | ||
| KRT23 | insertion | In_Frame_Ins | novel | c.767_768insACTTGGTAGAGCATG | p.His256delinsGlnLeuGlyArgAlaCys | p.H256delinsQLGRAC | Q9C075 | protein_coding | TCGA-C8-A12M-01 | Breast | breast invasive carcinoma | Female | >=65 | I/II | Unknown | Unknown | SD | ||
| KRT23 | deletion | Frame_Shift_Del | novel | c.42delC | p.Phe15SerfsTer54 | p.F15Sfs*54 | Q9C075 | protein_coding | TCGA-EW-A2FV-01 | Breast | breast invasive carcinoma | Female | <65 | III/IV | Chemotherapy | docetaxel | SD | ||
| KRT23 | SNV | Missense_Mutation | novel | c.955N>A | p.Gln319Lys | p.Q319K | Q9C075 | protein_coding | tolerated(0.21) | benign(0.001) | TCGA-C5-A8YQ-01 | Cervix | cervical & endocervical cancer | Female | >=65 | I/II | Chemotherapy | cisplatin | PD |
| KRT23 | SNV | Missense_Mutation | c.146N>T | p.Thr49Met | p.T49M | Q9C075 | protein_coding | tolerated(0.13) | benign(0.27) | TCGA-A6-4105-01 | Colorectum | colon adenocarcinoma | Male | >=65 | I/II | Unknown | Unknown | PD | |
| KRT23 | SNV | Missense_Mutation | rs138435929 | c.245N>A | p.Arg82His | p.R82H | Q9C075 | protein_coding | deleterious(0) | probably_damaging(1) | TCGA-A6-6653-01 | Colorectum | colon adenocarcinoma | Male | >=65 | I/II | Unknown | Unknown | SD |
| KRT23 | SNV | Missense_Mutation | rs141349810 | c.1022N>T | p.Thr341Met | p.T341M | Q9C075 | protein_coding | tolerated(0.34) | benign(0) | TCGA-AD-5900-01 | Colorectum | colon adenocarcinoma | Male | >=65 | I/II | Unknown | Unknown | SD |
| KRT23 | SNV | Missense_Mutation | rs746484267 | c.113C>T | p.Ala38Val | p.A38V | Q9C075 | protein_coding | tolerated(0.13) | possibly_damaging(0.869) | TCGA-AU-6004-01 | Colorectum | colon adenocarcinoma | Female | >=65 | I/II | Unknown | Unknown | SD |
| Page: 1 2 3 4 5 6 7 |
Top |
Related drugs of malignant transformation related genes |
| Identification of chemicals and drugs interact with genes involved in malignant transfromation |
| (DGIdb 4.0) |
| Entrez ID | Symbol | Category | Interaction Types | Drug Claim Name | Drug Name | PMIDs |
| Page: 1 |

Copyright 2023-Present -The University of Texas Health Science Center at Houston |