
|
|||||
|
 | |
| |
| |
| |
| |
| |
|
Gene: KRT18 |
Gene summary for KRT18 |
| Gene information | Species | Human | Gene symbol | KRT18 | Gene ID | 3875 |
| Gene name | keratin 18 | |
| Gene Alias | CK-18 | |
| Cytomap | 12q13.13 | |
| Gene Type | protein-coding | GO ID | GO:0001889 | UniProtAcc | A0A024RAY2 |
Top |
Malignant transformation analysis |
| Identification of the aberrant gene expression in precancerous and cancerous lesions by comparing the gene expression of stem-like cells in diseased tissues with normal stem cells |
| Entrez ID | Symbol | Replicates | Species | Organ | Tissue | Adj P-value | Log2FC | Malignancy |
| 3875 | KRT18 | GSM4909280 | Human | Breast | Precancer | 6.13e-05 | 8.09e-02 | 0.0305 |
| 3875 | KRT18 | GSM4909281 | Human | Breast | IDC | 3.56e-22 | -5.74e-01 | 0.21 |
| 3875 | KRT18 | GSM4909282 | Human | Breast | IDC | 6.57e-13 | -4.59e-01 | -0.0288 |
| 3875 | KRT18 | GSM4909286 | Human | Breast | IDC | 1.80e-24 | -5.82e-01 | 0.1081 |
| 3875 | KRT18 | GSM4909287 | Human | Breast | IDC | 4.83e-09 | -4.77e-01 | 0.2057 |
| 3875 | KRT18 | GSM4909288 | Human | Breast | IDC | 1.29e-02 | -3.45e-01 | 0.0988 |
| 3875 | KRT18 | GSM4909291 | Human | Breast | IDC | 2.24e-21 | 4.72e-01 | 0.1753 |
| 3875 | KRT18 | GSM4909294 | Human | Breast | IDC | 1.18e-42 | 3.57e-01 | 0.2022 |
| 3875 | KRT18 | GSM4909296 | Human | Breast | IDC | 3.48e-23 | 2.30e-01 | 0.1524 |
| 3875 | KRT18 | GSM4909297 | Human | Breast | IDC | 7.39e-65 | 5.05e-01 | 0.1517 |
| 3875 | KRT18 | GSM4909301 | Human | Breast | IDC | 2.28e-02 | 9.48e-02 | 0.1577 |
| 3875 | KRT18 | GSM4909302 | Human | Breast | IDC | 1.17e-10 | 2.05e-01 | 0.1545 |
| 3875 | KRT18 | GSM4909304 | Human | Breast | IDC | 1.10e-23 | 3.90e-01 | 0.1636 |
| 3875 | KRT18 | GSM4909305 | Human | Breast | IDC | 2.61e-06 | 2.89e-01 | 0.0436 |
| 3875 | KRT18 | GSM4909306 | Human | Breast | IDC | 1.20e-34 | 4.93e-01 | 0.1564 |
| 3875 | KRT18 | GSM4909308 | Human | Breast | IDC | 1.11e-21 | 4.17e-01 | 0.158 |
| 3875 | KRT18 | GSM4909309 | Human | Breast | IDC | 4.30e-08 | 1.84e-01 | 0.0483 |
| 3875 | KRT18 | GSM4909311 | Human | Breast | IDC | 1.68e-51 | -4.04e-02 | 0.1534 |
| 3875 | KRT18 | GSM4909312 | Human | Breast | IDC | 4.20e-31 | 4.09e-01 | 0.1552 |
| 3875 | KRT18 | GSM4909313 | Human | Breast | IDC | 1.68e-05 | 1.46e-01 | 0.0391 |
| Page: 1 2 3 4 5 6 7 8 9 10 11 12 13 14 15 16 17 18 |
| Tissue | Expression Dynamics | Abbreviation |
| Breast | 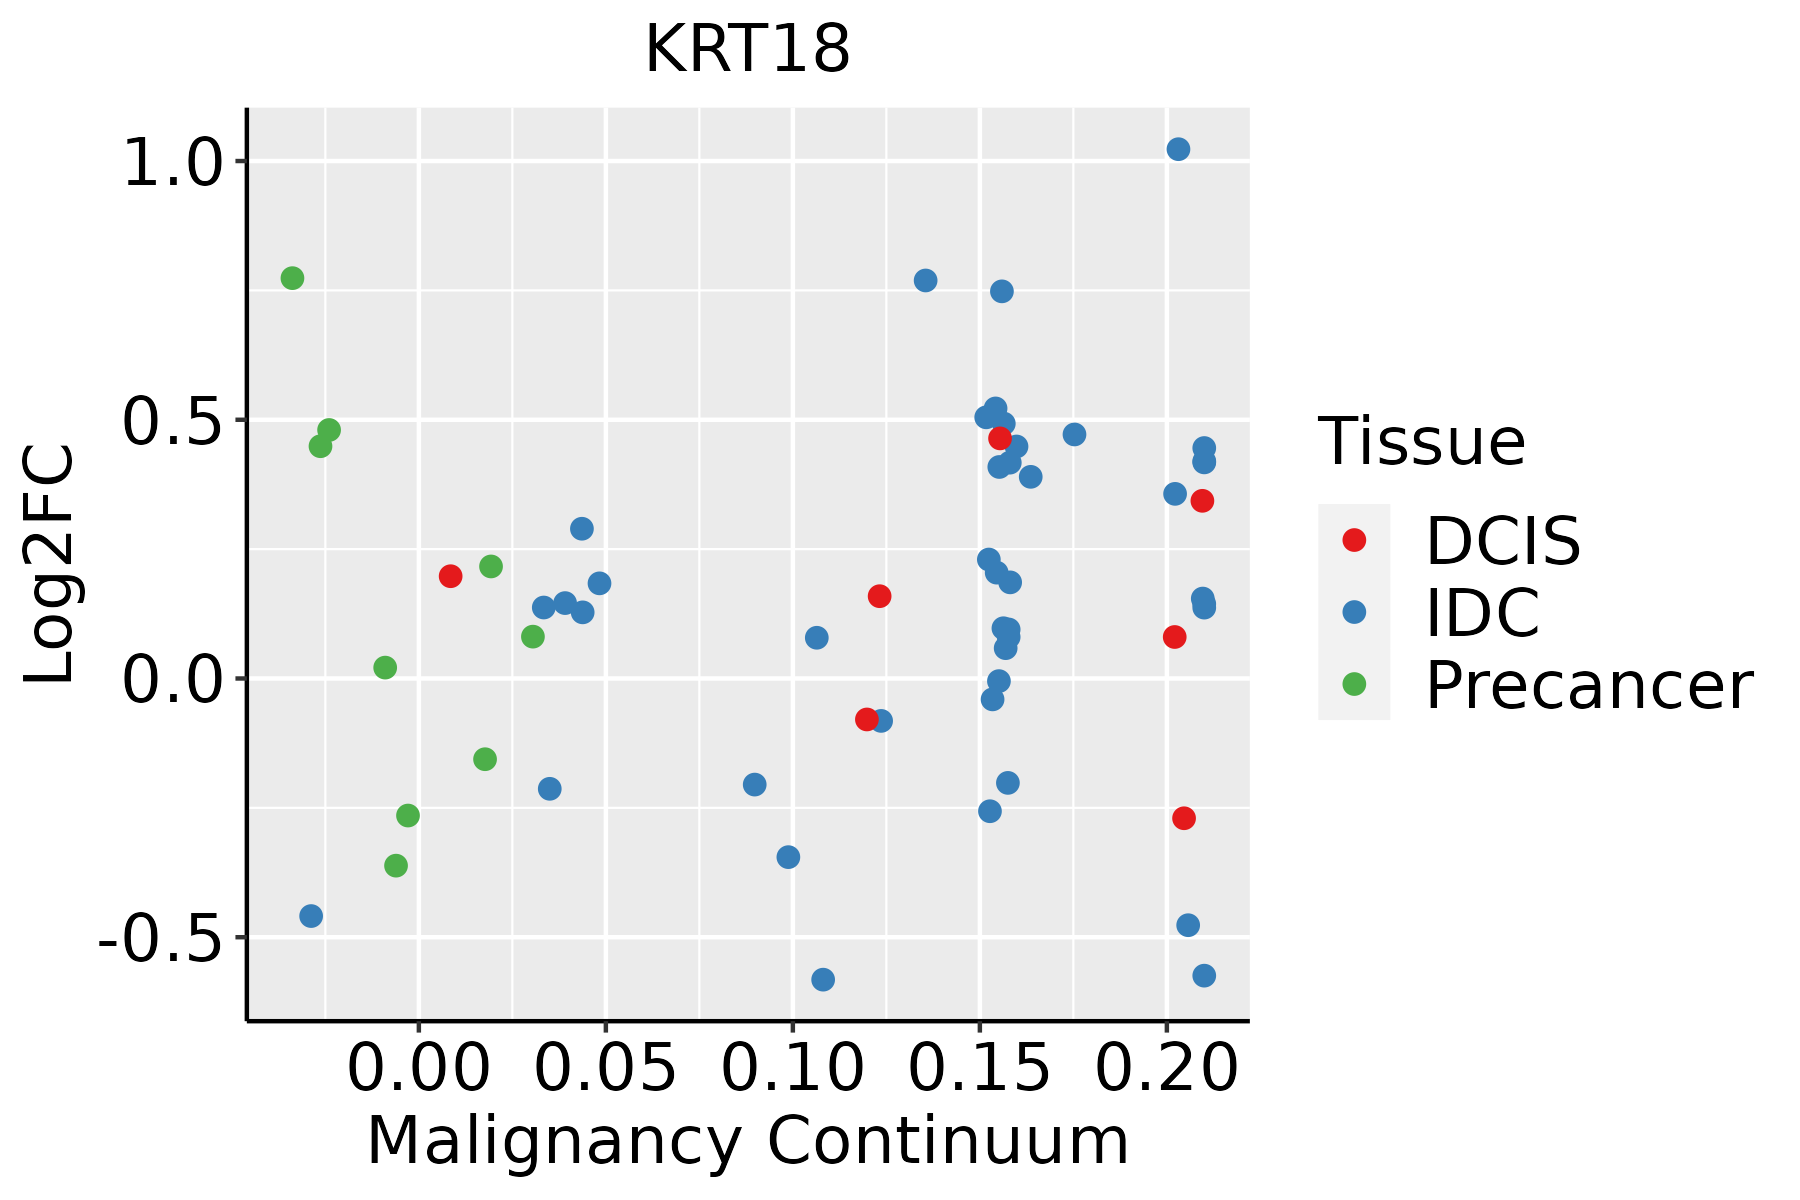 | IDC: Invasive ductal carcinoma |
| DCIS: Ductal carcinoma in situ | ||
| Precancer(BRCA1-mut): Precancerous lesion from BRCA1 mutation carriers | ||
| Cervix | 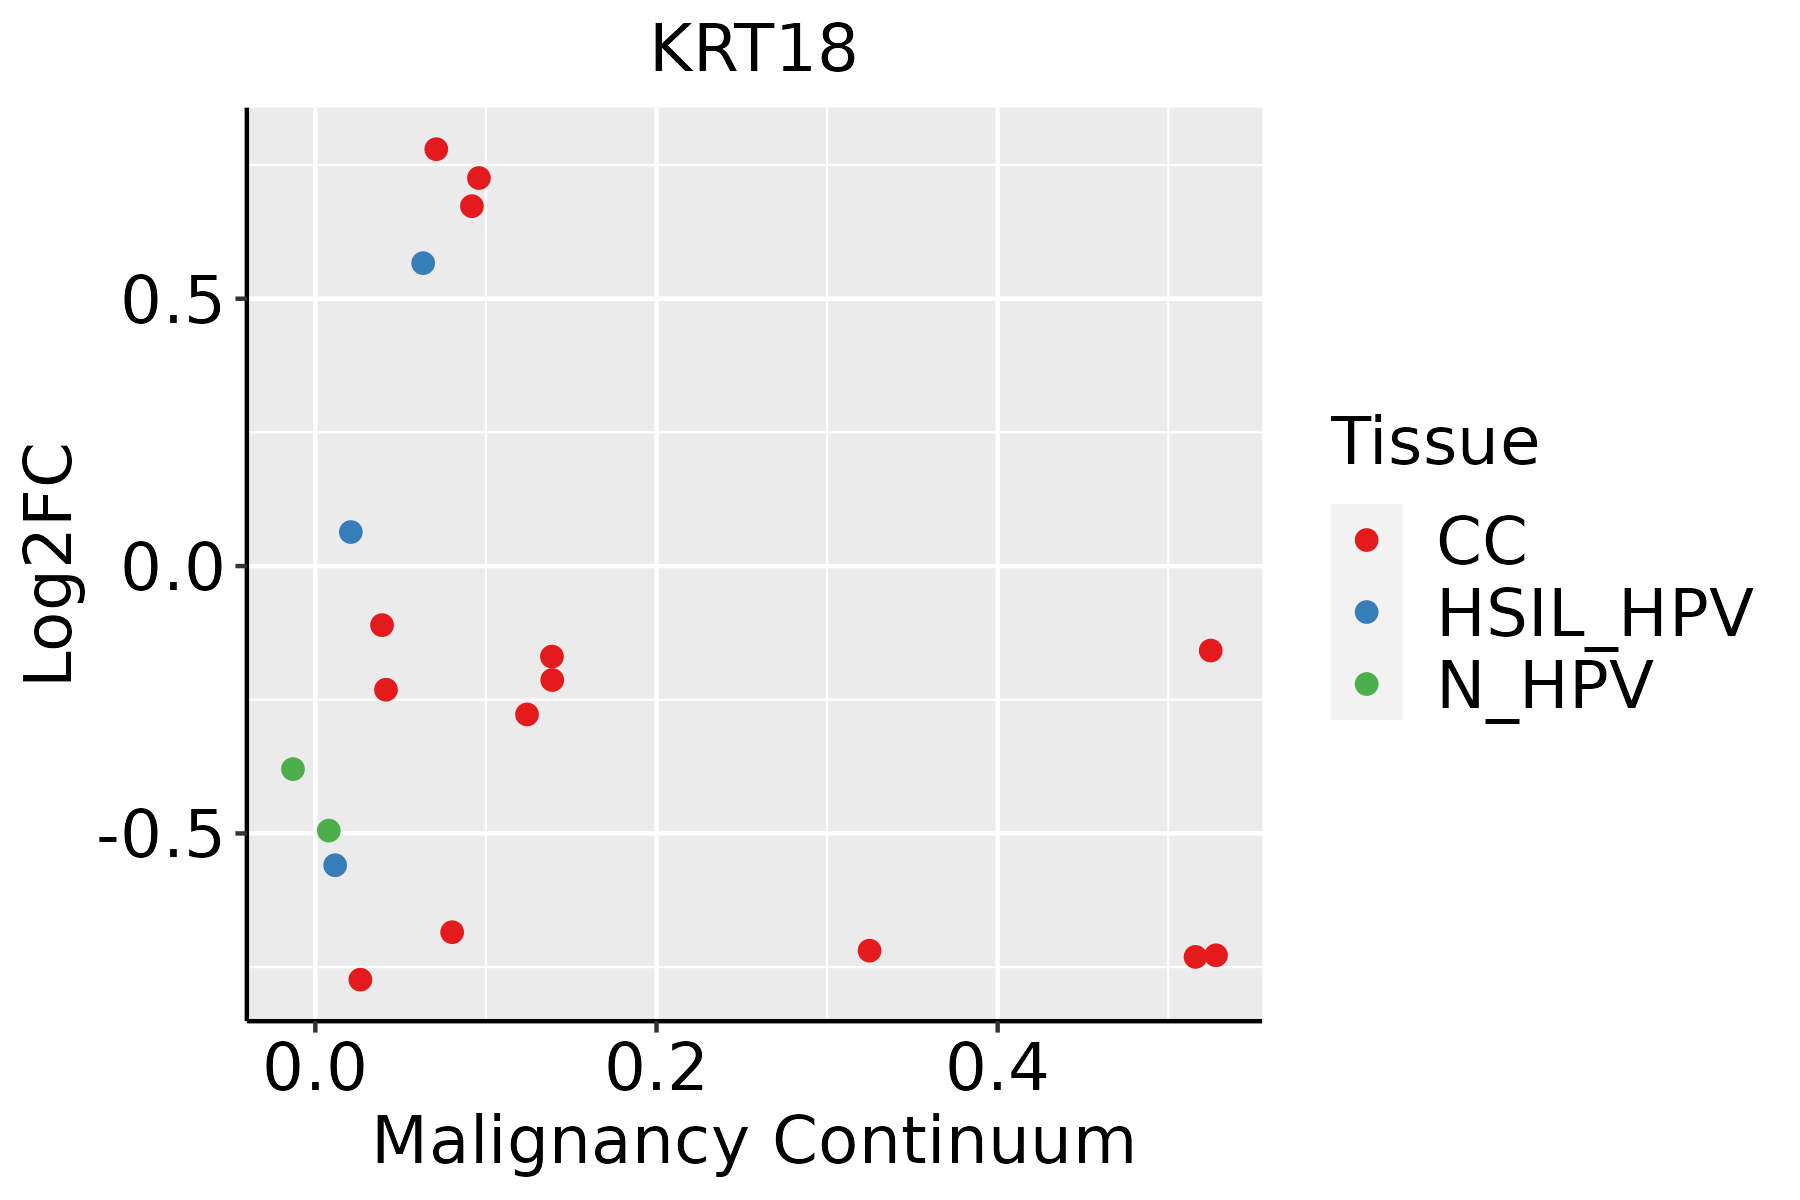 | CC: Cervix cancer |
| HSIL_HPV: HPV-infected high-grade squamous intraepithelial lesions | ||
| N_HPV: HPV-infected normal cervix | ||
| Colorectum (GSE201348) |  | FAP: Familial adenomatous polyposis |
| CRC: Colorectal cancer | ||
| Colorectum (HTA11) |  | AD: Adenomas |
| SER: Sessile serrated lesions | ||
| MSI-H: Microsatellite-high colorectal cancer | ||
| MSS: Microsatellite stable colorectal cancer | ||
| Endometrium | 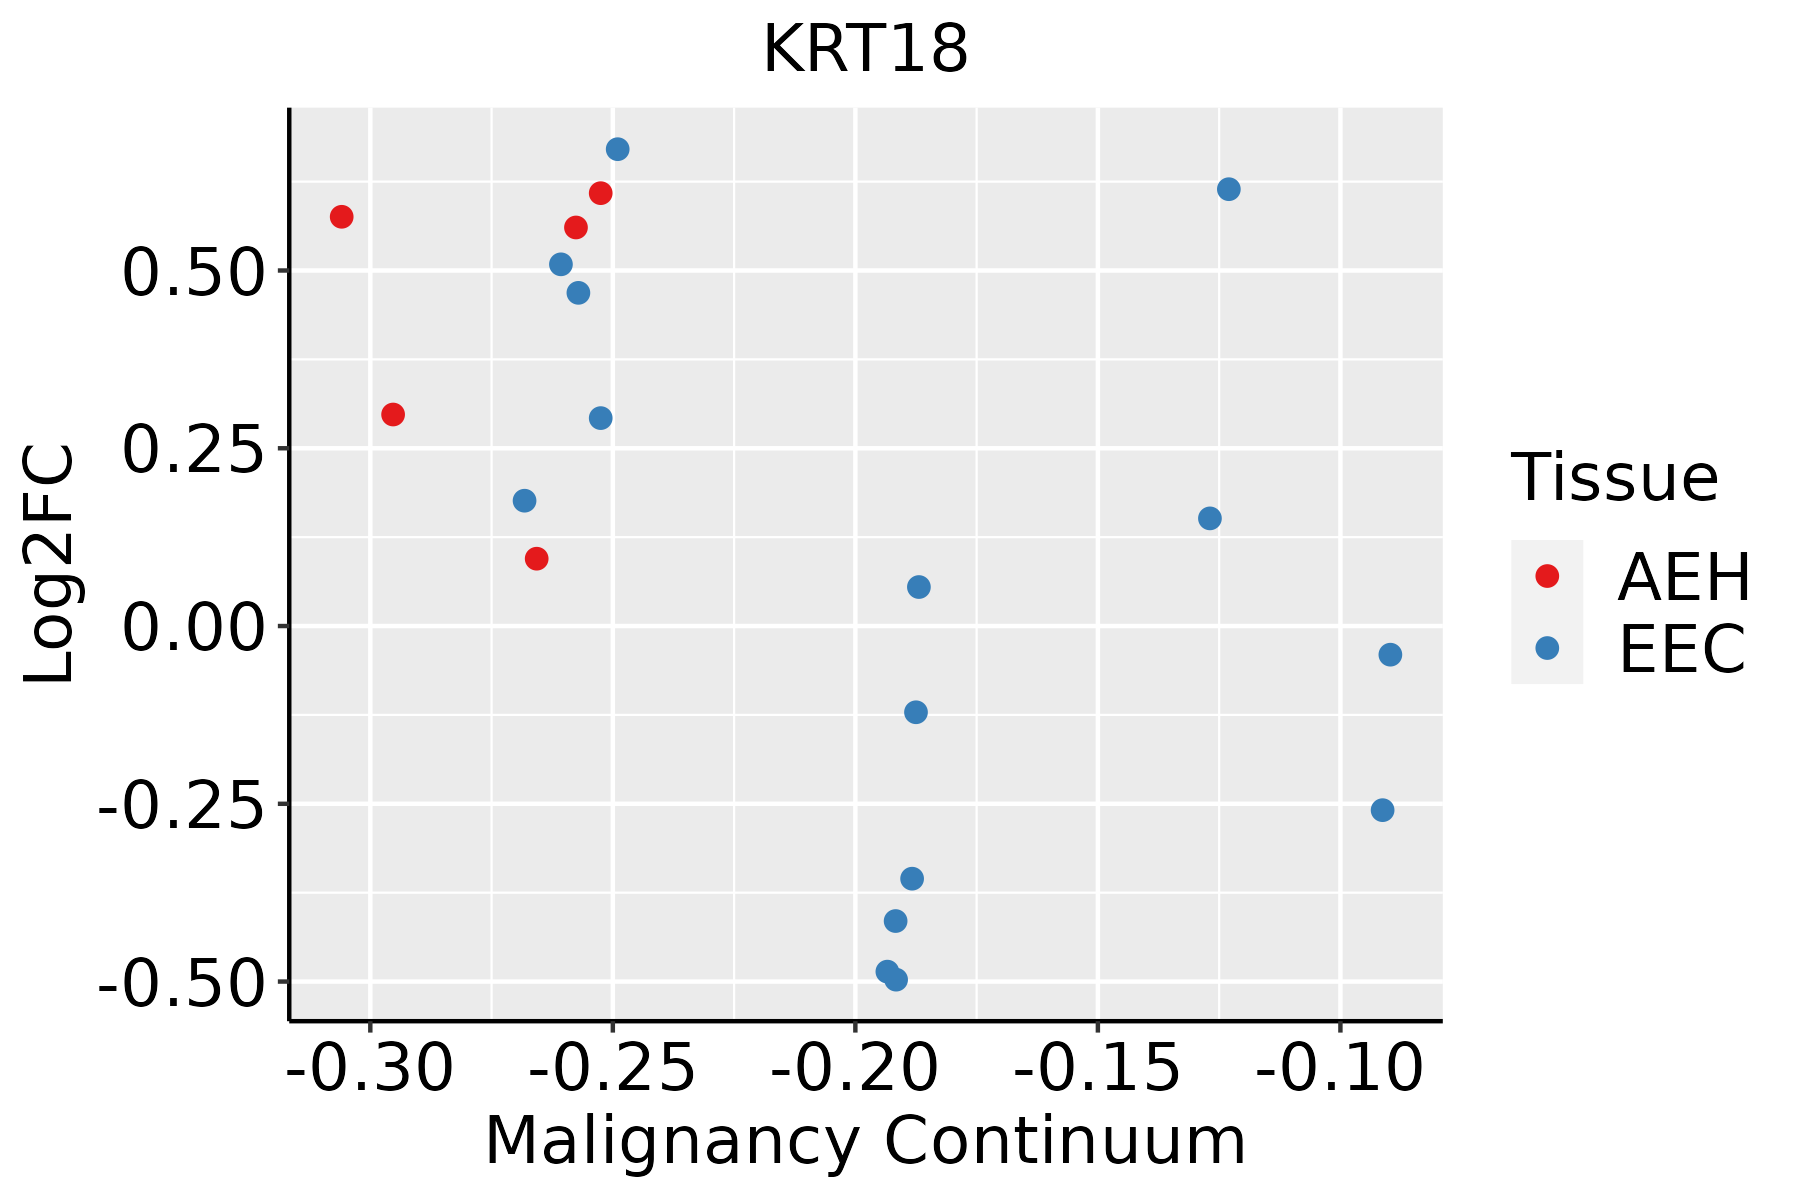 | AEH: Atypical endometrial hyperplasia |
| EEC: Endometrioid Cancer | ||
| Esophagus | 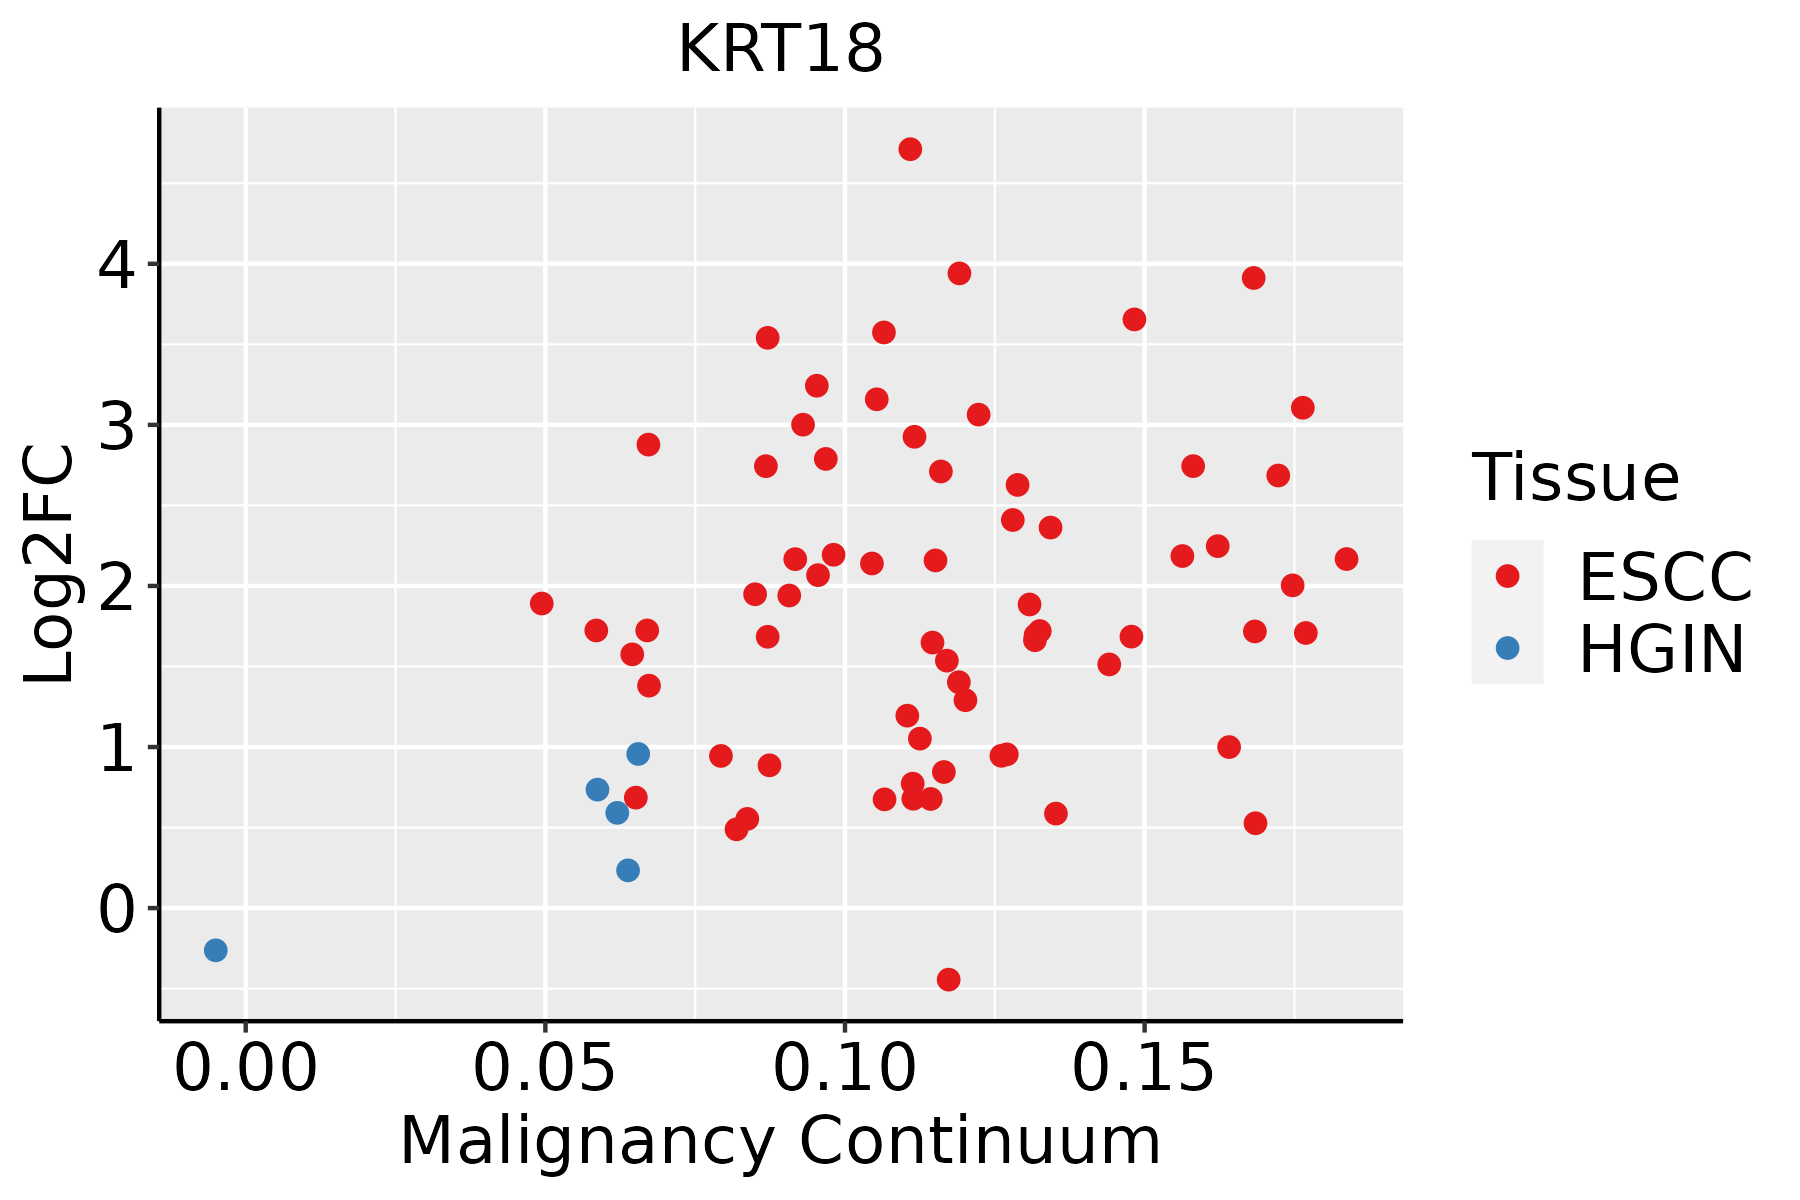 | ESCC: Esophageal squamous cell carcinoma |
| HGIN: High-grade intraepithelial neoplasias | ||
| LGIN: Low-grade intraepithelial neoplasias | ||
| GC |  | CAG: Chronic atrophic gastritis |
| CAG with IM: Chronic atrophic gastritis with intestinal metaplasia | ||
| CSG: Chronic superficial gastritis | ||
| GC: Gastric cancer | ||
| SIM: Severe intestinal metaplasia | ||
| WIM: Wild intestinal metaplasia | ||
| Liver |  | HCC: Hepatocellular carcinoma |
| NAFLD: Non-alcoholic fatty liver disease | ||
| Lung | 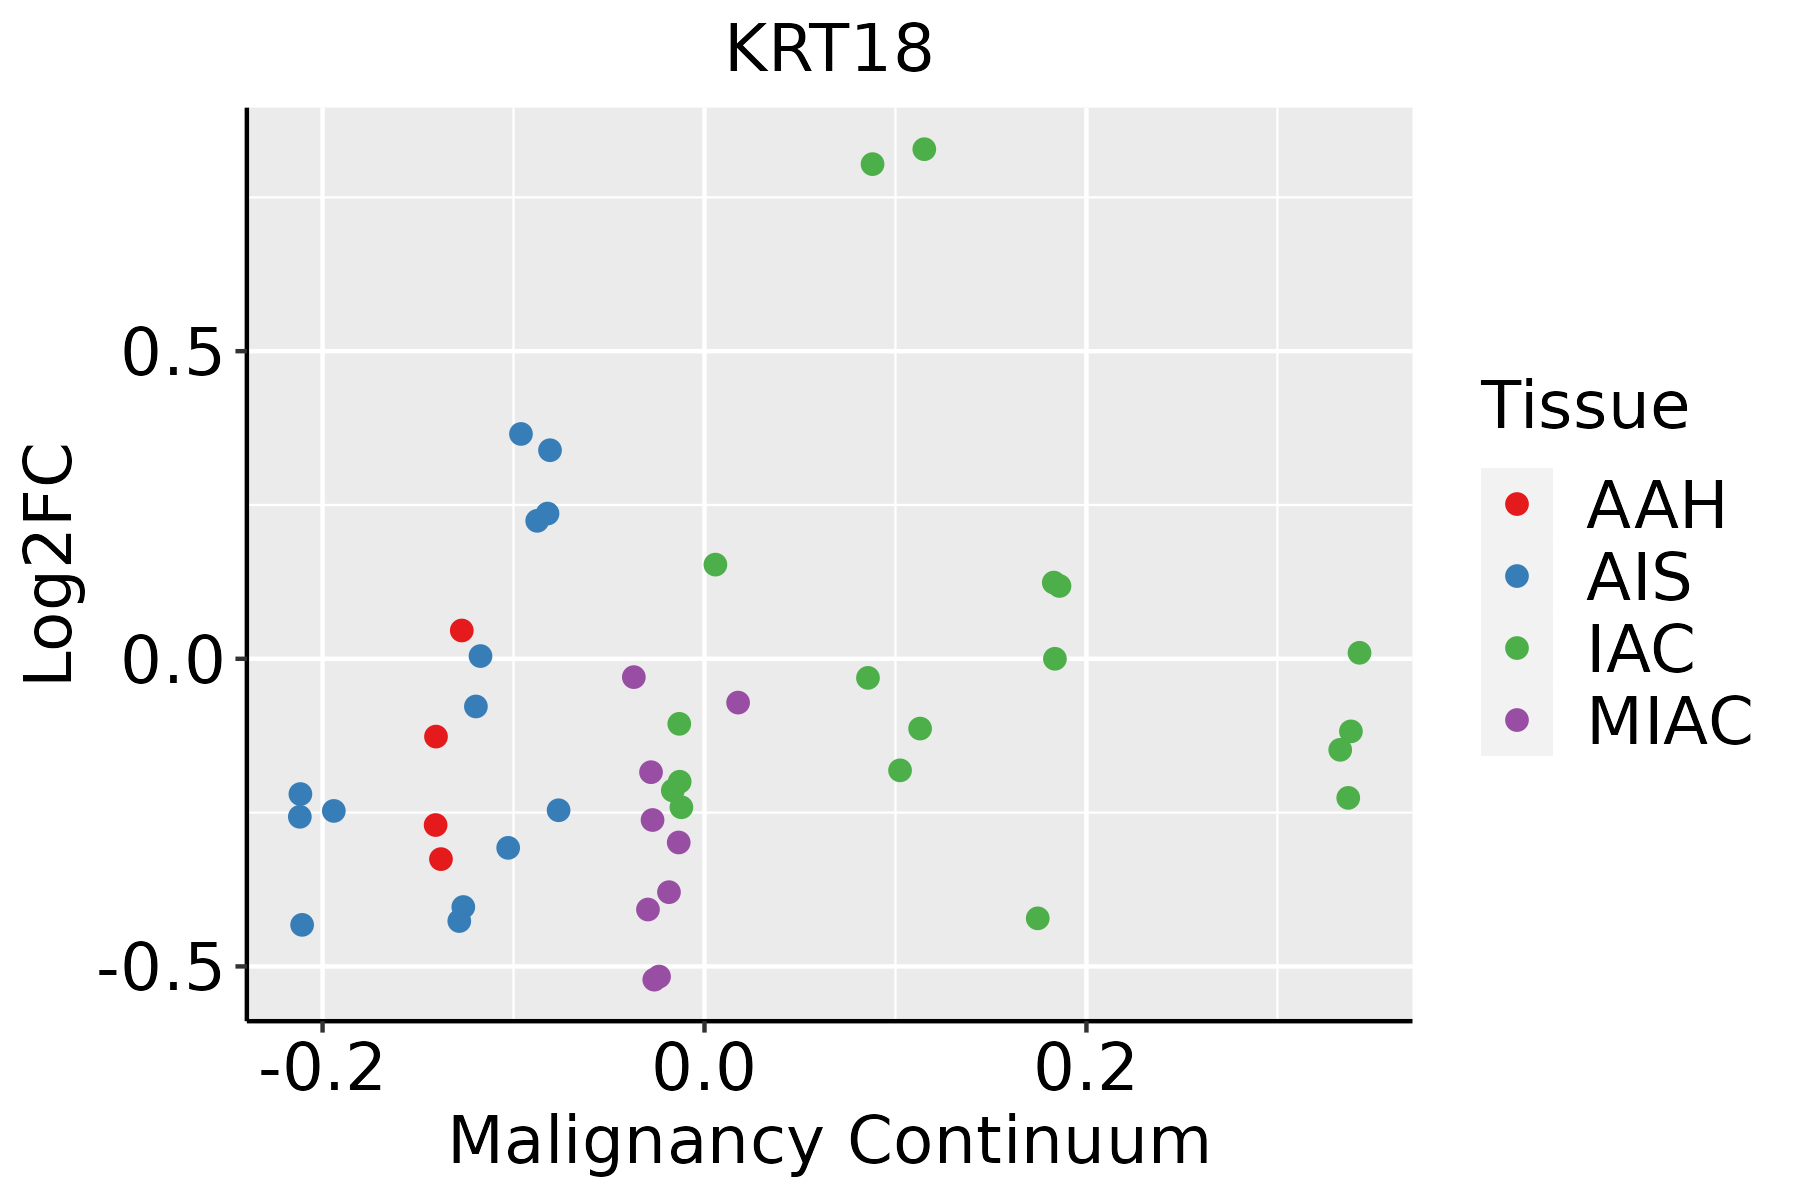 | AAH: Atypical adenomatous hyperplasia |
| AIS: Adenocarcinoma in situ | ||
| IAC: Invasive lung adenocarcinoma | ||
| MIA: Minimally invasive adenocarcinoma | ||
| Oral Cavity | 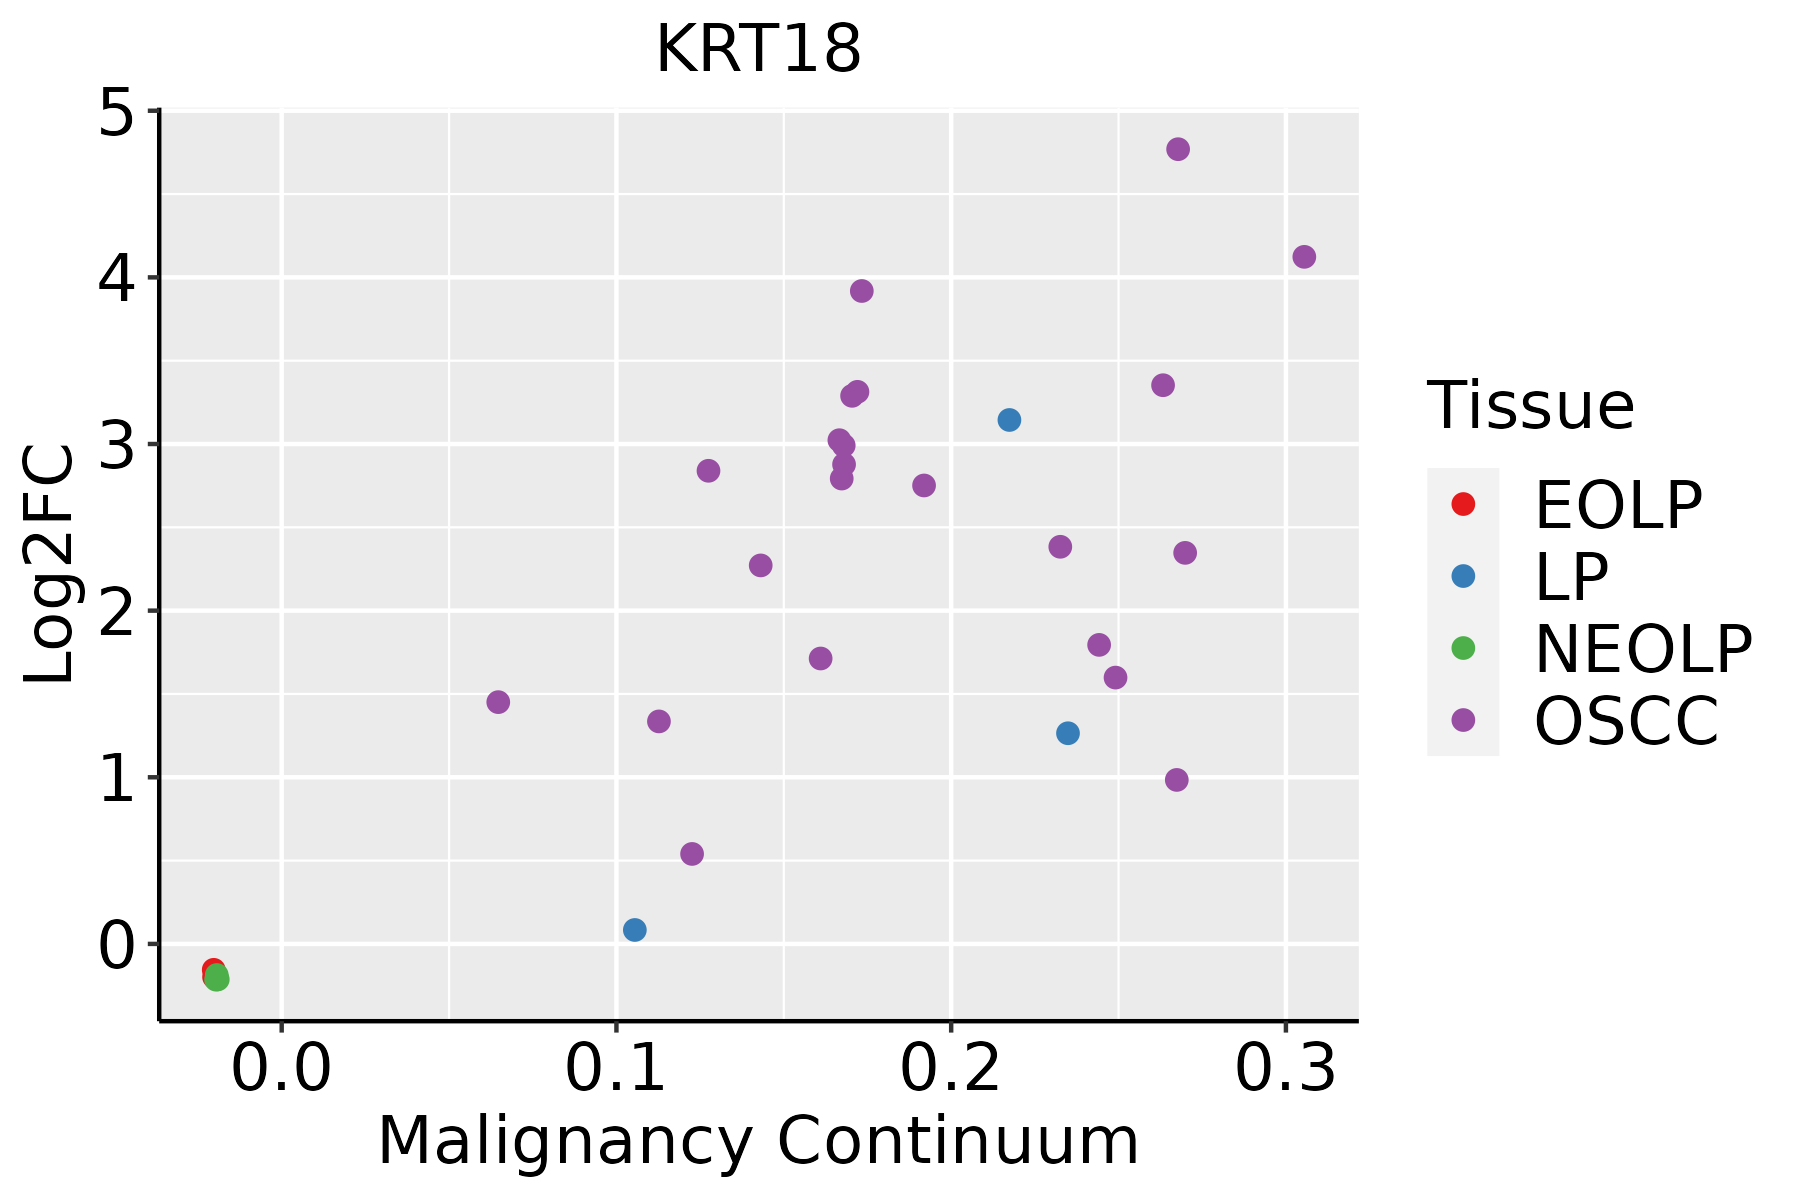 | EOLP: Erosive Oral lichen planus |
| LP: leukoplakia | ||
| NEOLP: Non-erosive oral lichen planus | ||
| OSCC: Oral squamous cell carcinoma | ||
| Prostate | 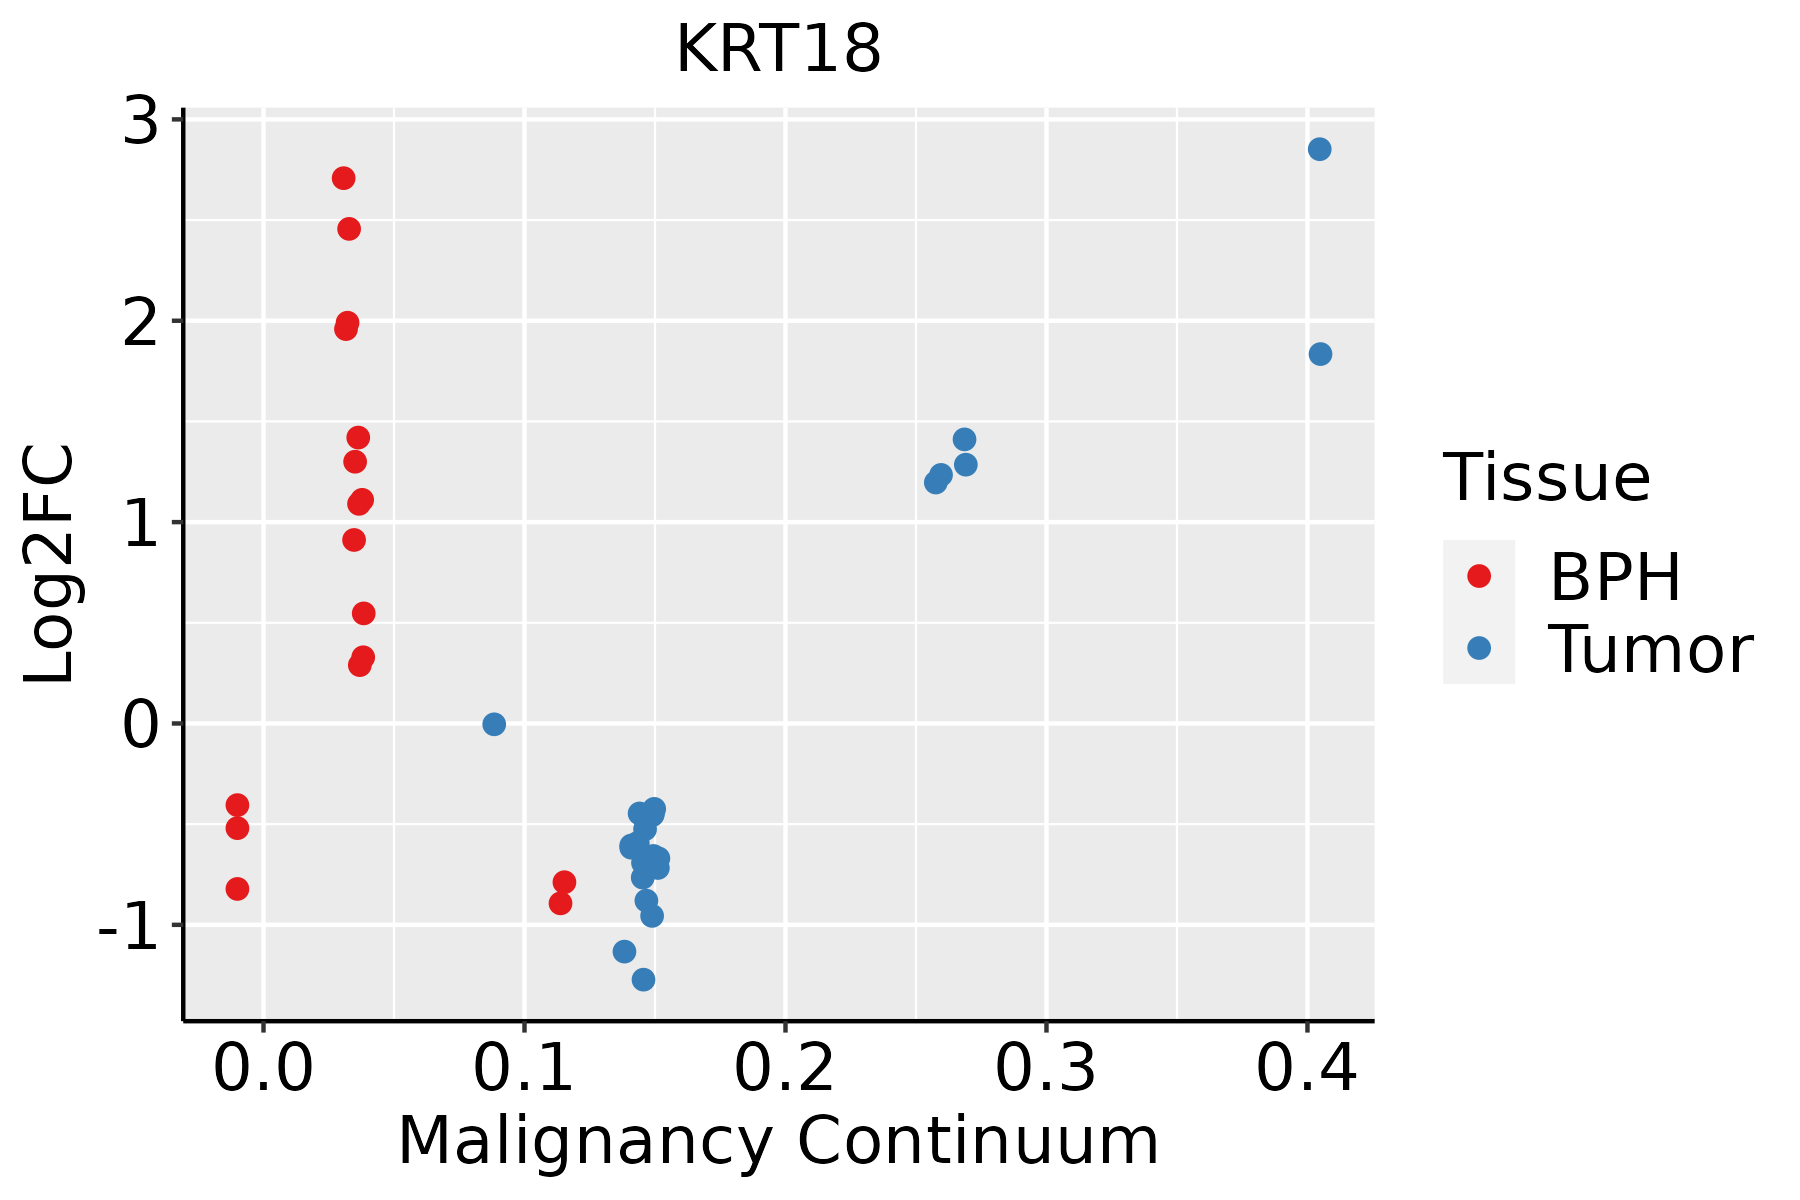 | BPH: Benign Prostatic Hyperplasia |
| Skin | 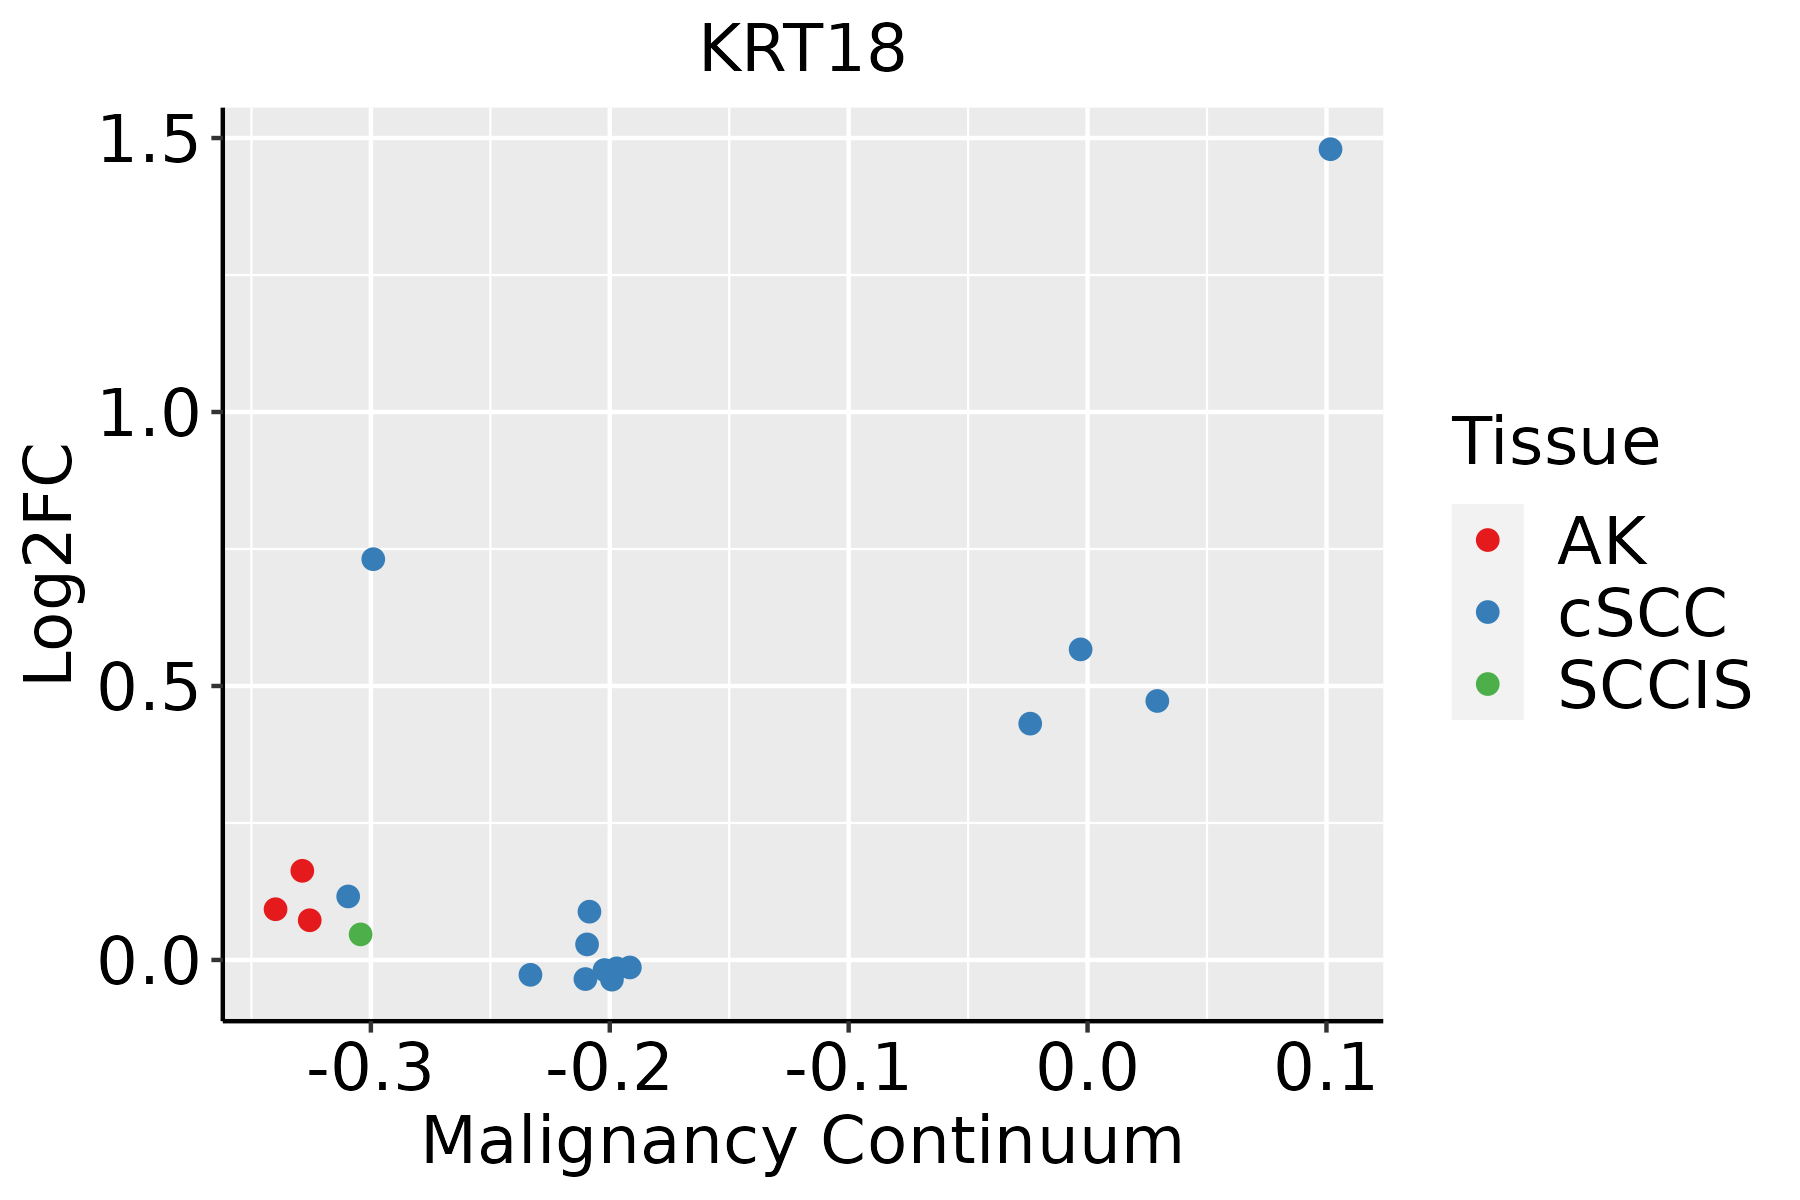 | AK: Actinic keratosis |
| cSCC: Cutaneous squamous cell carcinoma | ||
| SCCIS:squamous cell carcinoma in situ | ||
| Thyroid | 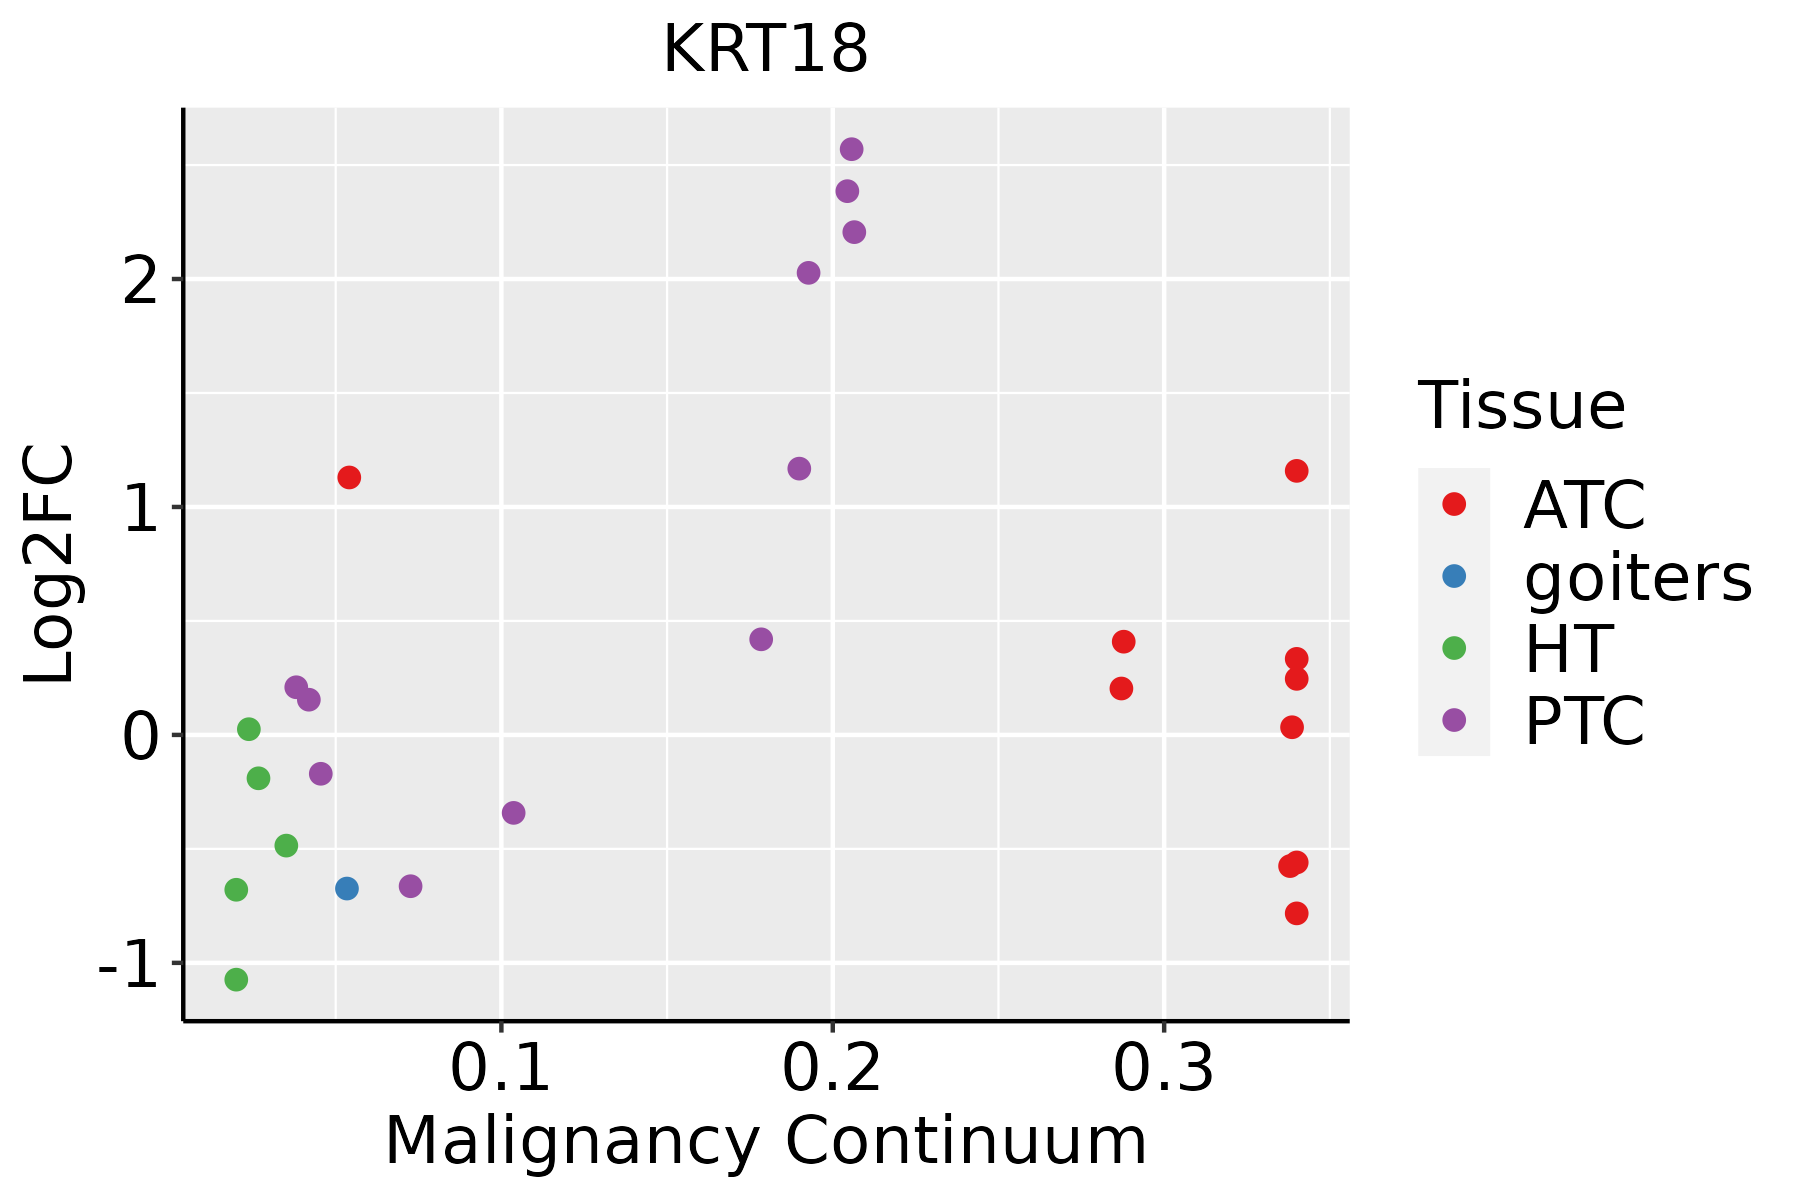 | ATC: Anaplastic thyroid cancer |
| HT: Hashimoto's thyroiditis | ||
| PTC: Papillary thyroid cancer |
| ∗log2FC in expression of this searched gene in stem-like cells from each diseased tissue sample relative to stem-like cells in normal samples in each tissue plotted against the malignancy continuum. Samples are colored based on if they are from different disease stage. |
Top |
Malignant transformation related pathway analysis |
| Find out the enriched GO biological processes and KEGG pathways involved in transition from healthy to precancer to cancer |
| Tissue | Disease Stage | Enriched GO biological Processes |
| Colorectum | AD |  |
| Colorectum | SER |  |
| Colorectum | MSS |  |
| Colorectum | MSI-H |  |
| Colorectum | FAP |  |
| ∗Top 15 enriched GO BP terms are showed in the bar plot of each disease state in each tissue. Each row represents a significant GO biological process which is colored according to the -log10(p.adjust). |
| Page: 1 2 3 4 5 6 7 8 9 |
| GO ID | Tissue | Disease Stage | Description | Gene Ratio | Bg Ratio | pvalue | p.adjust | Count |
| GO:00487329 | Breast | Precancer | gland development | 49/1080 | 436/18723 | 6.11e-06 | 1.73e-04 | 49 |
| GO:00971919 | Breast | Precancer | extrinsic apoptotic signaling pathway | 30/1080 | 219/18723 | 9.42e-06 | 2.50e-04 | 30 |
| GO:00342849 | Breast | Precancer | response to monosaccharide | 29/1080 | 225/18723 | 4.19e-05 | 9.00e-04 | 29 |
| GO:00097439 | Breast | Precancer | response to carbohydrate | 31/1080 | 253/18723 | 6.15e-05 | 1.25e-03 | 31 |
| GO:00018898 | Breast | Precancer | liver development | 21/1080 | 147/18723 | 1.08e-04 | 1.96e-03 | 21 |
| GO:0045104 | Breast | Precancer | intermediate filament cytoskeleton organization | 11/1080 | 51/18723 | 1.26e-04 | 2.22e-03 | 11 |
| GO:00713568 | Breast | Precancer | cellular response to tumor necrosis factor | 28/1080 | 229/18723 | 1.42e-04 | 2.45e-03 | 28 |
| GO:00610088 | Breast | Precancer | hepaticobiliary system development | 21/1080 | 150/18723 | 1.45e-04 | 2.49e-03 | 21 |
| GO:0045103 | Breast | Precancer | intermediate filament-based process | 11/1080 | 52/18723 | 1.52e-04 | 2.60e-03 | 11 |
| GO:00097469 | Breast | Precancer | response to hexose | 27/1080 | 219/18723 | 1.61e-04 | 2.69e-03 | 27 |
| GO:00316679 | Breast | Precancer | response to nutrient levels | 47/1080 | 474/18723 | 2.09e-04 | 3.27e-03 | 47 |
| GO:00346128 | Breast | Precancer | response to tumor necrosis factor | 29/1080 | 253/18723 | 3.32e-04 | 4.70e-03 | 29 |
| GO:19040193 | Breast | Precancer | epithelial cell apoptotic process | 17/1080 | 121/18723 | 5.76e-04 | 7.28e-03 | 17 |
| GO:009719114 | Breast | IDC | extrinsic apoptotic signaling pathway | 42/1434 | 219/18723 | 2.56e-08 | 1.73e-06 | 42 |
| GO:004873214 | Breast | IDC | gland development | 64/1434 | 436/18723 | 3.47e-07 | 1.74e-05 | 64 |
| GO:003428414 | Breast | IDC | response to monosaccharide | 36/1434 | 225/18723 | 1.94e-05 | 4.83e-04 | 36 |
| GO:003166714 | Breast | IDC | response to nutrient levels | 62/1434 | 474/18723 | 2.33e-05 | 5.57e-04 | 62 |
| GO:000974314 | Breast | IDC | response to carbohydrate | 38/1434 | 253/18723 | 4.87e-05 | 1.07e-03 | 38 |
| GO:007135613 | Breast | IDC | cellular response to tumor necrosis factor | 35/1434 | 229/18723 | 6.64e-05 | 1.35e-03 | 35 |
| GO:000974613 | Breast | IDC | response to hexose | 33/1434 | 219/18723 | 1.39e-04 | 2.49e-03 | 33 |
| Page: 1 2 3 4 5 6 7 8 9 10 11 12 13 14 15 16 17 18 19 20 21 22 23 24 25 26 27 28 29 30 31 32 33 34 |
| Pathway ID | Tissue | Disease Stage | Description | Gene Ratio | Bg Ratio | pvalue | p.adjust | qvalue | Count |
| hsa0491518 | Breast | Precancer | Estrogen signaling pathway | 28/684 | 138/8465 | 4.10e-06 | 5.39e-05 | 4.13e-05 | 28 |
| hsa0491519 | Breast | Precancer | Estrogen signaling pathway | 28/684 | 138/8465 | 4.10e-06 | 5.39e-05 | 4.13e-05 | 28 |
| hsa0491523 | Breast | IDC | Estrogen signaling pathway | 35/867 | 138/8465 | 2.55e-07 | 5.18e-06 | 3.88e-06 | 35 |
| hsa0491533 | Breast | IDC | Estrogen signaling pathway | 35/867 | 138/8465 | 2.55e-07 | 5.18e-06 | 3.88e-06 | 35 |
| hsa0491542 | Breast | DCIS | Estrogen signaling pathway | 35/846 | 138/8465 | 1.40e-07 | 2.51e-06 | 1.85e-06 | 35 |
| hsa05150 | Breast | DCIS | Staphylococcus aureus infection | 19/846 | 96/8465 | 2.68e-03 | 1.67e-02 | 1.23e-02 | 19 |
| hsa0491552 | Breast | DCIS | Estrogen signaling pathway | 35/846 | 138/8465 | 1.40e-07 | 2.51e-06 | 1.85e-06 | 35 |
| hsa051501 | Breast | DCIS | Staphylococcus aureus infection | 19/846 | 96/8465 | 2.68e-03 | 1.67e-02 | 1.23e-02 | 19 |
| hsa0491520 | Cervix | CC | Estrogen signaling pathway | 44/1267 | 138/8465 | 3.55e-07 | 3.97e-06 | 2.35e-06 | 44 |
| hsa04915110 | Cervix | CC | Estrogen signaling pathway | 44/1267 | 138/8465 | 3.55e-07 | 3.97e-06 | 2.35e-06 | 44 |
| hsa051504 | Cervix | HSIL_HPV | Staphylococcus aureus infection | 21/459 | 96/8465 | 2.93e-08 | 1.43e-06 | 1.16e-06 | 21 |
| hsa0491524 | Cervix | HSIL_HPV | Estrogen signaling pathway | 19/459 | 138/8465 | 1.54e-04 | 1.74e-03 | 1.40e-03 | 19 |
| hsa0515011 | Cervix | HSIL_HPV | Staphylococcus aureus infection | 21/459 | 96/8465 | 2.93e-08 | 1.43e-06 | 1.16e-06 | 21 |
| hsa0491534 | Cervix | HSIL_HPV | Estrogen signaling pathway | 19/459 | 138/8465 | 1.54e-04 | 1.74e-03 | 1.40e-03 | 19 |
| hsa051502 | Cervix | N_HPV | Staphylococcus aureus infection | 15/349 | 96/8465 | 7.81e-06 | 1.01e-04 | 7.90e-05 | 15 |
| hsa0491543 | Cervix | N_HPV | Estrogen signaling pathway | 16/349 | 138/8465 | 1.68e-04 | 1.53e-03 | 1.19e-03 | 16 |
| hsa051503 | Cervix | N_HPV | Staphylococcus aureus infection | 15/349 | 96/8465 | 7.81e-06 | 1.01e-04 | 7.90e-05 | 15 |
| hsa0491553 | Cervix | N_HPV | Estrogen signaling pathway | 16/349 | 138/8465 | 1.68e-04 | 1.53e-03 | 1.19e-03 | 16 |
| hsa04915 | Colorectum | SER | Estrogen signaling pathway | 38/1580 | 138/8465 | 6.51e-03 | 3.68e-02 | 2.67e-02 | 38 |
| hsa049151 | Colorectum | SER | Estrogen signaling pathway | 38/1580 | 138/8465 | 6.51e-03 | 3.68e-02 | 2.67e-02 | 38 |
| Page: 1 2 3 |
Top |
Cell-cell communication analysis |
| Identification of potential cell-cell interactions between two cell types and their ligand-receptor pairs for different disease states |
| Ligand | Receptor | LRpair | Pathway | Tissue | Disease Stage |
| Page: 1 |
Top |
Single-cell gene regulatory network inference analysis |
| Find out the significant the regulons (TFs) and the target genes of each regulon across cell types for different disease states |
| TF | Cell Type | Tissue | Disease Stage | Target Gene | RSS | Regulon Activity |
| ∗The dot plots of a searched regulon are shown for all cell subpopulations in each disease state of each tissue based on the regulon specific score inferred using pySCENIC and by calculating the average expression. |
| Page: 1 |
Top |
Somatic mutation of malignant transformation related genes |
| Annotation of somatic variants for genes involved in malignant transformation |
| Hugo Symbol | Variant Class | Variant Classification | dbSNP RS | HGVSc | HGVSp | HGVSp Short | SWISSPROT | BIOTYPE | SIFT | PolyPhen | Tumor Sample Barcode | Tissue | Histology | Sex | Age | Stage | Therapy Types | Drugs | Outcome |
| KRT18 | SNV | Missense_Mutation | c.265N>A | p.Asp89Asn | p.D89N | P05783 | protein_coding | tolerated(0.11) | benign(0.221) | TCGA-A8-A09G-01 | Breast | breast invasive carcinoma | Female | >=65 | III/IV | Unknown | Unknown | SD | |
| KRT18 | SNV | Missense_Mutation | c.826N>C | p.Glu276Gln | p.E276Q | P05783 | protein_coding | tolerated(0.08) | benign(0.392) | TCGA-AC-A5XS-01 | Breast | breast invasive carcinoma | Female | >=65 | I/II | Hormone Therapy | femara | SD | |
| KRT18 | SNV | Missense_Mutation | c.826N>C | p.Glu276Gln | p.E276Q | P05783 | protein_coding | tolerated(0.08) | benign(0.392) | TCGA-D8-A1J8-01 | Breast | breast invasive carcinoma | Female | >=65 | I/II | Hormone Therapy | nolvadex | SD | |
| KRT18 | SNV | Missense_Mutation | c.1132N>T | p.Ala378Ser | p.A378S | P05783 | protein_coding | tolerated(0.1) | benign(0.396) | TCGA-AA-3877-01 | Colorectum | colon adenocarcinoma | Female | >=65 | I/II | Unknown | Unknown | SD | |
| KRT18 | SNV | Missense_Mutation | c.614N>T | p.Ala205Val | p.A205V | P05783 | protein_coding | tolerated(0.06) | benign(0.119) | TCGA-AA-A010-01 | Colorectum | colon adenocarcinoma | Female | <65 | I/II | Chemotherapy | folinic | CR | |
| KRT18 | SNV | Missense_Mutation | rs773737254 | c.557G>A | p.Arg186His | p.R186H | P05783 | protein_coding | tolerated(0.23) | benign(0.027) | TCGA-CK-4951-01 | Colorectum | colon adenocarcinoma | Female | >=65 | I/II | Unknown | Unknown | PD |
| KRT18 | SNV | Missense_Mutation | c.949N>G | p.Lys317Glu | p.K317E | P05783 | protein_coding | deleterious(0.03) | benign(0.279) | TCGA-D5-6533-01 | Colorectum | colon adenocarcinoma | Female | >=65 | I/II | Chemotherapy | oxaliplatin | CR | |
| KRT18 | SNV | Missense_Mutation | c.181G>A | p.Gly61Arg | p.G61R | P05783 | protein_coding | tolerated(0.28) | benign(0.001) | TCGA-D5-6932-01 | Colorectum | colon adenocarcinoma | Male | >=65 | I/II | Unknown | Unknown | SD | |
| KRT18 | SNV | Missense_Mutation | rs796088051 | c.361N>T | p.Pro121Ser | p.P121S | P05783 | protein_coding | deleterious(0.02) | benign(0.438) | TCGA-WS-AB45-01 | Colorectum | colon adenocarcinoma | Female | <65 | I/II | Unknown | Unknown | SD |
| KRT18 | SNV | Missense_Mutation | novel | c.635T>C | p.Phe212Ser | p.F212S | P05783 | protein_coding | tolerated(0.05) | possibly_damaging(0.718) | TCGA-A5-A1OF-01 | Endometrium | uterine corpus endometrioid carcinoma | Female | <65 | I/II | Unknown | Unknown | SD |
| Page: 1 2 3 |
Top |
Related drugs of malignant transformation related genes |
| Identification of chemicals and drugs interact with genes involved in malignant transfromation |
| (DGIdb 4.0) |
| Entrez ID | Symbol | Category | Interaction Types | Drug Claim Name | Drug Name | PMIDs |
| 3875 | KRT18 | DRUGGABLE GENOME | ANTIVIRAL | 17713161 | ||
| 3875 | KRT18 | DRUGGABLE GENOME | MITOMYCIN-C | 11968007 | ||
| 3875 | KRT18 | DRUGGABLE GENOME | IL-6 | 17213200 | ||
| 3875 | KRT18 | DRUGGABLE GENOME | RIBAVIRIN | RIBAVIRIN | 17713161 |
| Page: 1 |

Copyright 2023-Present -The University of Texas Health Science Center at Houston |