
|
|||||
|
 | |
| |
| |
| |
| |
| |
|
Gene: KRT17 |
Gene summary for KRT17 |
| Gene information | Species | Human | Gene symbol | KRT17 | Gene ID | 3872 |
| Gene name | keratin 17 | |
| Gene Alias | 39.1 | |
| Cytomap | 17q21.2 | |
| Gene Type | protein-coding | GO ID | GO:0001558 | UniProtAcc | Q04695 |
Top |
Malignant transformation analysis |
| Identification of the aberrant gene expression in precancerous and cancerous lesions by comparing the gene expression of stem-like cells in diseased tissues with normal stem cells |
| Entrez ID | Symbol | Replicates | Species | Organ | Tissue | Adj P-value | Log2FC | Malignancy |
| 3872 | KRT17 | GSM4909281 | Human | Breast | IDC | 7.24e-35 | 8.45e-01 | 0.21 |
| 3872 | KRT17 | GSM4909282 | Human | Breast | IDC | 3.30e-60 | 1.05e+00 | -0.0288 |
| 3872 | KRT17 | GSM4909285 | Human | Breast | IDC | 5.79e-05 | 3.87e-01 | 0.21 |
| 3872 | KRT17 | GSM4909286 | Human | Breast | IDC | 4.71e-04 | -4.64e-01 | 0.1081 |
| 3872 | KRT17 | GSM4909287 | Human | Breast | IDC | 6.74e-05 | -3.97e-01 | 0.2057 |
| 3872 | KRT17 | GSM4909290 | Human | Breast | IDC | 4.72e-24 | -8.24e-01 | 0.2096 |
| 3872 | KRT17 | GSM4909291 | Human | Breast | IDC | 2.77e-11 | -6.34e-01 | 0.1753 |
| 3872 | KRT17 | GSM4909293 | Human | Breast | IDC | 4.09e-30 | -7.68e-01 | 0.1581 |
| 3872 | KRT17 | GSM4909294 | Human | Breast | IDC | 1.83e-31 | -7.76e-01 | 0.2022 |
| 3872 | KRT17 | GSM4909295 | Human | Breast | IDC | 1.04e-15 | 8.99e-01 | 0.0898 |
| 3872 | KRT17 | GSM4909296 | Human | Breast | IDC | 2.26e-31 | -7.81e-01 | 0.1524 |
| 3872 | KRT17 | GSM4909297 | Human | Breast | IDC | 4.83e-28 | -7.90e-01 | 0.1517 |
| 3872 | KRT17 | GSM4909298 | Human | Breast | IDC | 5.48e-22 | -7.69e-01 | 0.1551 |
| 3872 | KRT17 | GSM4909299 | Human | Breast | IDC | 1.56e-03 | 3.99e-01 | 0.035 |
| 3872 | KRT17 | GSM4909300 | Human | Breast | IDC | 8.60e-04 | 6.17e-01 | 0.0334 |
| 3872 | KRT17 | GSM4909301 | Human | Breast | IDC | 9.76e-39 | -8.54e-01 | 0.1577 |
| 3872 | KRT17 | GSM4909302 | Human | Breast | IDC | 1.78e-27 | -7.37e-01 | 0.1545 |
| 3872 | KRT17 | GSM4909303 | Human | Breast | IDC | 1.41e-13 | -8.61e-01 | 0.0438 |
| 3872 | KRT17 | GSM4909304 | Human | Breast | IDC | 1.98e-41 | -8.57e-01 | 0.1636 |
| 3872 | KRT17 | GSM4909306 | Human | Breast | IDC | 1.61e-12 | -6.25e-01 | 0.1564 |
| Page: 1 2 3 4 5 6 7 8 9 10 11 12 |
| Tissue | Expression Dynamics | Abbreviation |
| Breast |  | IDC: Invasive ductal carcinoma |
| DCIS: Ductal carcinoma in situ | ||
| Precancer(BRCA1-mut): Precancerous lesion from BRCA1 mutation carriers | ||
| Cervix | 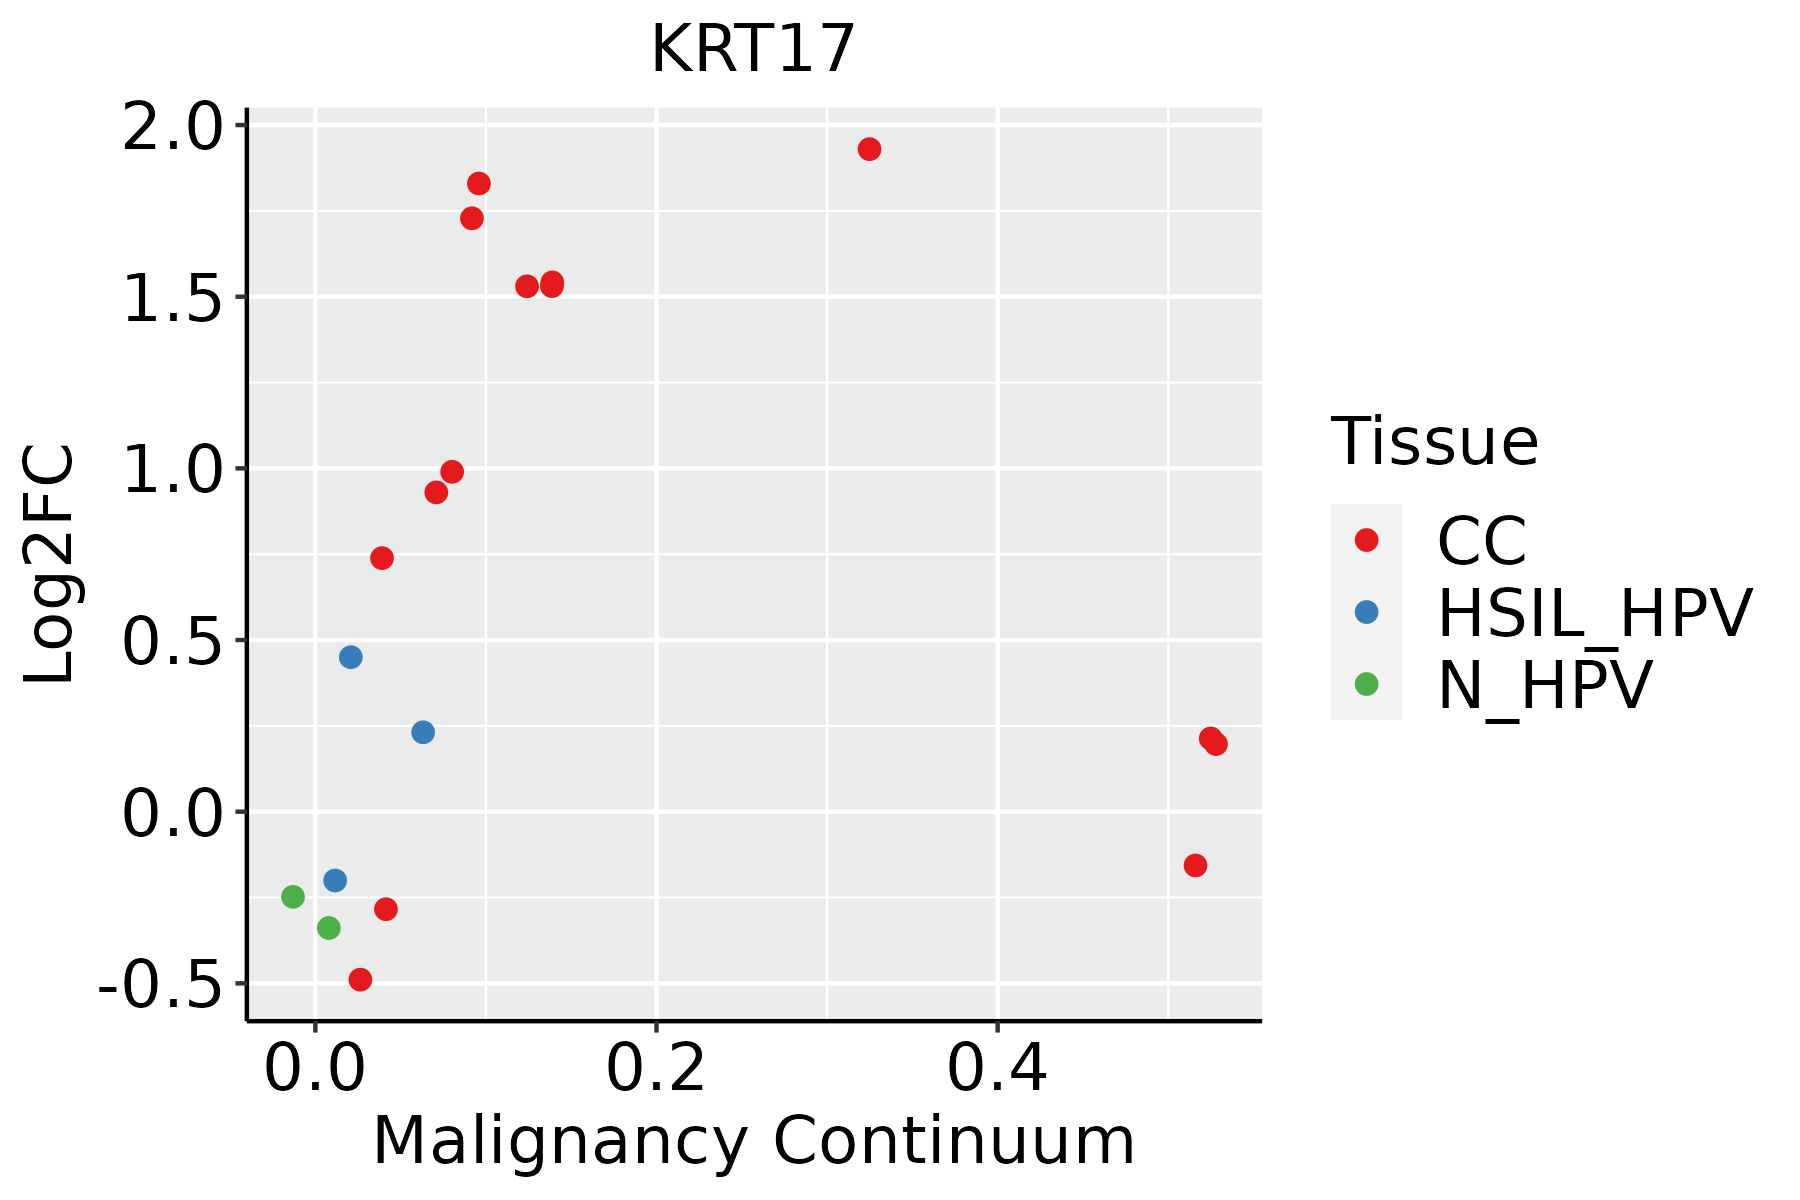 | CC: Cervix cancer |
| HSIL_HPV: HPV-infected high-grade squamous intraepithelial lesions | ||
| N_HPV: HPV-infected normal cervix | ||
| Esophagus |  | ESCC: Esophageal squamous cell carcinoma |
| HGIN: High-grade intraepithelial neoplasias | ||
| LGIN: Low-grade intraepithelial neoplasias | ||
| GC |  | CAG: Chronic atrophic gastritis |
| CAG with IM: Chronic atrophic gastritis with intestinal metaplasia | ||
| CSG: Chronic superficial gastritis | ||
| GC: Gastric cancer | ||
| SIM: Severe intestinal metaplasia | ||
| WIM: Wild intestinal metaplasia | ||
| Lung | 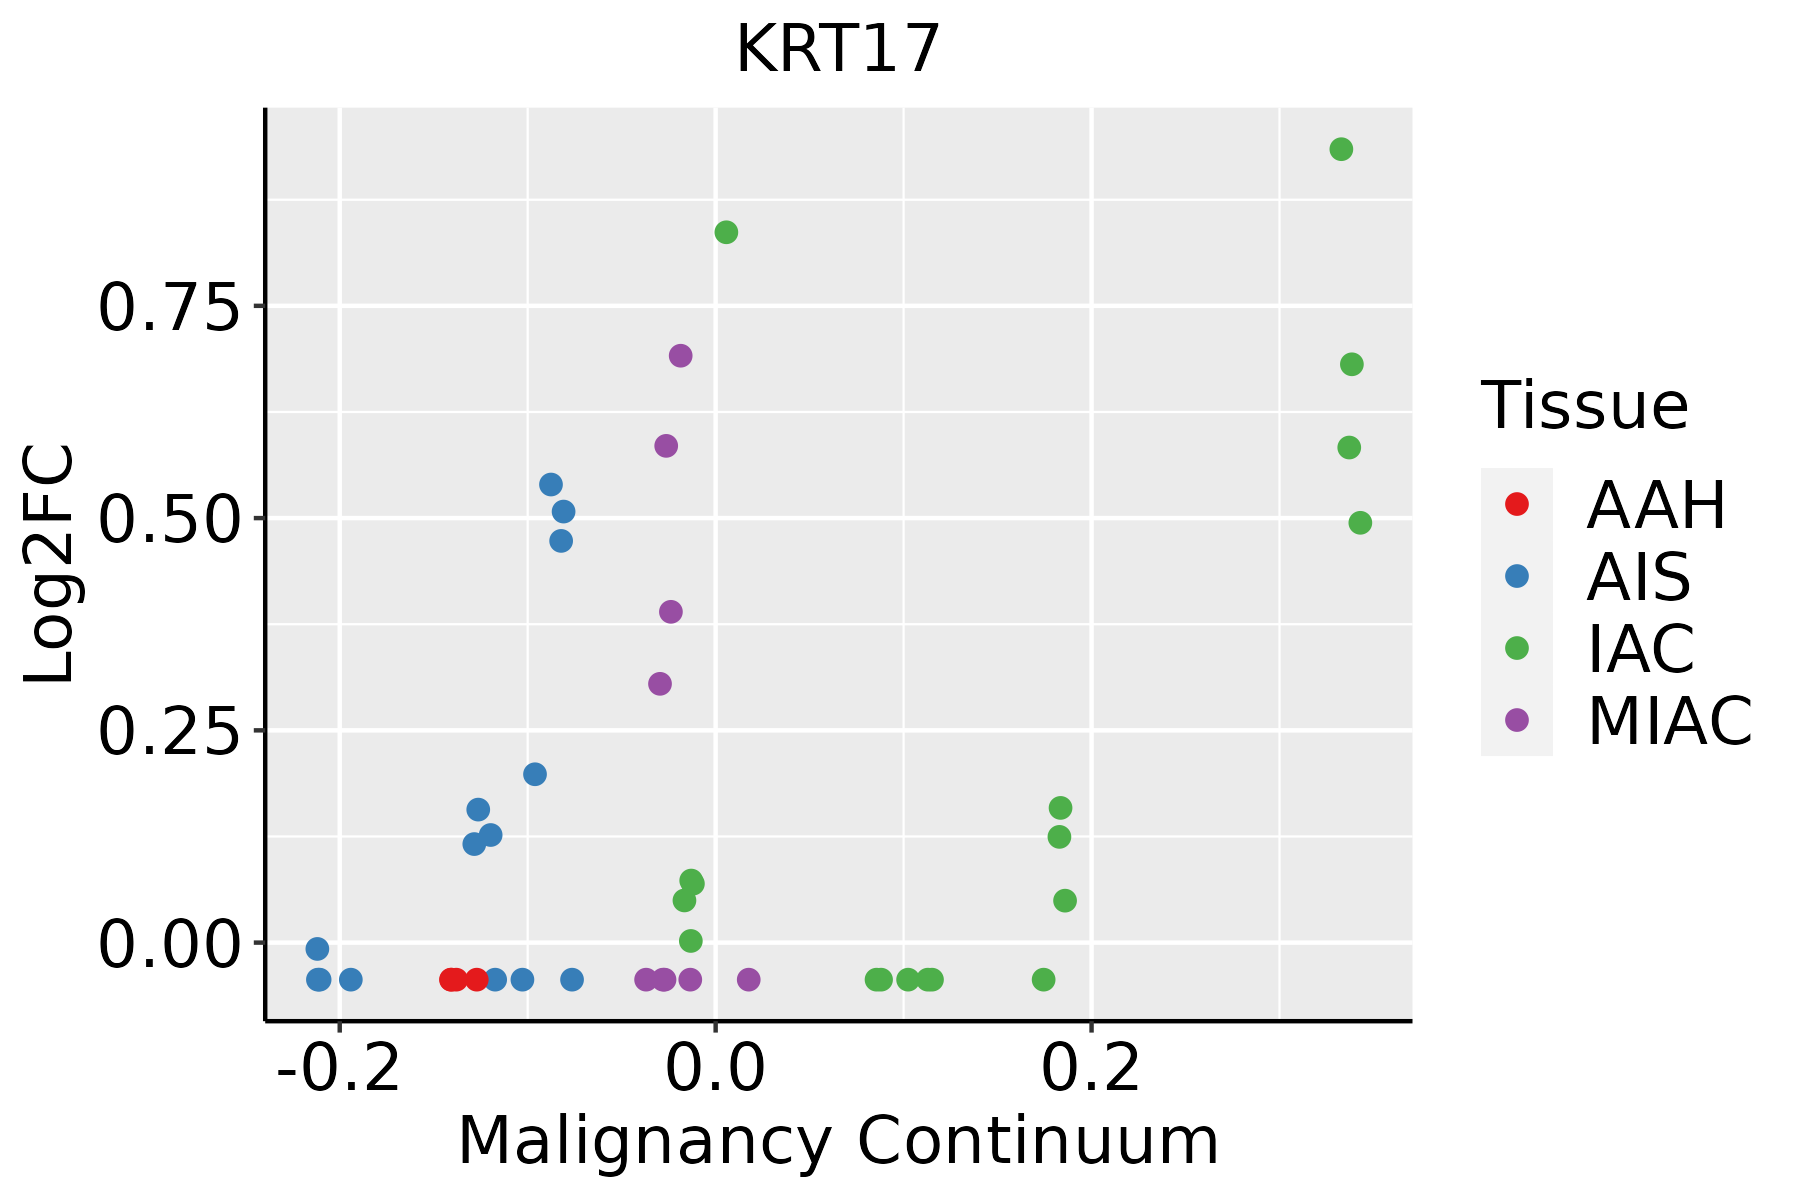 | AAH: Atypical adenomatous hyperplasia |
| AIS: Adenocarcinoma in situ | ||
| IAC: Invasive lung adenocarcinoma | ||
| MIA: Minimally invasive adenocarcinoma | ||
| Oral Cavity | 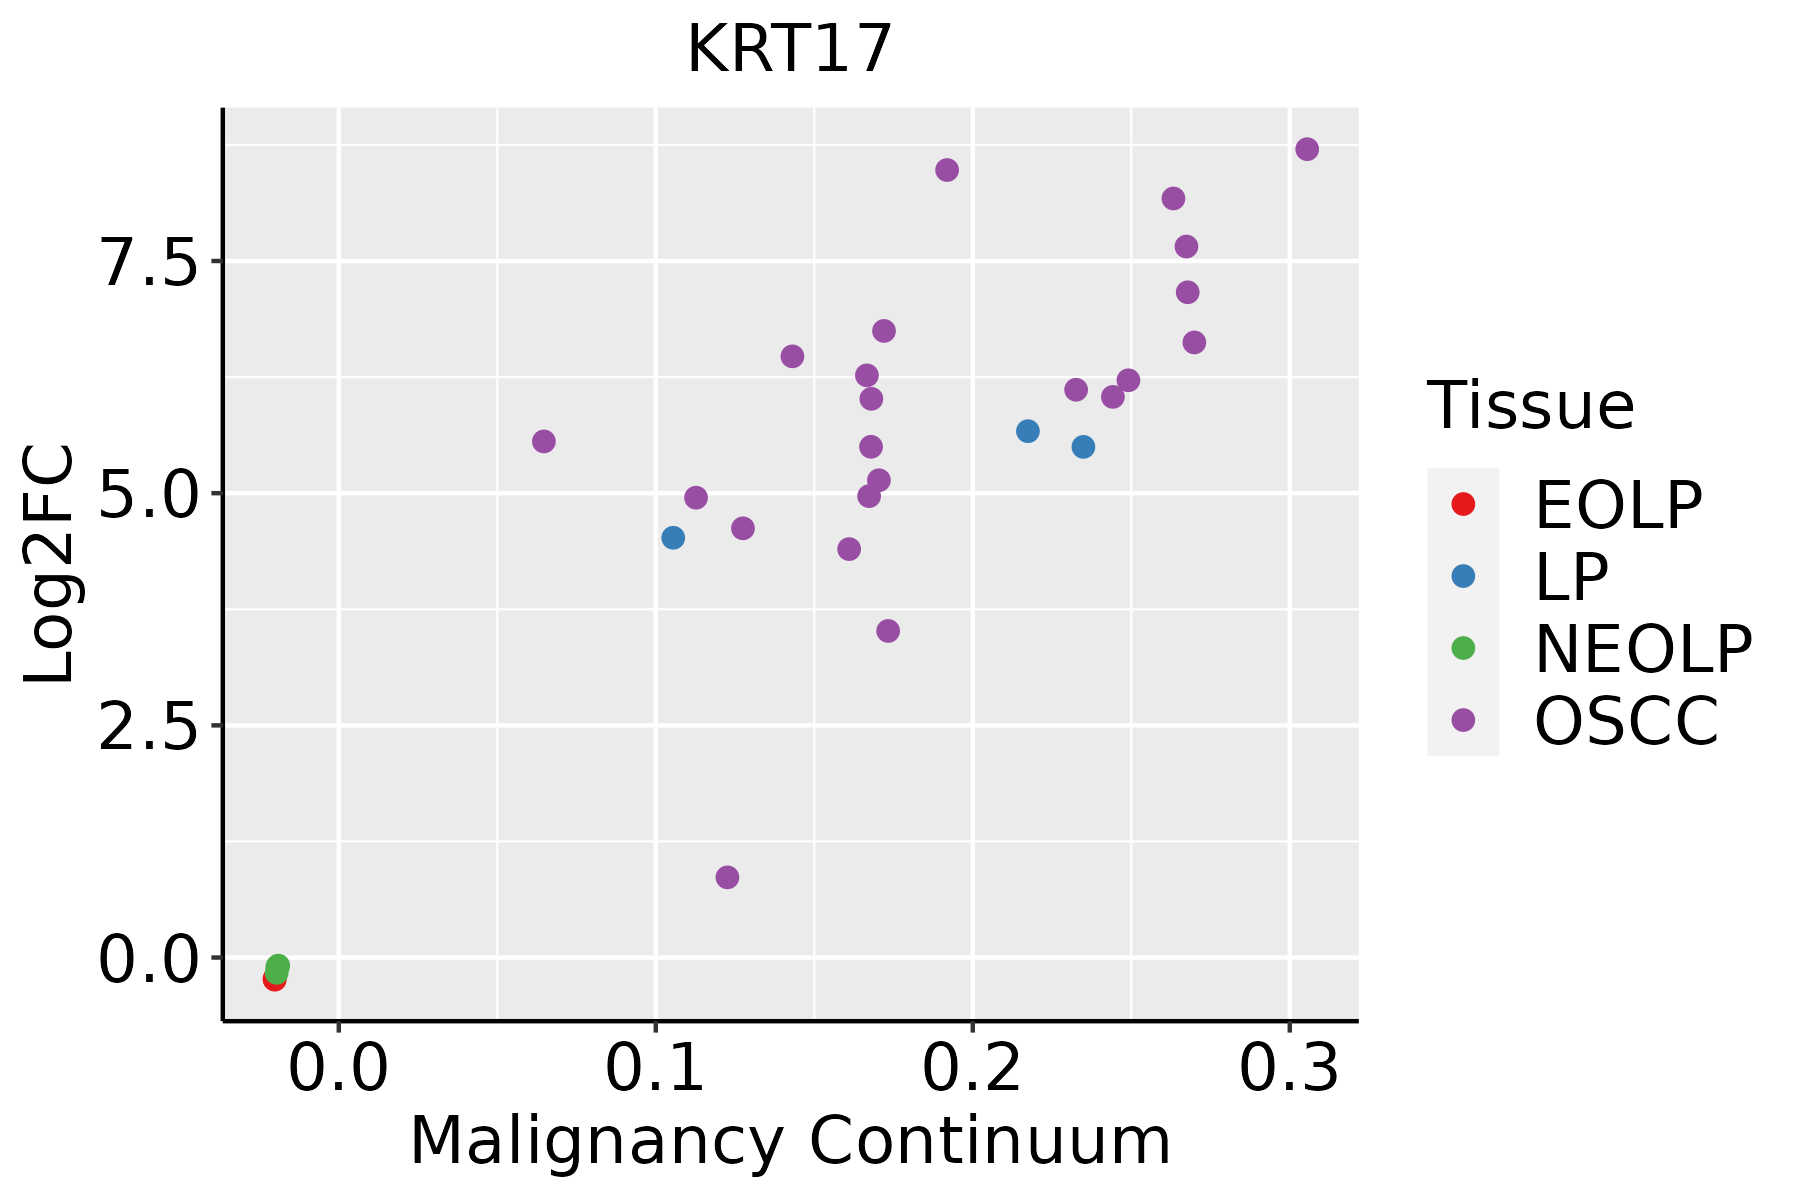 | EOLP: Erosive Oral lichen planus |
| LP: leukoplakia | ||
| NEOLP: Non-erosive oral lichen planus | ||
| OSCC: Oral squamous cell carcinoma | ||
| Prostate | 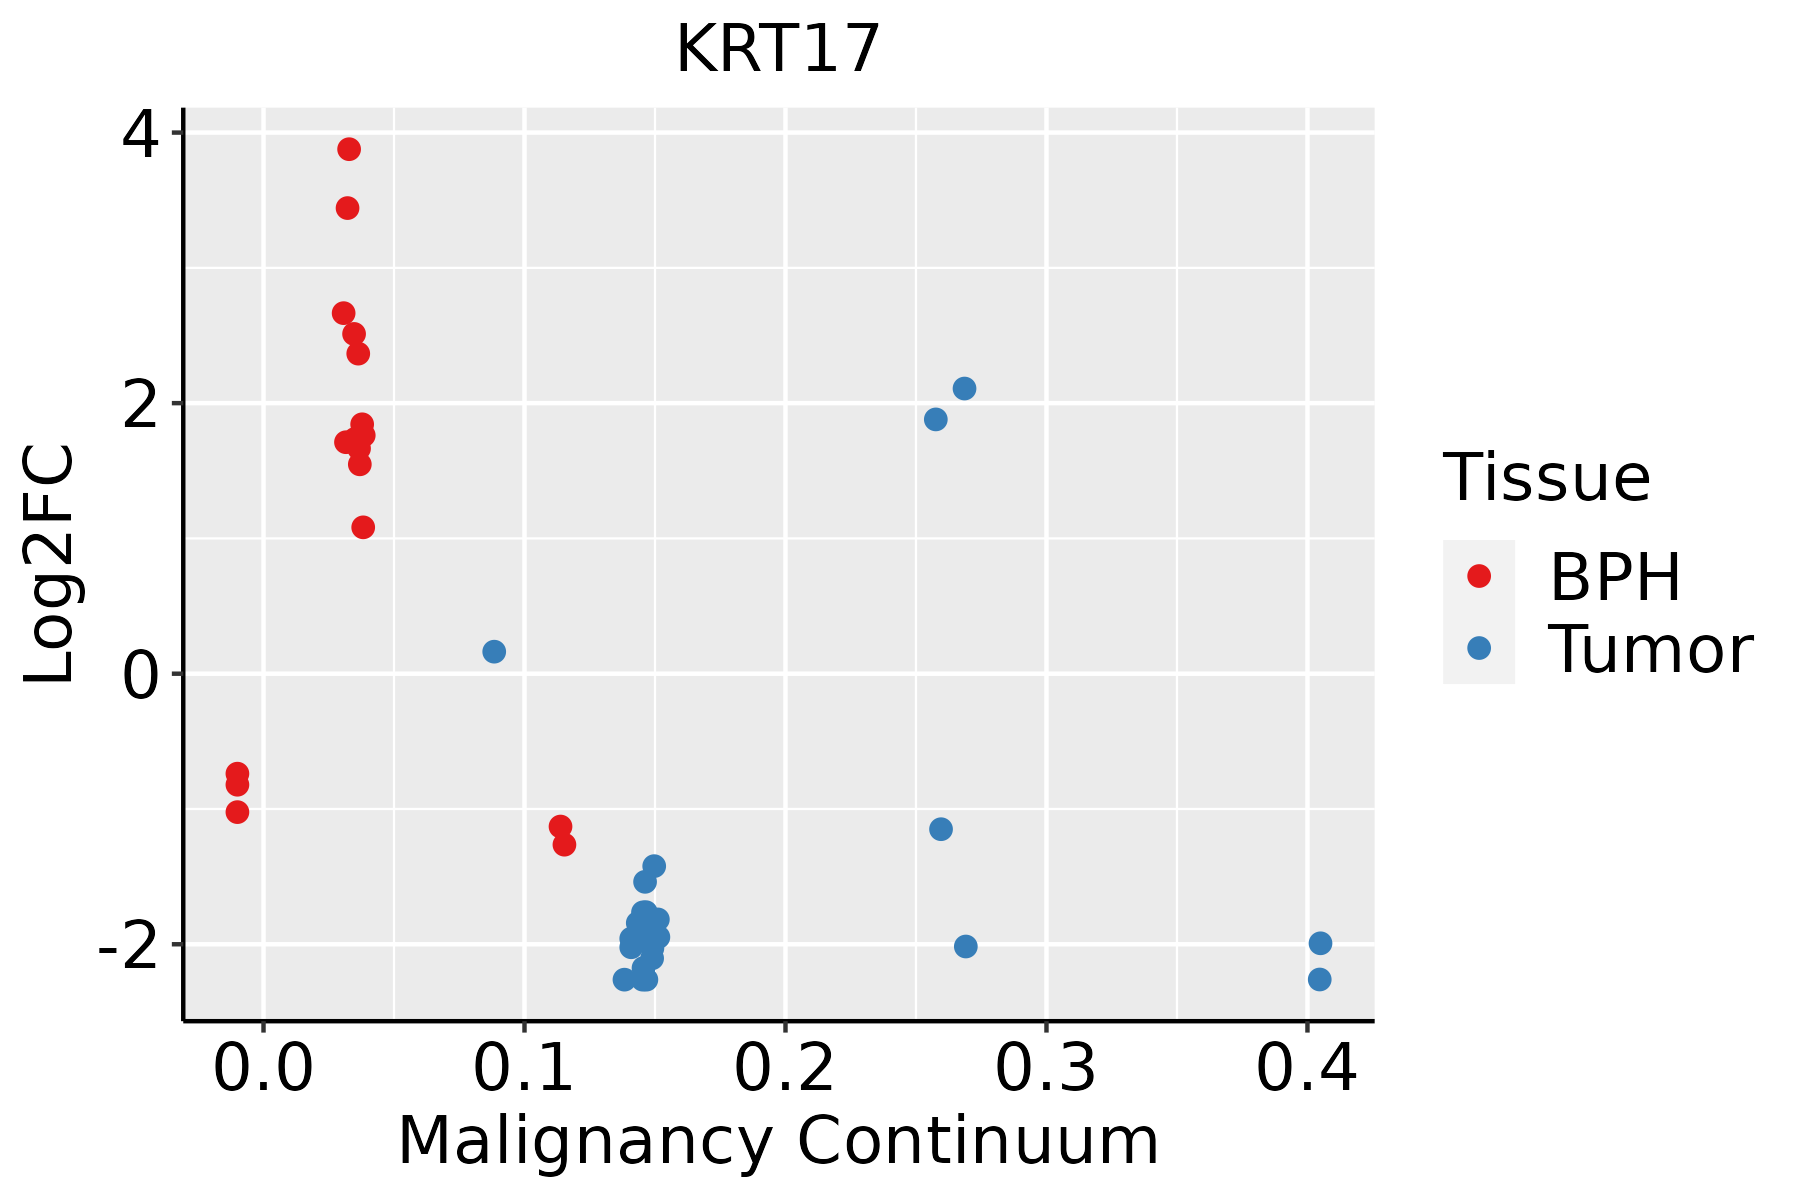 | BPH: Benign Prostatic Hyperplasia |
| Skin |  | AK: Actinic keratosis |
| cSCC: Cutaneous squamous cell carcinoma | ||
| SCCIS:squamous cell carcinoma in situ | ||
| Thyroid | 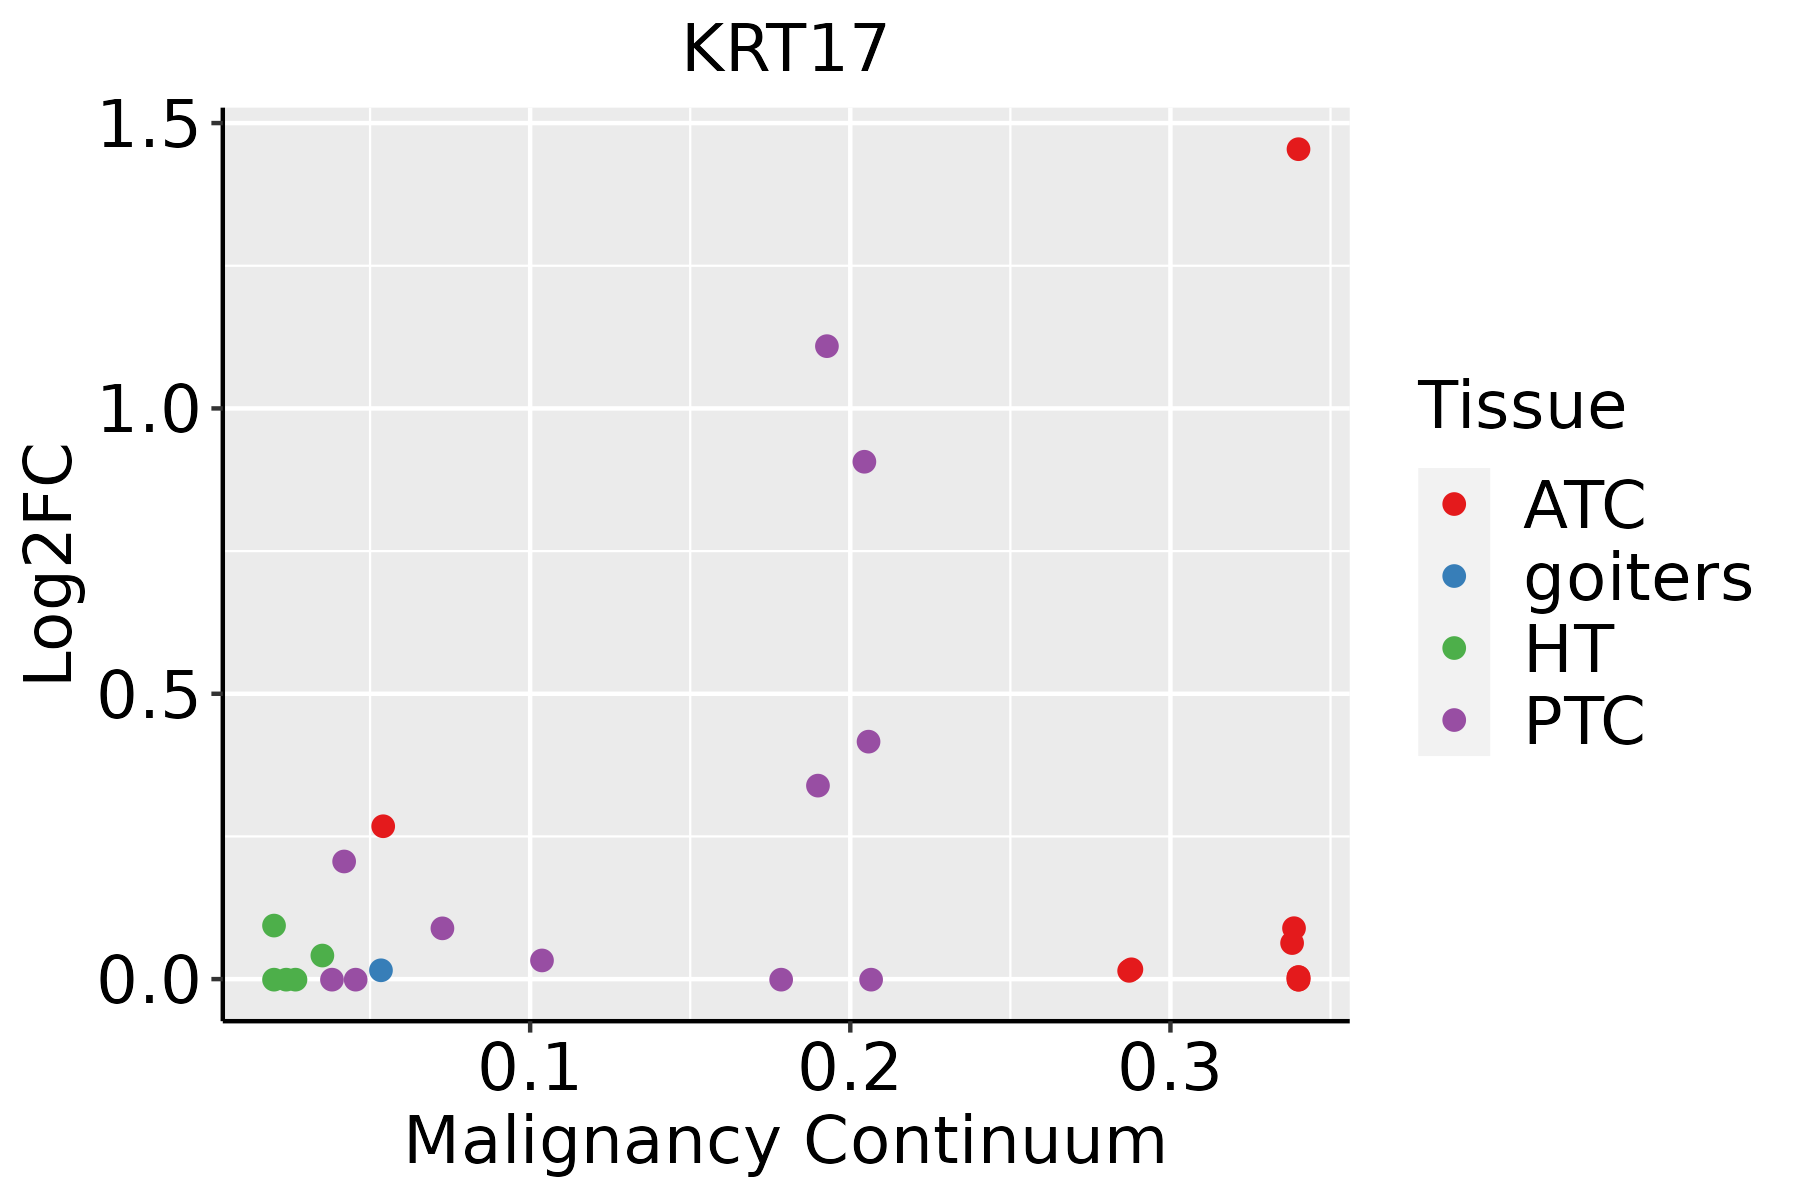 | ATC: Anaplastic thyroid cancer |
| HT: Hashimoto's thyroiditis | ||
| PTC: Papillary thyroid cancer |
| ∗log2FC in expression of this searched gene in stem-like cells from each diseased tissue sample relative to stem-like cells in normal samples in each tissue plotted against the malignancy continuum. Samples are colored based on if they are from different disease stage. |
Top |
Malignant transformation related pathway analysis |
| Find out the enriched GO biological processes and KEGG pathways involved in transition from healthy to precancer to cancer |
| Tissue | Disease Stage | Enriched GO biological Processes |
| Colorectum | AD |  |
| Colorectum | SER |  |
| Colorectum | MSS |  |
| Colorectum | MSI-H |  |
| Colorectum | FAP |  |
| ∗Top 15 enriched GO BP terms are showed in the bar plot of each disease state in each tissue. Each row represents a significant GO biological process which is colored according to the -log10(p.adjust). |
| Page: 1 2 3 4 5 6 7 8 9 |
| GO ID | Tissue | Disease Stage | Description | Gene Ratio | Bg Ratio | pvalue | p.adjust | Count |
| GO:00064179 | Breast | Precancer | regulation of translation | 67/1080 | 468/18723 | 4.71e-12 | 7.64e-10 | 67 |
| GO:00457279 | Breast | Precancer | positive regulation of translation | 32/1080 | 136/18723 | 5.89e-12 | 9.27e-10 | 32 |
| GO:00342509 | Breast | Precancer | positive regulation of cellular amide metabolic process | 33/1080 | 162/18723 | 1.72e-10 | 1.77e-08 | 33 |
| GO:0045104 | Breast | Precancer | intermediate filament cytoskeleton organization | 11/1080 | 51/18723 | 1.26e-04 | 2.22e-03 | 11 |
| GO:0045103 | Breast | Precancer | intermediate filament-based process | 11/1080 | 52/18723 | 1.52e-04 | 2.60e-03 | 11 |
| GO:00085445 | Breast | Precancer | epidermis development | 35/1080 | 324/18723 | 2.71e-04 | 3.96e-03 | 35 |
| GO:00160497 | Breast | Precancer | cell growth | 46/1080 | 482/18723 | 5.63e-04 | 7.16e-03 | 46 |
| GO:00099136 | Breast | Precancer | epidermal cell differentiation | 23/1080 | 202/18723 | 1.43e-03 | 1.50e-02 | 23 |
| GO:00015587 | Breast | Precancer | regulation of cell growth | 39/1080 | 414/18723 | 1.81e-03 | 1.78e-02 | 39 |
| GO:00302163 | Breast | Precancer | keratinocyte differentiation | 17/1080 | 139/18723 | 2.71e-03 | 2.39e-02 | 17 |
| GO:000641714 | Breast | IDC | regulation of translation | 74/1434 | 468/18723 | 1.67e-09 | 1.53e-07 | 74 |
| GO:004572714 | Breast | IDC | positive regulation of translation | 33/1434 | 136/18723 | 1.92e-09 | 1.73e-07 | 33 |
| GO:003425014 | Breast | IDC | positive regulation of cellular amide metabolic process | 35/1434 | 162/18723 | 1.63e-08 | 1.16e-06 | 35 |
| GO:000854412 | Breast | IDC | epidermis development | 41/1434 | 324/18723 | 1.03e-03 | 1.14e-02 | 41 |
| GO:001604913 | Breast | IDC | cell growth | 56/1434 | 482/18723 | 1.16e-03 | 1.26e-02 | 56 |
| GO:00451041 | Breast | IDC | intermediate filament cytoskeleton organization | 11/1434 | 51/18723 | 1.40e-03 | 1.44e-02 | 11 |
| GO:000155813 | Breast | IDC | regulation of cell growth | 49/1434 | 414/18723 | 1.55e-03 | 1.55e-02 | 49 |
| GO:000991312 | Breast | IDC | epidermal cell differentiation | 28/1434 | 202/18723 | 1.62e-03 | 1.60e-02 | 28 |
| GO:00451031 | Breast | IDC | intermediate filament-based process | 11/1434 | 52/18723 | 1.66e-03 | 1.63e-02 | 11 |
| GO:00302161 | Breast | IDC | keratinocyte differentiation | 21/1434 | 139/18723 | 2.06e-03 | 1.95e-02 | 21 |
| Page: 1 2 3 4 5 6 7 8 9 10 11 12 |
| Pathway ID | Tissue | Disease Stage | Description | Gene Ratio | Bg Ratio | pvalue | p.adjust | qvalue | Count |
| hsa0491518 | Breast | Precancer | Estrogen signaling pathway | 28/684 | 138/8465 | 4.10e-06 | 5.39e-05 | 4.13e-05 | 28 |
| hsa0491519 | Breast | Precancer | Estrogen signaling pathway | 28/684 | 138/8465 | 4.10e-06 | 5.39e-05 | 4.13e-05 | 28 |
| hsa0491523 | Breast | IDC | Estrogen signaling pathway | 35/867 | 138/8465 | 2.55e-07 | 5.18e-06 | 3.88e-06 | 35 |
| hsa0491533 | Breast | IDC | Estrogen signaling pathway | 35/867 | 138/8465 | 2.55e-07 | 5.18e-06 | 3.88e-06 | 35 |
| hsa0491542 | Breast | DCIS | Estrogen signaling pathway | 35/846 | 138/8465 | 1.40e-07 | 2.51e-06 | 1.85e-06 | 35 |
| hsa05150 | Breast | DCIS | Staphylococcus aureus infection | 19/846 | 96/8465 | 2.68e-03 | 1.67e-02 | 1.23e-02 | 19 |
| hsa0491552 | Breast | DCIS | Estrogen signaling pathway | 35/846 | 138/8465 | 1.40e-07 | 2.51e-06 | 1.85e-06 | 35 |
| hsa051501 | Breast | DCIS | Staphylococcus aureus infection | 19/846 | 96/8465 | 2.68e-03 | 1.67e-02 | 1.23e-02 | 19 |
| hsa0491520 | Cervix | CC | Estrogen signaling pathway | 44/1267 | 138/8465 | 3.55e-07 | 3.97e-06 | 2.35e-06 | 44 |
| hsa04915110 | Cervix | CC | Estrogen signaling pathway | 44/1267 | 138/8465 | 3.55e-07 | 3.97e-06 | 2.35e-06 | 44 |
| hsa051504 | Cervix | HSIL_HPV | Staphylococcus aureus infection | 21/459 | 96/8465 | 2.93e-08 | 1.43e-06 | 1.16e-06 | 21 |
| hsa0491524 | Cervix | HSIL_HPV | Estrogen signaling pathway | 19/459 | 138/8465 | 1.54e-04 | 1.74e-03 | 1.40e-03 | 19 |
| hsa0515011 | Cervix | HSIL_HPV | Staphylococcus aureus infection | 21/459 | 96/8465 | 2.93e-08 | 1.43e-06 | 1.16e-06 | 21 |
| hsa0491534 | Cervix | HSIL_HPV | Estrogen signaling pathway | 19/459 | 138/8465 | 1.54e-04 | 1.74e-03 | 1.40e-03 | 19 |
| hsa0491516 | Lung | IAC | Estrogen signaling pathway | 28/1053 | 138/8465 | 5.64e-03 | 2.45e-02 | 1.63e-02 | 28 |
| hsa0491517 | Lung | IAC | Estrogen signaling pathway | 28/1053 | 138/8465 | 5.64e-03 | 2.45e-02 | 1.63e-02 | 28 |
| hsa0491529 | Oral cavity | EOLP | Estrogen signaling pathway | 38/1218 | 138/8465 | 3.78e-05 | 1.82e-04 | 1.07e-04 | 38 |
| hsa04915113 | Oral cavity | EOLP | Estrogen signaling pathway | 38/1218 | 138/8465 | 3.78e-05 | 1.82e-04 | 1.07e-04 | 38 |
| hsa0491527 | Prostate | BPH | Estrogen signaling pathway | 48/1718 | 138/8465 | 4.60e-05 | 3.16e-04 | 1.96e-04 | 48 |
| hsa04915112 | Prostate | BPH | Estrogen signaling pathway | 48/1718 | 138/8465 | 4.60e-05 | 3.16e-04 | 1.96e-04 | 48 |
| Page: 1 2 |
Top |
Cell-cell communication analysis |
| Identification of potential cell-cell interactions between two cell types and their ligand-receptor pairs for different disease states |
| Ligand | Receptor | LRpair | Pathway | Tissue | Disease Stage |
| Page: 1 |
Top |
Single-cell gene regulatory network inference analysis |
| Find out the significant the regulons (TFs) and the target genes of each regulon across cell types for different disease states |
| TF | Cell Type | Tissue | Disease Stage | Target Gene | RSS | Regulon Activity |
| ∗The dot plots of a searched regulon are shown for all cell subpopulations in each disease state of each tissue based on the regulon specific score inferred using pySCENIC and by calculating the average expression. |
| Page: 1 |
Top |
Somatic mutation of malignant transformation related genes |
| Annotation of somatic variants for genes involved in malignant transformation |
| Hugo Symbol | Variant Class | Variant Classification | dbSNP RS | HGVSc | HGVSp | HGVSp Short | SWISSPROT | BIOTYPE | SIFT | PolyPhen | Tumor Sample Barcode | Tissue | Histology | Sex | Age | Stage | Therapy Types | Drugs | Outcome |
| KRT17 | SNV | Missense_Mutation | rs755801047 | c.812N>T | p.Ala271Val | p.A271V | Q04695 | protein_coding | tolerated(0.25) | benign(0.162) | TCGA-A7-A3J0-01 | Breast | breast invasive carcinoma | Female | <65 | I/II | Hormone Therapy | anastrazole | SD |
| KRT17 | SNV | Missense_Mutation | rs747613789 | c.88C>T | p.Arg30Trp | p.R30W | Q04695 | protein_coding | tolerated(0.25) | benign(0.353) | TCGA-AC-A2QI-01 | Breast | breast invasive carcinoma | Female | >=65 | III/IV | Chemotherapy | cytoxan | CR |
| KRT17 | SNV | Missense_Mutation | rs767912889 | c.814N>A | p.Glu272Lys | p.E272K | Q04695 | protein_coding | deleterious(0.05) | benign(0.358) | TCGA-C8-A12Z-01 | Breast | breast invasive carcinoma | Female | <65 | I/II | Chemotherapy | 5-fluorouracil | CR |
| KRT17 | SNV | Missense_Mutation | rs58730926 | c.280N>T | p.Arg94Cys | p.R94C | Q04695 | protein_coding | deleterious(0.04) | benign(0.243) | TCGA-D8-A13Z-01 | Breast | breast invasive carcinoma | Female | <65 | I/II | Chemotherapy | doxorubicine | SD |
| KRT17 | SNV | Missense_Mutation | rs753353264 | c.803N>A | p.Arg268His | p.R268H | Q04695 | protein_coding | deleterious(0.03) | benign(0.344) | TCGA-C5-A1BL-01 | Cervix | cervical & endocervical cancer | Female | <65 | I/II | Unknown | Unknown | SD |
| KRT17 | SNV | Missense_Mutation | rs368091501 | c.769N>T | p.Arg257Cys | p.R257C | Q04695 | protein_coding | deleterious(0.01) | possibly_damaging(0.632) | TCGA-AA-3811-01 | Colorectum | colon adenocarcinoma | Female | >=65 | III/IV | Unknown | Unknown | PD |
| KRT17 | SNV | Missense_Mutation | rs756693103 | c.539N>A | p.Arg180His | p.R180H | Q04695 | protein_coding | deleterious(0.03) | benign(0.068) | TCGA-AA-3864-01 | Colorectum | colon adenocarcinoma | Male | >=65 | I/II | Unknown | Unknown | SD |
| KRT17 | SNV | Missense_Mutation | rs780251083 | c.538C>T | p.Arg180Cys | p.R180C | Q04695 | protein_coding | deleterious(0.03) | benign(0.063) | TCGA-AA-3947-01 | Colorectum | colon adenocarcinoma | Female | <65 | I/II | Unknown | Unknown | SD |
| KRT17 | SNV | Missense_Mutation | rs143477910 | c.1009N>A | p.Val337Met | p.V337M | Q04695 | protein_coding | tolerated(0.49) | benign(0.017) | TCGA-AD-5900-01 | Colorectum | colon adenocarcinoma | Male | >=65 | I/II | Unknown | Unknown | SD |
| KRT17 | SNV | Missense_Mutation | c.506T>C | p.Phe169Ser | p.F169S | Q04695 | protein_coding | deleterious(0.02) | benign(0.261) | TCGA-AU-6004-01 | Colorectum | colon adenocarcinoma | Female | >=65 | I/II | Unknown | Unknown | SD |
| Page: 1 2 3 4 5 6 |
Top |
Related drugs of malignant transformation related genes |
| Identification of chemicals and drugs interact with genes involved in malignant transfromation |
| (DGIdb 4.0) |
| Entrez ID | Symbol | Category | Interaction Types | Drug Claim Name | Drug Name | PMIDs |
| 3872 | KRT17 | NA | IFN | 7516473 | ||
| 3872 | KRT17 | NA | TCDD | 9036934 |
| Page: 1 |

Copyright 2023-Present -The University of Texas Health Science Center at Houston |