| Tissue | Expression Dynamics | Abbreviation |
| Breast |  | IDC: Invasive ductal carcinoma |
| DCIS: Ductal carcinoma in situ |
| Precancer(BRCA1-mut): Precancerous lesion from BRCA1 mutation carriers |
| Cervix | 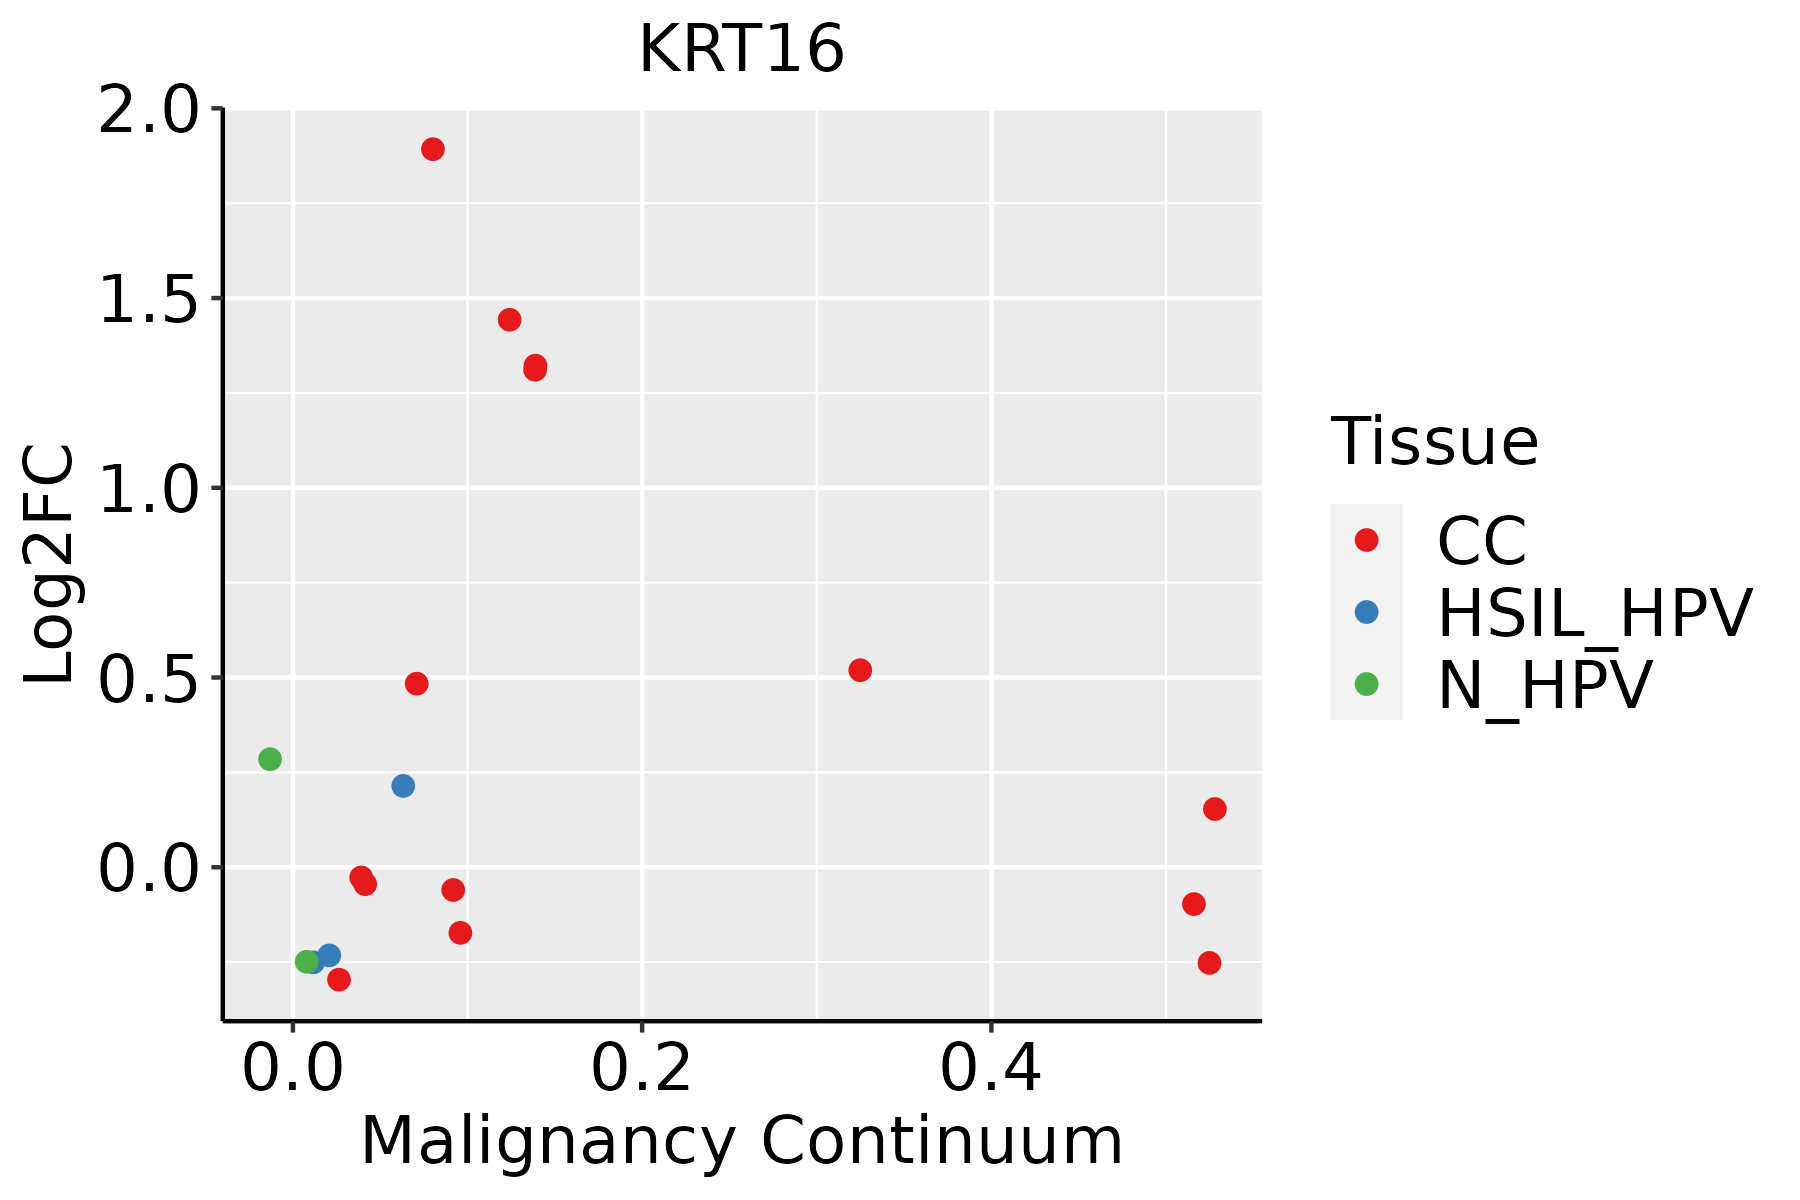 | CC: Cervix cancer |
| HSIL_HPV: HPV-infected high-grade squamous intraepithelial lesions |
| N_HPV: HPV-infected normal cervix |
| Esophagus | 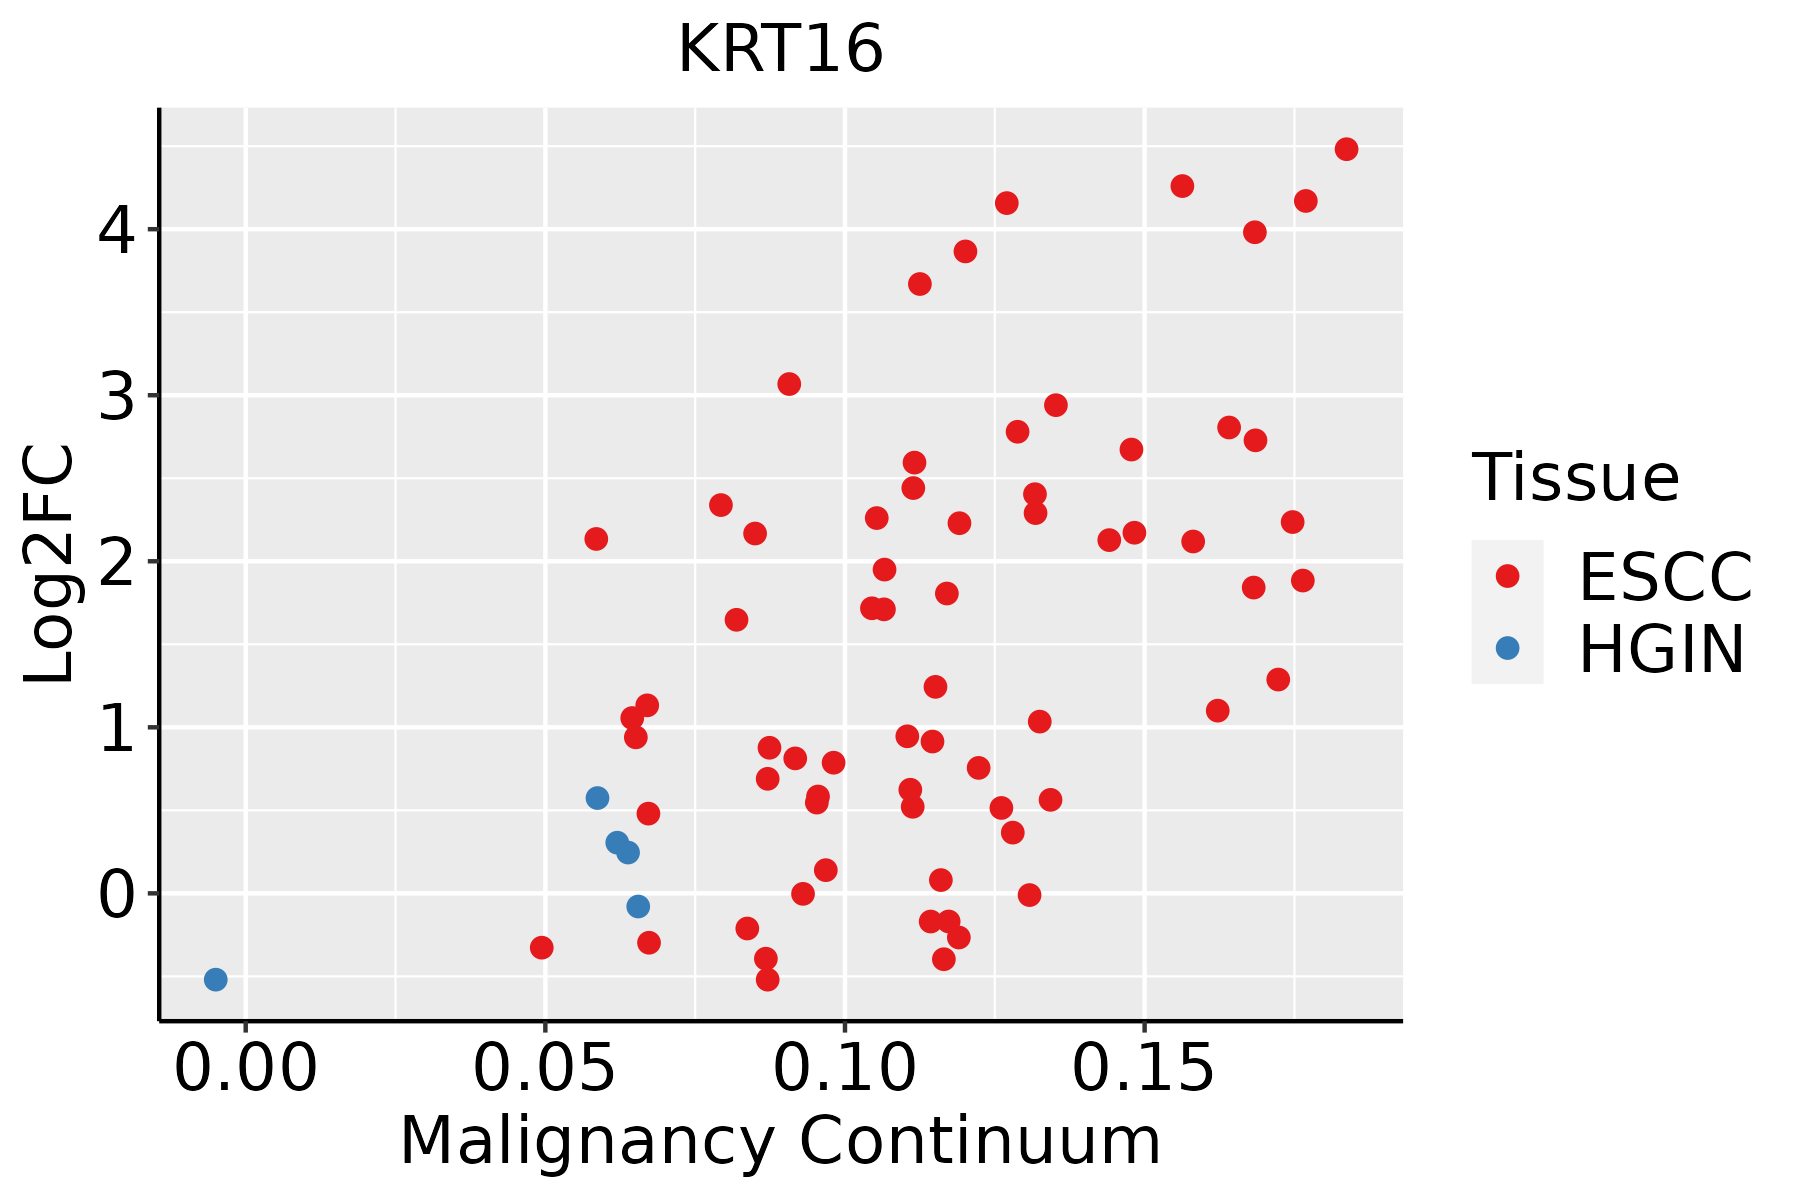 | ESCC: Esophageal squamous cell carcinoma |
| HGIN: High-grade intraepithelial neoplasias |
| LGIN: Low-grade intraepithelial neoplasias |
| Oral Cavity | 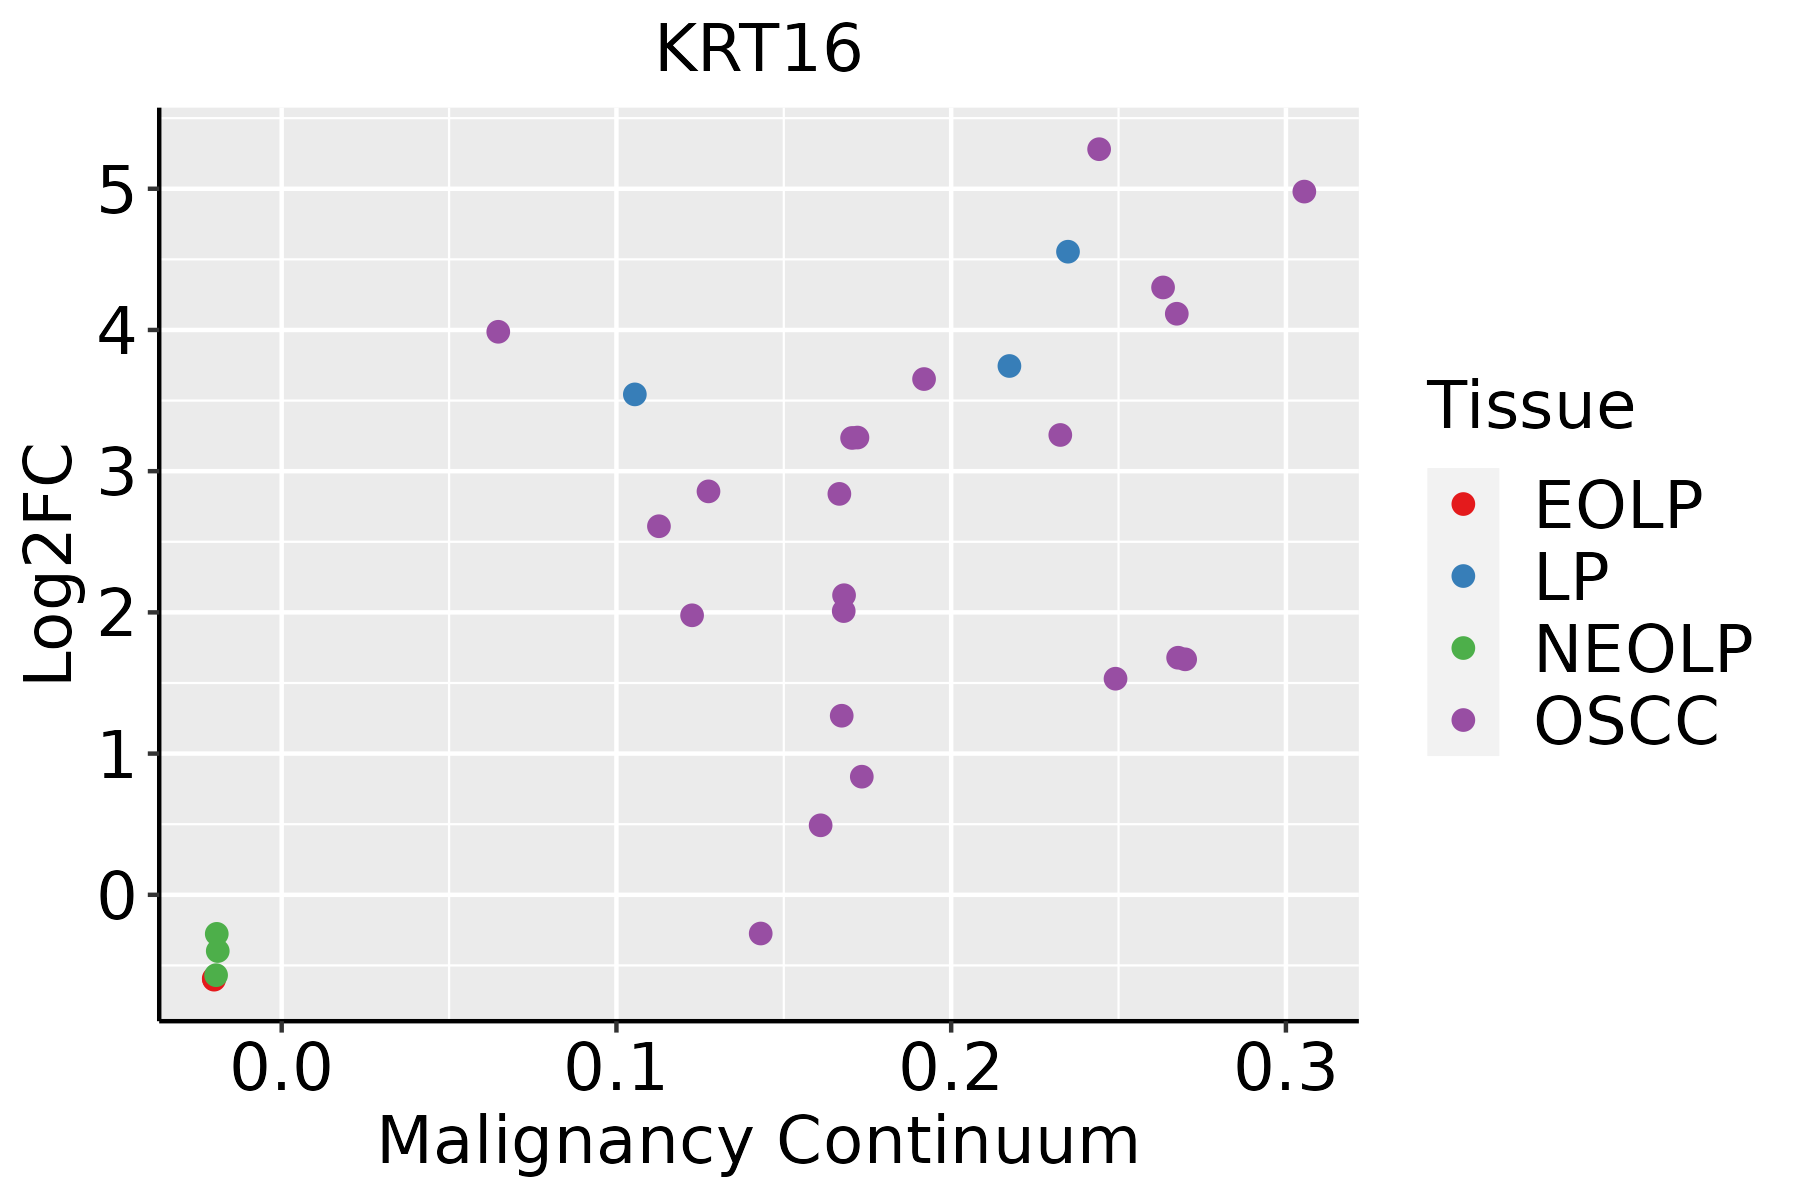 | EOLP: Erosive Oral lichen planus |
| LP: leukoplakia |
| NEOLP: Non-erosive oral lichen planus |
| OSCC: Oral squamous cell carcinoma |
| Prostate |  | BPH: Benign Prostatic Hyperplasia |
| Skin |  | AK: Actinic keratosis |
| cSCC: Cutaneous squamous cell carcinoma |
| SCCIS:squamous cell carcinoma in situ |
| GO ID | Tissue | Disease Stage | Description | Gene Ratio | Bg Ratio | pvalue | p.adjust | Count |
| GO:00075688 | Breast | Precancer | aging | 41/1080 | 339/18723 | 5.95e-06 | 1.71e-04 | 41 |
| GO:00106319 | Breast | Precancer | epithelial cell migration | 40/1080 | 357/18723 | 4.57e-05 | 9.71e-04 | 40 |
| GO:00901329 | Breast | Precancer | epithelium migration | 40/1080 | 360/18723 | 5.51e-05 | 1.14e-03 | 40 |
| GO:00901309 | Breast | Precancer | tissue migration | 40/1080 | 365/18723 | 7.48e-05 | 1.47e-03 | 40 |
| GO:0045104 | Breast | Precancer | intermediate filament cytoskeleton organization | 11/1080 | 51/18723 | 1.26e-04 | 2.22e-03 | 11 |
| GO:0045103 | Breast | Precancer | intermediate filament-based process | 11/1080 | 52/18723 | 1.52e-04 | 2.60e-03 | 11 |
| GO:00508789 | Breast | Precancer | regulation of body fluid levels | 40/1080 | 379/18723 | 1.68e-04 | 2.77e-03 | 40 |
| GO:00016678 | Breast | Precancer | ameboidal-type cell migration | 47/1080 | 475/18723 | 2.19e-04 | 3.35e-03 | 47 |
| GO:00085445 | Breast | Precancer | epidermis development | 35/1080 | 324/18723 | 2.71e-04 | 3.96e-03 | 35 |
| GO:00099136 | Breast | Precancer | epidermal cell differentiation | 23/1080 | 202/18723 | 1.43e-03 | 1.50e-02 | 23 |
| GO:00302163 | Breast | Precancer | keratinocyte differentiation | 17/1080 | 139/18723 | 2.71e-03 | 2.39e-02 | 17 |
| GO:000756813 | Breast | IDC | aging | 52/1434 | 339/18723 | 1.14e-06 | 5.10e-05 | 52 |
| GO:000166714 | Breast | IDC | ameboidal-type cell migration | 64/1434 | 475/18723 | 6.65e-06 | 2.05e-04 | 64 |
| GO:001063112 | Breast | IDC | epithelial cell migration | 51/1434 | 357/18723 | 1.14e-05 | 3.08e-04 | 51 |
| GO:009013212 | Breast | IDC | epithelium migration | 51/1434 | 360/18723 | 1.44e-05 | 3.70e-04 | 51 |
| GO:009013012 | Breast | IDC | tissue migration | 51/1434 | 365/18723 | 2.11e-05 | 5.11e-04 | 51 |
| GO:005087813 | Breast | IDC | regulation of body fluid levels | 50/1434 | 379/18723 | 1.12e-04 | 2.10e-03 | 50 |
| GO:00512712 | Breast | IDC | negative regulation of cellular component movement | 48/1434 | 367/18723 | 1.88e-04 | 3.12e-03 | 48 |
| GO:20001462 | Breast | IDC | negative regulation of cell motility | 46/1434 | 359/18723 | 4.01e-04 | 5.60e-03 | 46 |
| GO:00303362 | Breast | IDC | negative regulation of cell migration | 43/1434 | 344/18723 | 1.01e-03 | 1.13e-02 | 43 |
| Pathway ID | Tissue | Disease Stage | Description | Gene Ratio | Bg Ratio | pvalue | p.adjust | qvalue | Count |
| hsa0491518 | Breast | Precancer | Estrogen signaling pathway | 28/684 | 138/8465 | 4.10e-06 | 5.39e-05 | 4.13e-05 | 28 |
| hsa0491519 | Breast | Precancer | Estrogen signaling pathway | 28/684 | 138/8465 | 4.10e-06 | 5.39e-05 | 4.13e-05 | 28 |
| hsa0491523 | Breast | IDC | Estrogen signaling pathway | 35/867 | 138/8465 | 2.55e-07 | 5.18e-06 | 3.88e-06 | 35 |
| hsa0491533 | Breast | IDC | Estrogen signaling pathway | 35/867 | 138/8465 | 2.55e-07 | 5.18e-06 | 3.88e-06 | 35 |
| hsa0491542 | Breast | DCIS | Estrogen signaling pathway | 35/846 | 138/8465 | 1.40e-07 | 2.51e-06 | 1.85e-06 | 35 |
| hsa05150 | Breast | DCIS | Staphylococcus aureus infection | 19/846 | 96/8465 | 2.68e-03 | 1.67e-02 | 1.23e-02 | 19 |
| hsa0491552 | Breast | DCIS | Estrogen signaling pathway | 35/846 | 138/8465 | 1.40e-07 | 2.51e-06 | 1.85e-06 | 35 |
| hsa051501 | Breast | DCIS | Staphylococcus aureus infection | 19/846 | 96/8465 | 2.68e-03 | 1.67e-02 | 1.23e-02 | 19 |
| hsa0491520 | Cervix | CC | Estrogen signaling pathway | 44/1267 | 138/8465 | 3.55e-07 | 3.97e-06 | 2.35e-06 | 44 |
| hsa04915110 | Cervix | CC | Estrogen signaling pathway | 44/1267 | 138/8465 | 3.55e-07 | 3.97e-06 | 2.35e-06 | 44 |
| hsa051504 | Cervix | HSIL_HPV | Staphylococcus aureus infection | 21/459 | 96/8465 | 2.93e-08 | 1.43e-06 | 1.16e-06 | 21 |
| hsa0491524 | Cervix | HSIL_HPV | Estrogen signaling pathway | 19/459 | 138/8465 | 1.54e-04 | 1.74e-03 | 1.40e-03 | 19 |
| hsa0515011 | Cervix | HSIL_HPV | Staphylococcus aureus infection | 21/459 | 96/8465 | 2.93e-08 | 1.43e-06 | 1.16e-06 | 21 |
| hsa0491534 | Cervix | HSIL_HPV | Estrogen signaling pathway | 19/459 | 138/8465 | 1.54e-04 | 1.74e-03 | 1.40e-03 | 19 |
| hsa0491529 | Oral cavity | EOLP | Estrogen signaling pathway | 38/1218 | 138/8465 | 3.78e-05 | 1.82e-04 | 1.07e-04 | 38 |
| hsa04915113 | Oral cavity | EOLP | Estrogen signaling pathway | 38/1218 | 138/8465 | 3.78e-05 | 1.82e-04 | 1.07e-04 | 38 |
| hsa04915210 | Oral cavity | NEOLP | Estrogen signaling pathway | 29/1112 | 138/8465 | 6.33e-03 | 2.34e-02 | 1.47e-02 | 29 |
| hsa0491537 | Oral cavity | NEOLP | Estrogen signaling pathway | 29/1112 | 138/8465 | 6.33e-03 | 2.34e-02 | 1.47e-02 | 29 |
| hsa0491527 | Prostate | BPH | Estrogen signaling pathway | 48/1718 | 138/8465 | 4.60e-05 | 3.16e-04 | 1.96e-04 | 48 |
| hsa04915112 | Prostate | BPH | Estrogen signaling pathway | 48/1718 | 138/8465 | 4.60e-05 | 3.16e-04 | 1.96e-04 | 48 |
| Hugo Symbol | Variant Class | Variant Classification | dbSNP RS | HGVSc | HGVSp | HGVSp Short | SWISSPROT | BIOTYPE | SIFT | PolyPhen | Tumor Sample Barcode | Tissue | Histology | Sex | Age | Stage | Therapy Types | Drugs | Outcome |
| KRT16 | SNV | Missense_Mutation | rs765819730 | c.956N>C | p.Val319Ala | p.V319A | P08779 | protein_coding | deleterious(0.05) | possibly_damaging(0.631) | TCGA-LL-A9Q3-01 | Breast | breast invasive carcinoma | Female | >=65 | III/IV | Immunotherapy | herceptin | CR |
| KRT16 | insertion | Nonsense_Mutation | novel | c.1080_1081insATATATATATAAATAAAATACAC | p.Leu361IlefsTer4 | p.L361Ifs*4 | P08779 | protein_coding | | | TCGA-A8-A06O-01 | Breast | breast invasive carcinoma | Female | <65 | I/II | Hormone Therapy | letrozole | SD |
| KRT16 | insertion | Frame_Shift_Ins | novel | c.1078_1079insTATATACATTTAT | p.Ser360IlefsTer37 | p.S360Ifs*37 | P08779 | protein_coding | | | TCGA-A8-A06O-01 | Breast | breast invasive carcinoma | Female | <65 | I/II | Hormone Therapy | letrozole | SD |
| KRT16 | insertion | Nonsense_Mutation | novel | c.960_961insACGTGTGACGAGTGCAACTCAGTGCAATTCAGTATATGAAACATTCA | p.Ser321ThrfsTer13 | p.S321Tfs*13 | P08779 | protein_coding | | | TCGA-B6-A1KF-01 | Breast | breast invasive carcinoma | Female | >=65 | I/II | Unknown | Unknown | SD |
| KRT16 | SNV | Missense_Mutation | | c.304T>G | p.Phe102Val | p.F102V | P08779 | protein_coding | tolerated(0.26) | benign(0.011) | TCGA-C5-A7CO-01 | Cervix | cervical & endocervical cancer | Female | >=65 | I/II | Chemotherapy | cisplatin | SD |
| KRT16 | SNV | Missense_Mutation | novel | c.1124N>A | p.Ile375Asn | p.I375N | P08779 | protein_coding | deleterious(0) | probably_damaging(0.992) | TCGA-VS-A9UI-01 | Cervix | cervical & endocervical cancer | Female | >=65 | I/II | Unknown | Unknown | SD |
| KRT16 | SNV | Missense_Mutation | rs764661195 | c.1358G>A | p.Arg453His | p.R453H | P08779 | protein_coding | tolerated(0.1) | benign(0) | TCGA-AA-3947-01 | Colorectum | colon adenocarcinoma | Female | <65 | I/II | Unknown | Unknown | SD |
| KRT16 | SNV | Missense_Mutation | novel | c.22N>C | p.Phe8Leu | p.F8L | P08779 | protein_coding | tolerated(0.07) | benign(0.066) | TCGA-AA-A00N-01 | Colorectum | colon adenocarcinoma | Male | >=65 | I/II | Unknown | Unknown | PD |
| KRT16 | SNV | Missense_Mutation | | c.73N>T | p.Gly25Trp | p.G25W | P08779 | protein_coding | deleterious(0) | benign(0) | TCGA-CM-5344-01 | Colorectum | colon adenocarcinoma | Female | <65 | III/IV | Chemotherapy | oxaliplatin | SD |
| KRT16 | SNV | Missense_Mutation | | c.86N>A | p.Ser29Asn | p.S29N | P08779 | protein_coding | deleterious(0.01) | benign(0.136) | TCGA-D5-6932-01 | Colorectum | colon adenocarcinoma | Male | >=65 | I/II | Unknown | Unknown | SD |


