
|
|||||
|
 | |
| |
| |
| |
| |
| |
|
Gene: KRT15 |
Gene summary for KRT15 |
| Gene information | Species | Human | Gene symbol | KRT15 | Gene ID | 3866 |
| Gene name | keratin 15 | |
| Gene Alias | CK15 | |
| Cytomap | 17q21.2 | |
| Gene Type | protein-coding | GO ID | GO:0006996 | UniProtAcc | B3KVF5 |
Top |
Malignant transformation analysis |
| Identification of the aberrant gene expression in precancerous and cancerous lesions by comparing the gene expression of stem-like cells in diseased tissues with normal stem cells |
| Entrez ID | Symbol | Replicates | Species | Organ | Tissue | Adj P-value | Log2FC | Malignancy |
| 3866 | KRT15 | GSM4909285 | Human | Breast | IDC | 4.21e-21 | -7.41e-01 | 0.21 |
| 3866 | KRT15 | GSM4909286 | Human | Breast | IDC | 1.47e-33 | 8.96e-01 | 0.1081 |
| 3866 | KRT15 | GSM4909290 | Human | Breast | IDC | 4.99e-16 | -7.43e-01 | 0.2096 |
| 3866 | KRT15 | GSM4909291 | Human | Breast | IDC | 1.42e-22 | -8.54e-01 | 0.1753 |
| 3866 | KRT15 | GSM4909292 | Human | Breast | IDC | 3.28e-02 | -7.98e-01 | 0.1236 |
| 3866 | KRT15 | GSM4909293 | Human | Breast | IDC | 2.68e-14 | -5.01e-01 | 0.1581 |
| 3866 | KRT15 | GSM4909294 | Human | Breast | IDC | 8.99e-18 | -5.81e-01 | 0.2022 |
| 3866 | KRT15 | GSM4909295 | Human | Breast | IDC | 1.66e-21 | 9.45e-01 | 0.0898 |
| 3866 | KRT15 | GSM4909296 | Human | Breast | IDC | 1.82e-23 | -7.41e-01 | 0.1524 |
| 3866 | KRT15 | GSM4909297 | Human | Breast | IDC | 3.77e-17 | -4.77e-01 | 0.1517 |
| 3866 | KRT15 | GSM4909298 | Human | Breast | IDC | 1.26e-18 | -5.83e-01 | 0.1551 |
| 3866 | KRT15 | GSM4909299 | Human | Breast | IDC | 4.77e-65 | 1.11e+00 | 0.035 |
| 3866 | KRT15 | GSM4909300 | Human | Breast | IDC | 2.69e-13 | 8.32e-01 | 0.0334 |
| 3866 | KRT15 | GSM4909301 | Human | Breast | IDC | 6.06e-35 | -8.16e-01 | 0.1577 |
| 3866 | KRT15 | GSM4909304 | Human | Breast | IDC | 6.32e-25 | -7.71e-01 | 0.1636 |
| 3866 | KRT15 | GSM4909305 | Human | Breast | IDC | 4.08e-10 | 6.65e-01 | 0.0436 |
| 3866 | KRT15 | GSM4909306 | Human | Breast | IDC | 1.14e-08 | -2.41e-01 | 0.1564 |
| 3866 | KRT15 | GSM4909307 | Human | Breast | IDC | 4.47e-08 | -2.81e-01 | 0.1569 |
| 3866 | KRT15 | GSM4909308 | Human | Breast | IDC | 2.10e-30 | -8.46e-01 | 0.158 |
| 3866 | KRT15 | GSM4909309 | Human | Breast | IDC | 5.39e-08 | 5.18e-01 | 0.0483 |
| Page: 1 2 3 4 5 6 7 8 9 10 11 |
| Tissue | Expression Dynamics | Abbreviation |
| Breast | 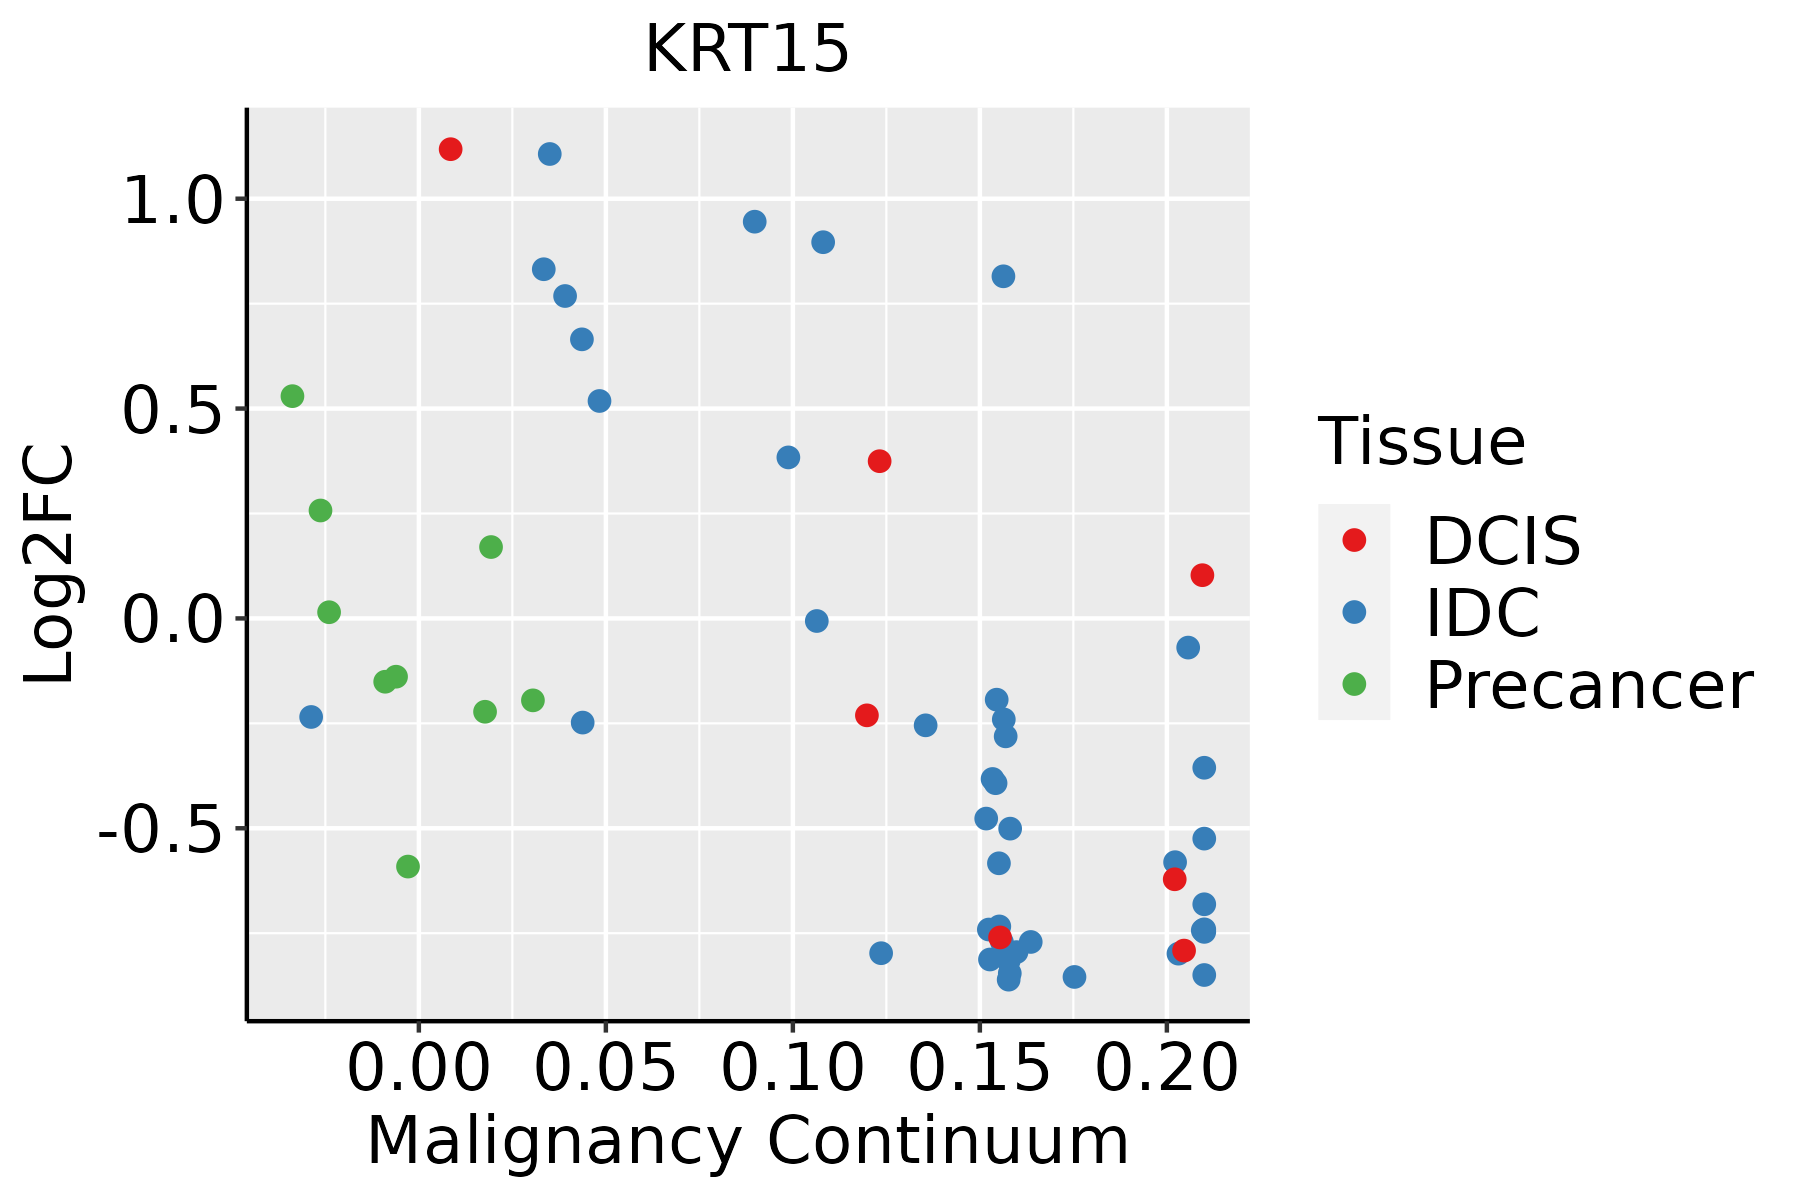 | IDC: Invasive ductal carcinoma |
| DCIS: Ductal carcinoma in situ | ||
| Precancer(BRCA1-mut): Precancerous lesion from BRCA1 mutation carriers | ||
| Cervix | 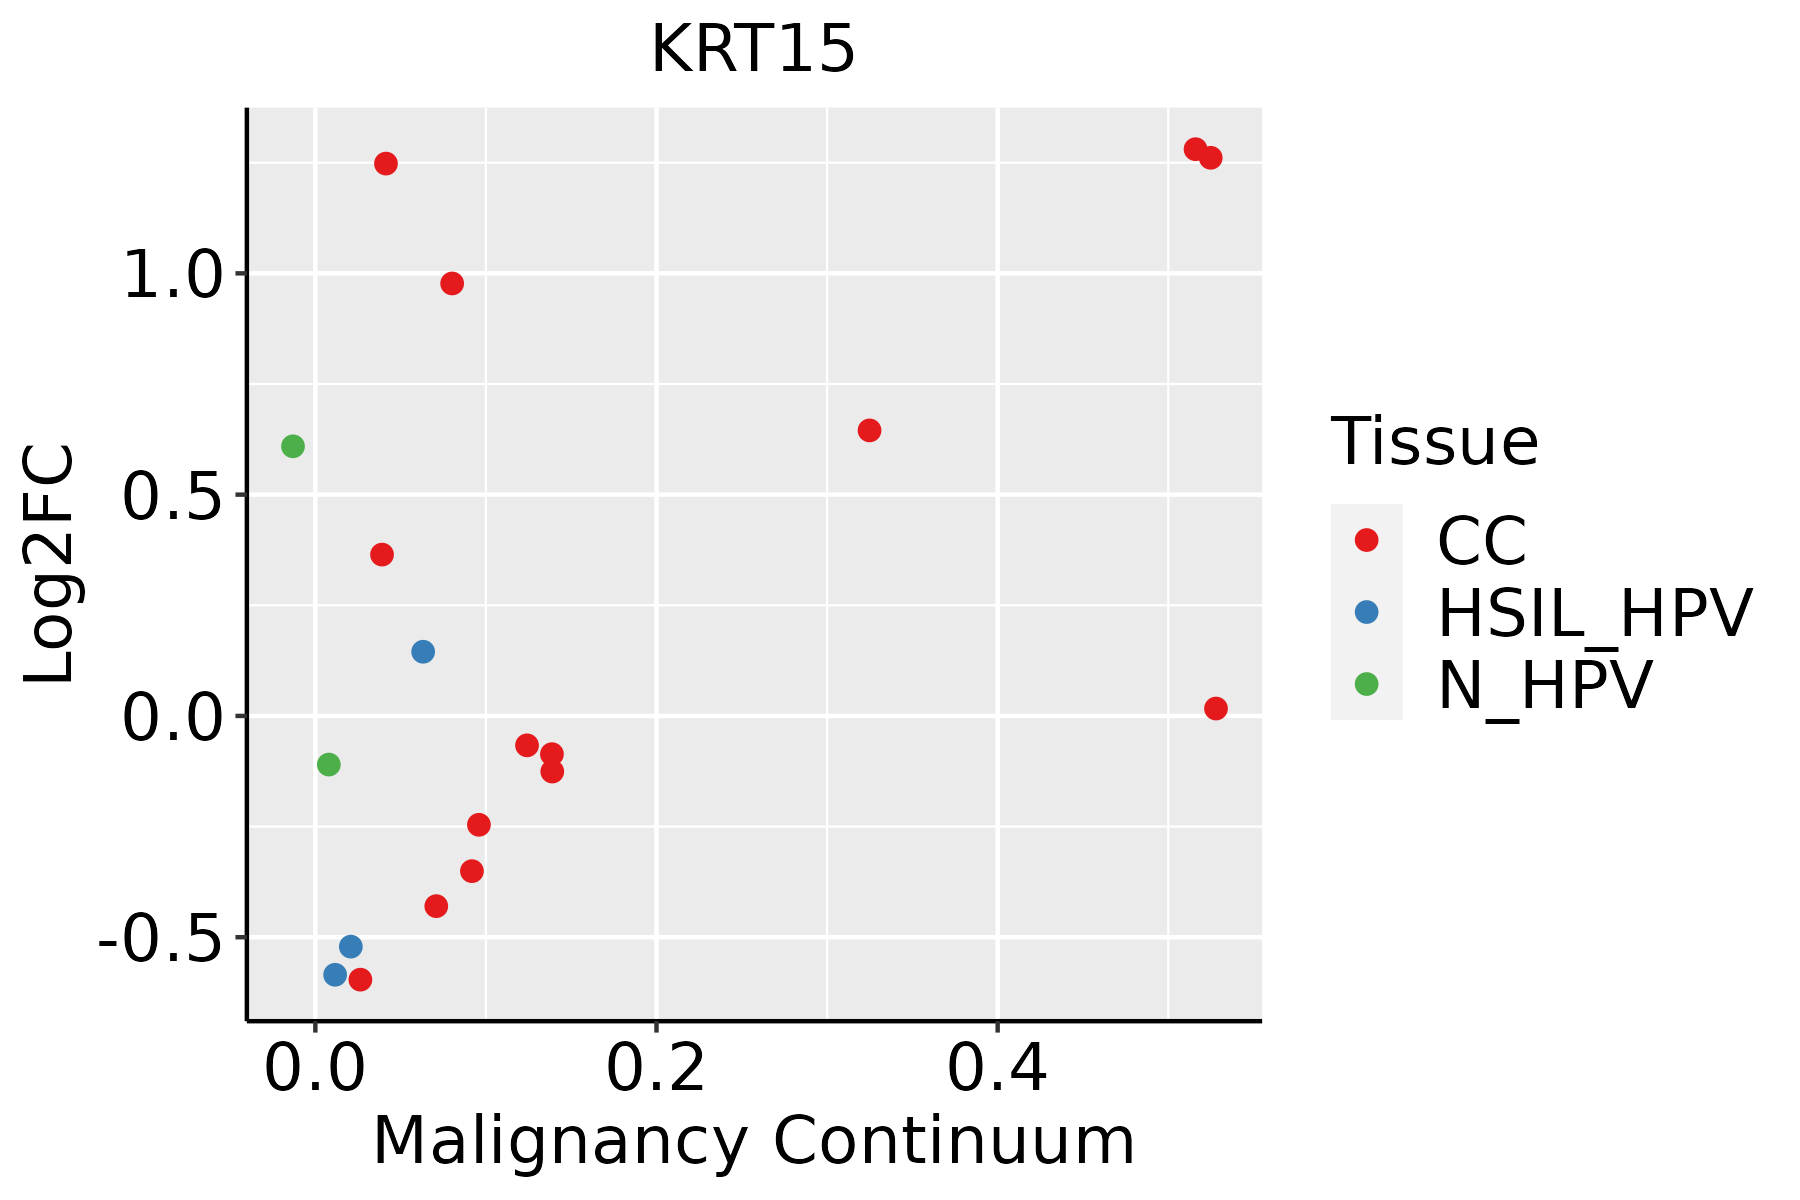 | CC: Cervix cancer |
| HSIL_HPV: HPV-infected high-grade squamous intraepithelial lesions | ||
| N_HPV: HPV-infected normal cervix | ||
| Esophagus |  | ESCC: Esophageal squamous cell carcinoma |
| HGIN: High-grade intraepithelial neoplasias | ||
| LGIN: Low-grade intraepithelial neoplasias | ||
| Liver |  | HCC: Hepatocellular carcinoma |
| NAFLD: Non-alcoholic fatty liver disease | ||
| Lung | 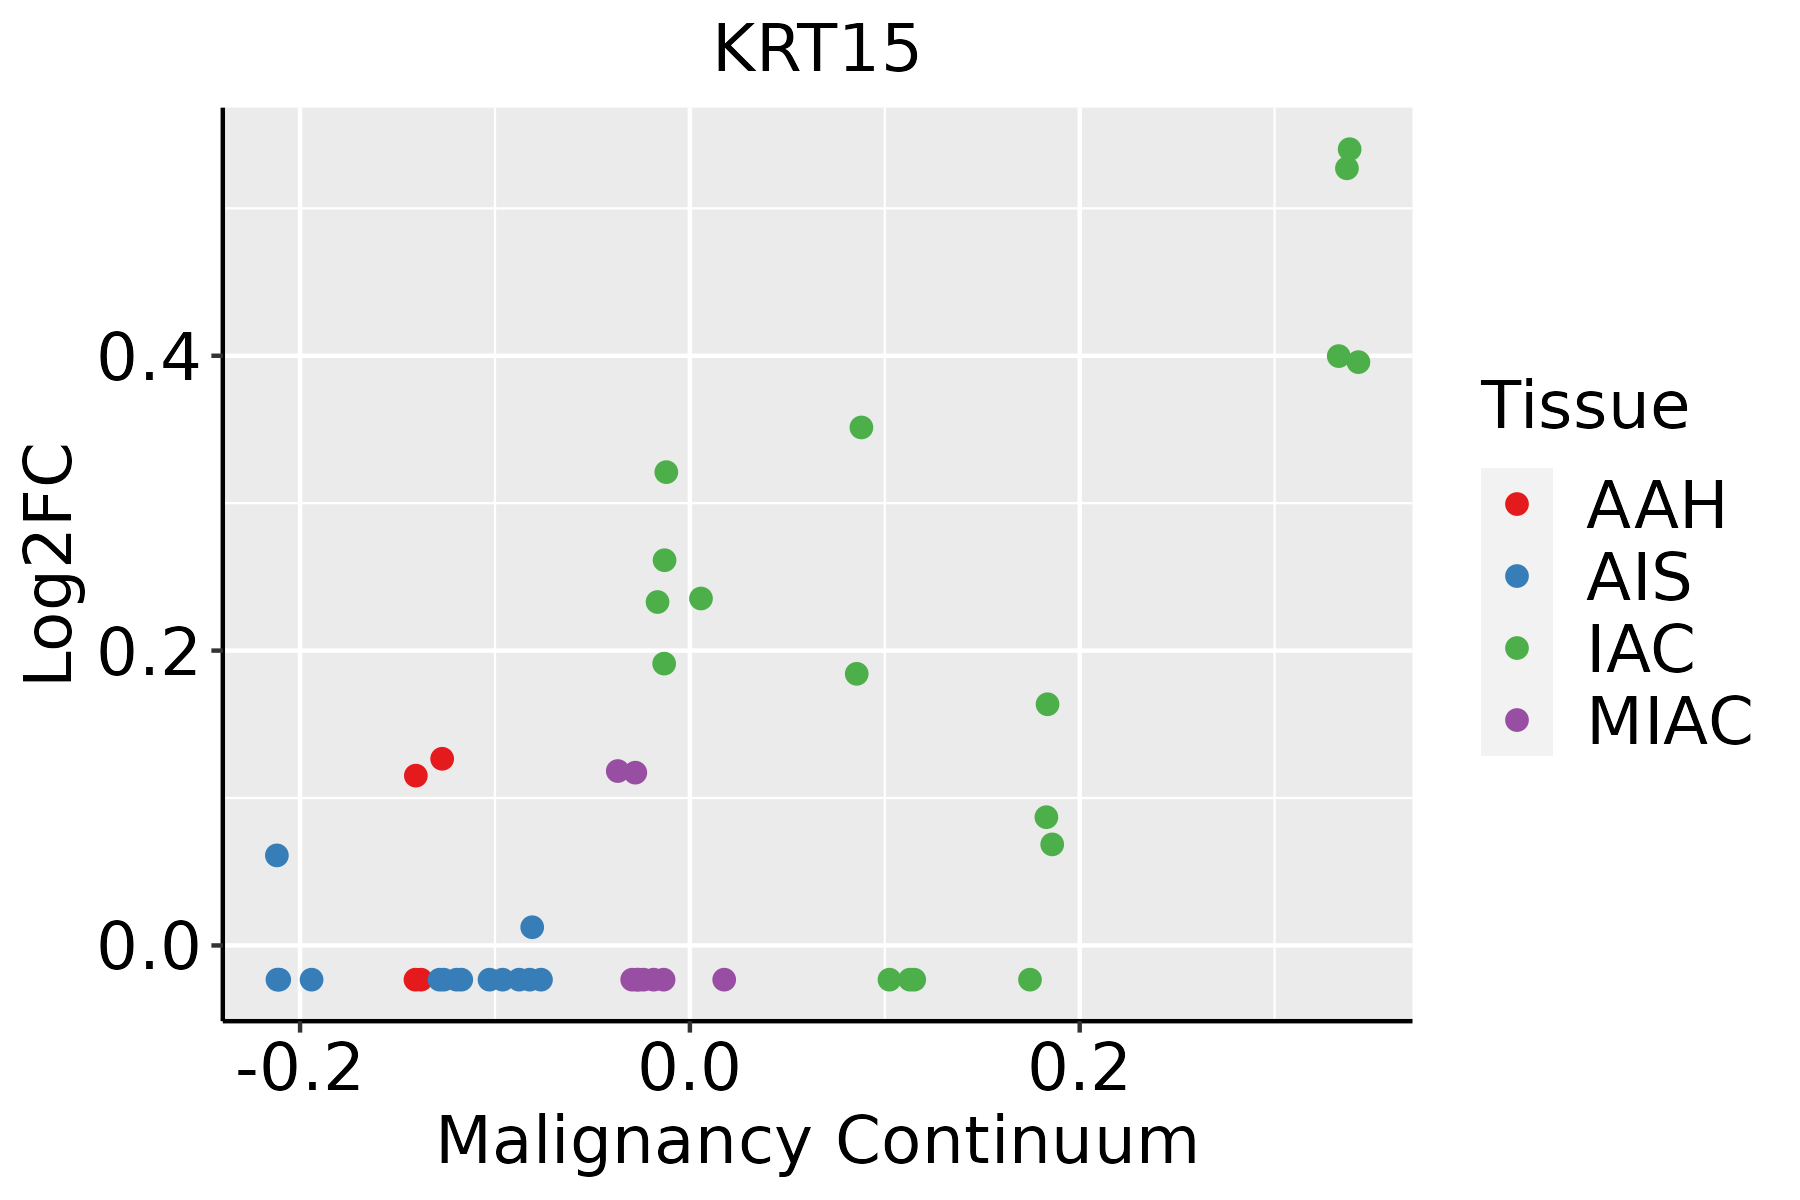 | AAH: Atypical adenomatous hyperplasia |
| AIS: Adenocarcinoma in situ | ||
| IAC: Invasive lung adenocarcinoma | ||
| MIA: Minimally invasive adenocarcinoma | ||
| Oral Cavity | 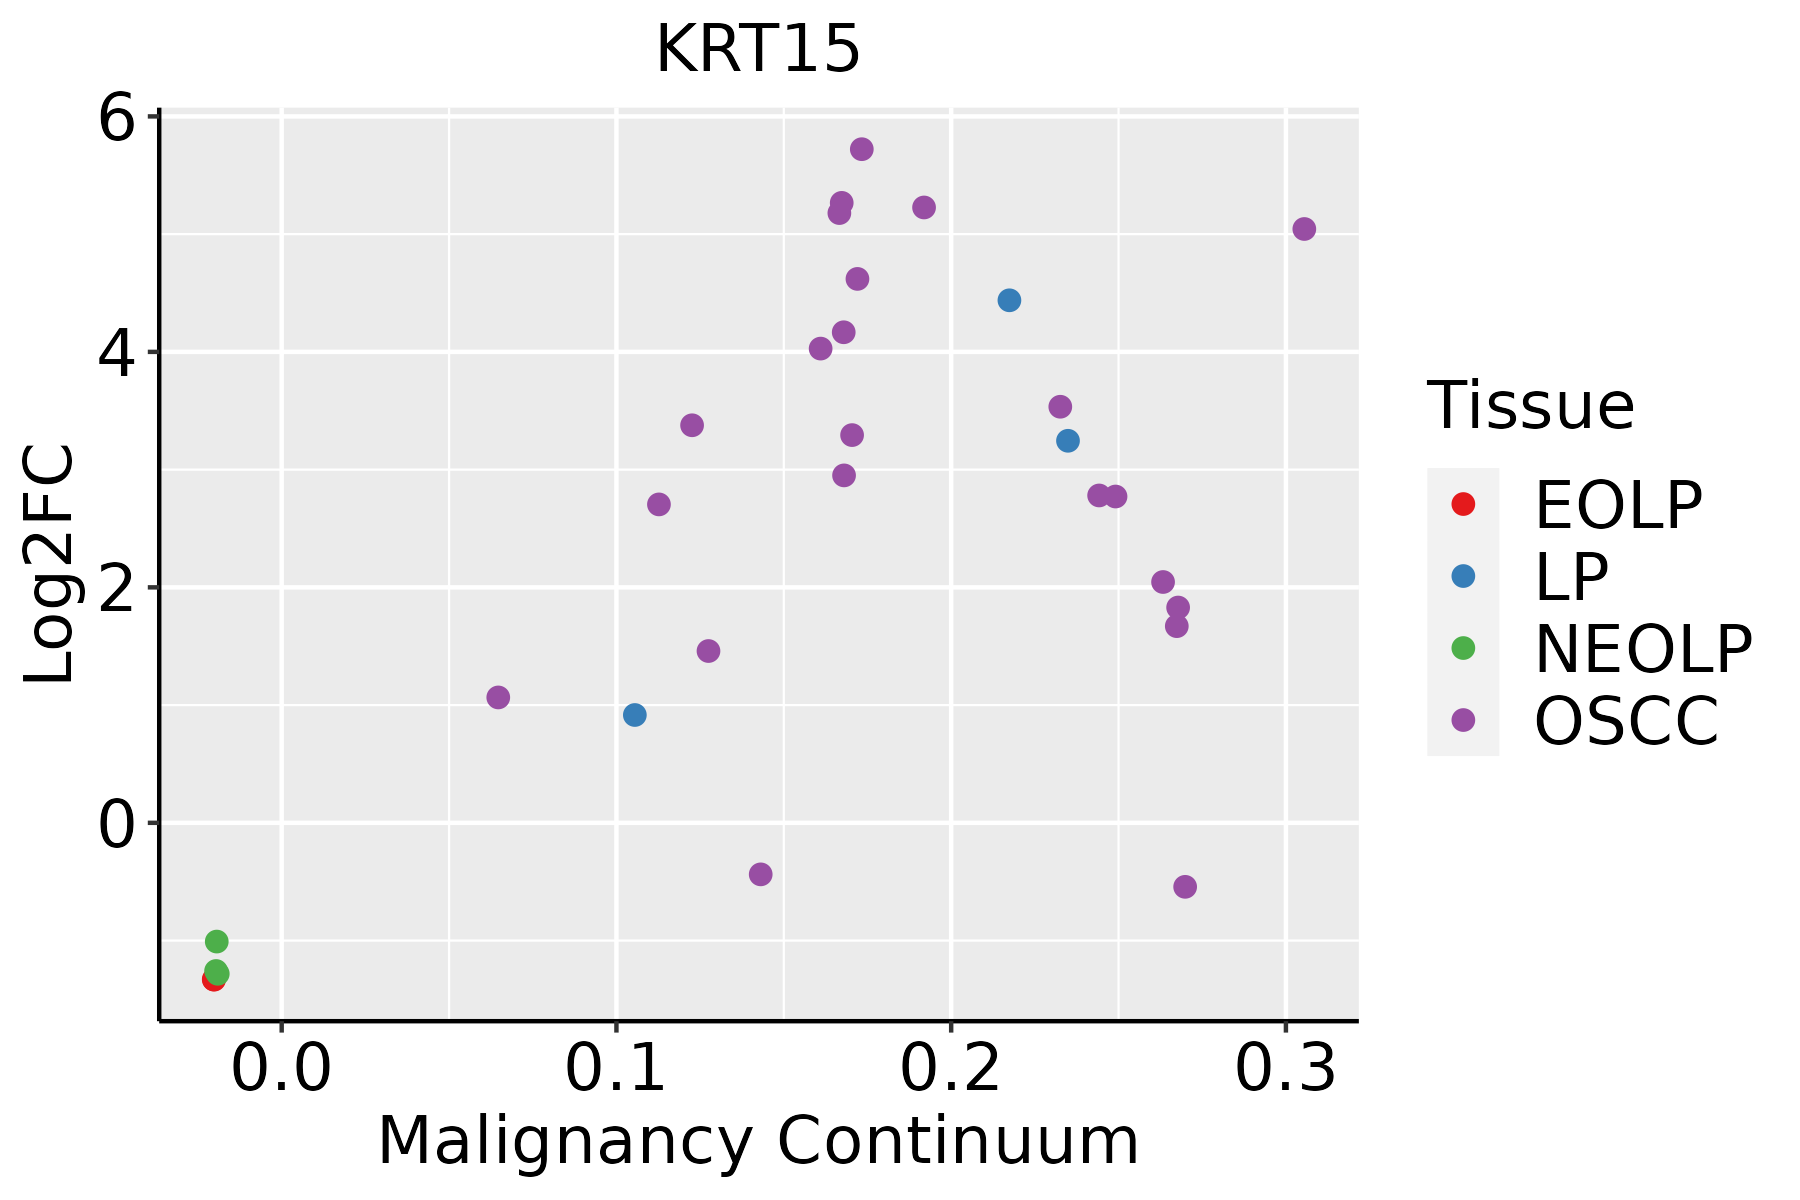 | EOLP: Erosive Oral lichen planus |
| LP: leukoplakia | ||
| NEOLP: Non-erosive oral lichen planus | ||
| OSCC: Oral squamous cell carcinoma | ||
| Prostate | 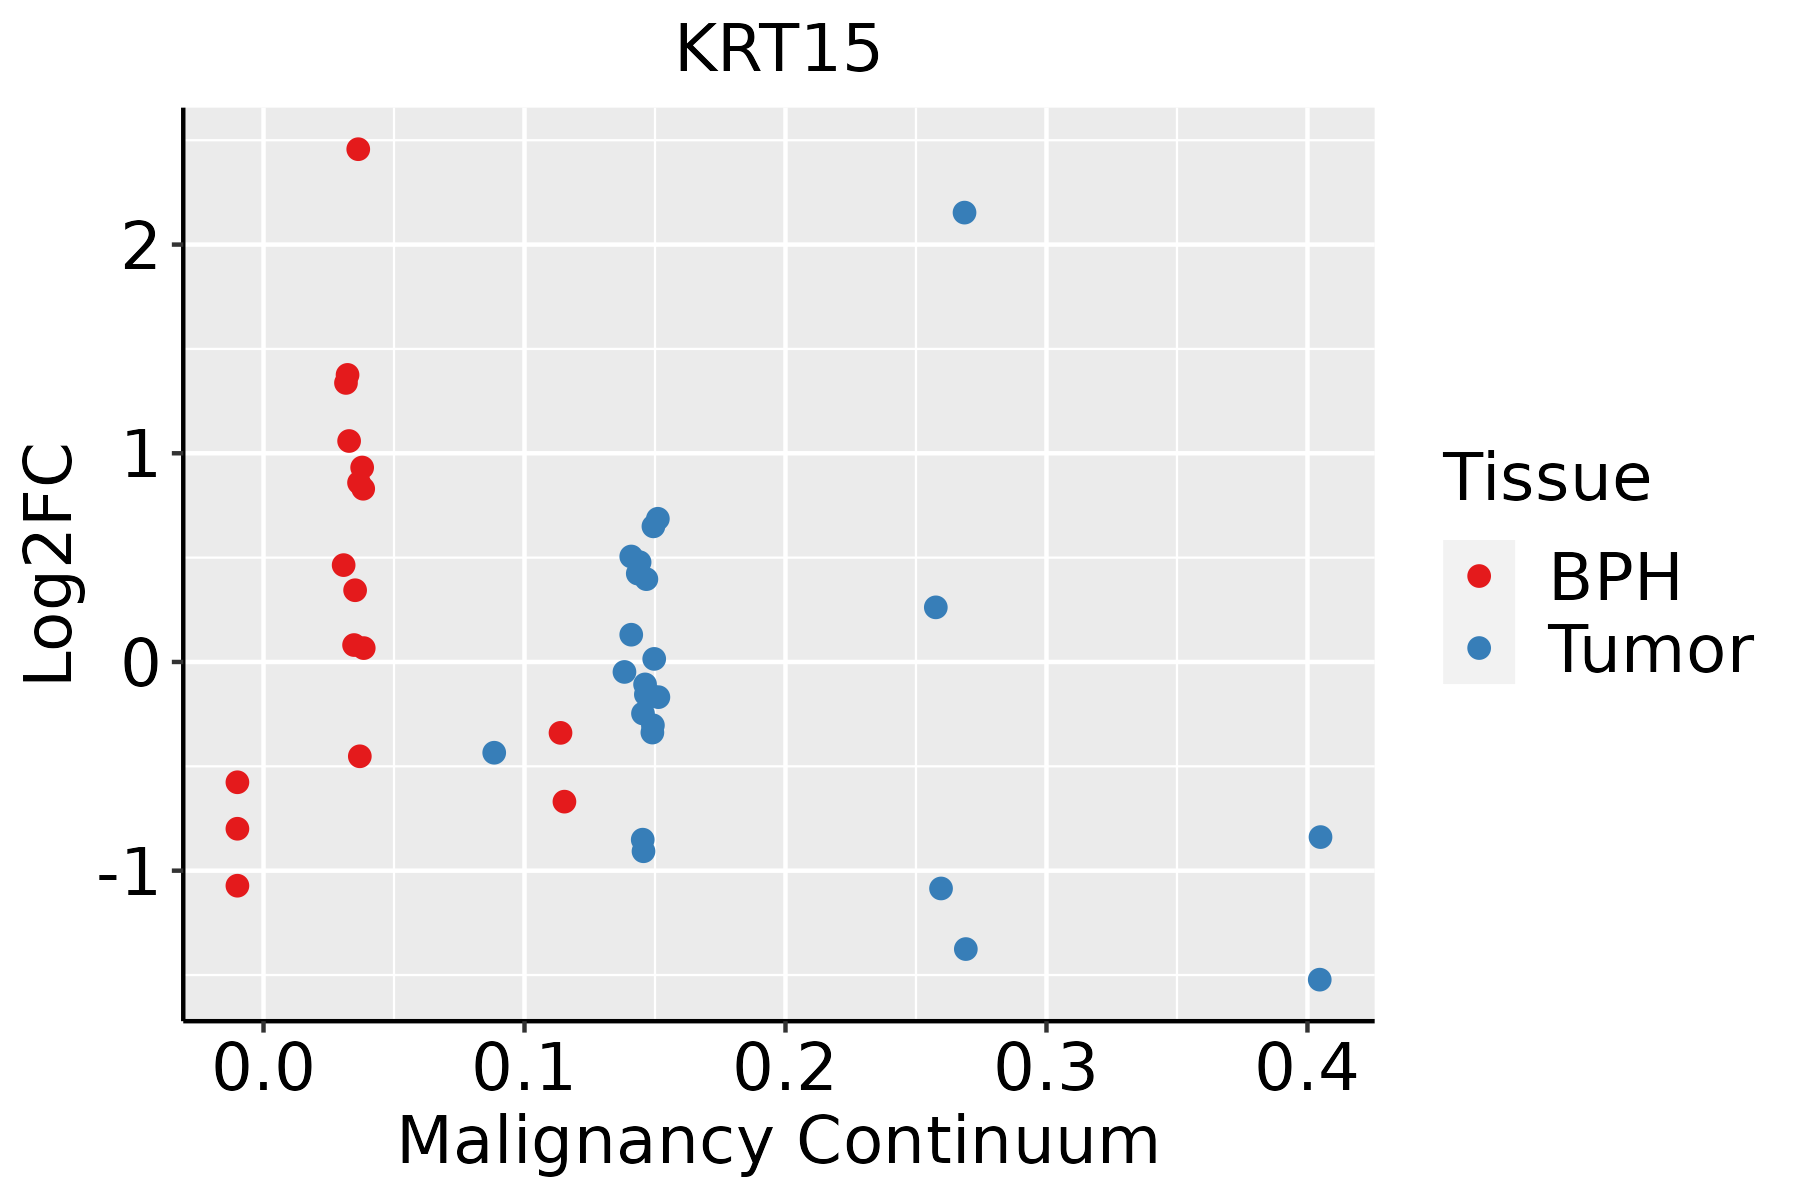 | BPH: Benign Prostatic Hyperplasia |
| Skin | 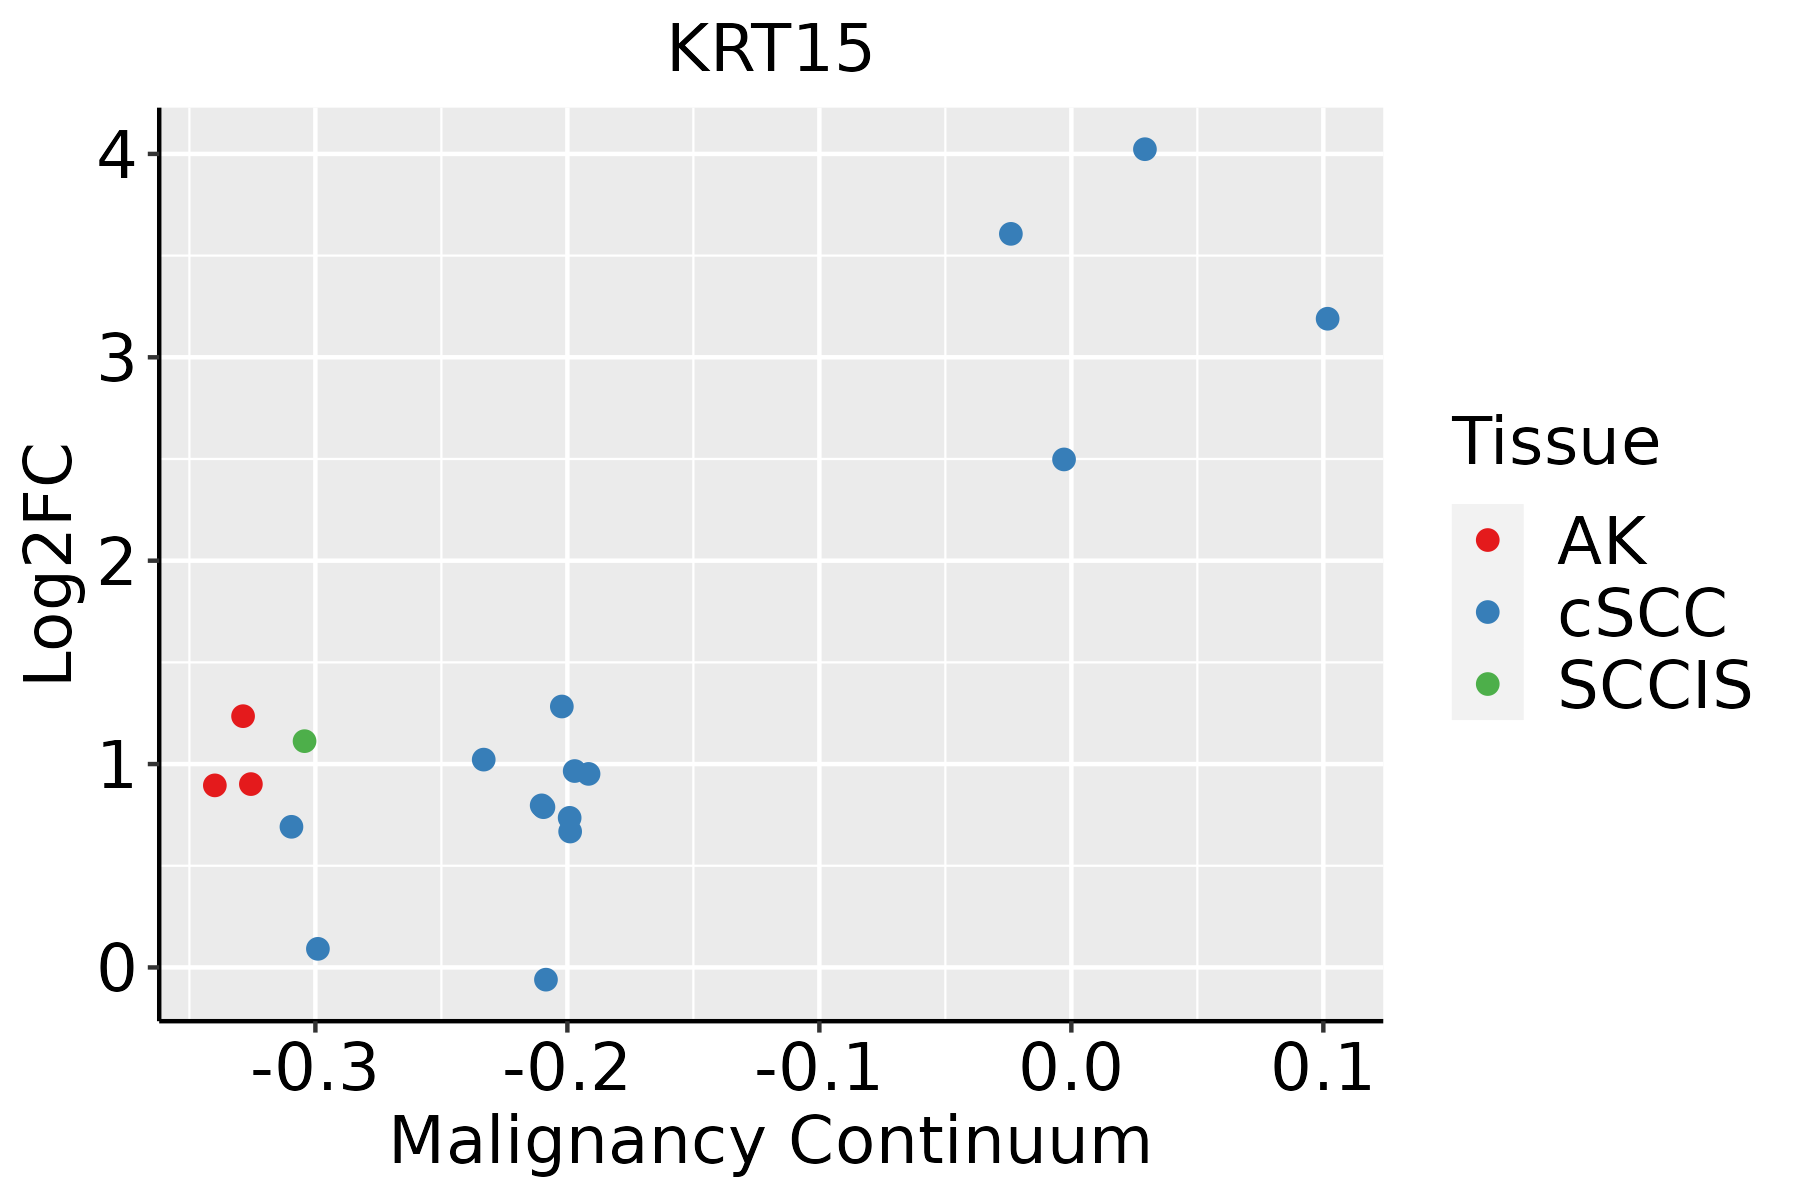 | AK: Actinic keratosis |
| cSCC: Cutaneous squamous cell carcinoma | ||
| SCCIS:squamous cell carcinoma in situ |
| ∗log2FC in expression of this searched gene in stem-like cells from each diseased tissue sample relative to stem-like cells in normal samples in each tissue plotted against the malignancy continuum. Samples are colored based on if they are from different disease stage. |
Top |
Malignant transformation related pathway analysis |
| Find out the enriched GO biological processes and KEGG pathways involved in transition from healthy to precancer to cancer |
| Tissue | Disease Stage | Enriched GO biological Processes |
| Colorectum | AD |  |
| Colorectum | SER |  |
| Colorectum | MSS |  |
| Colorectum | MSI-H |  |
| Colorectum | FAP |  |
| ∗Top 15 enriched GO BP terms are showed in the bar plot of each disease state in each tissue. Each row represents a significant GO biological process which is colored according to the -log10(p.adjust). |
| Page: 1 2 3 4 5 6 7 8 9 |
| GO ID | Tissue | Disease Stage | Description | Gene Ratio | Bg Ratio | pvalue | p.adjust | Count |
| GO:00085445 | Breast | Precancer | epidermis development | 35/1080 | 324/18723 | 2.71e-04 | 3.96e-03 | 35 |
| GO:000854412 | Breast | IDC | epidermis development | 41/1434 | 324/18723 | 1.03e-03 | 1.14e-02 | 41 |
| GO:000854422 | Breast | DCIS | epidermis development | 40/1390 | 324/18723 | 1.05e-03 | 1.16e-02 | 40 |
| GO:00085446 | Cervix | CC | epidermis development | 83/2311 | 324/18723 | 3.91e-11 | 8.54e-09 | 83 |
| GO:000854413 | Cervix | HSIL_HPV | epidermis development | 38/737 | 324/18723 | 1.92e-09 | 3.23e-07 | 38 |
| GO:000854423 | Cervix | N_HPV | epidermis development | 21/534 | 324/18723 | 4.32e-04 | 6.01e-03 | 21 |
| GO:000854410 | Esophagus | ESCC | epidermis development | 193/8552 | 324/18723 | 2.87e-07 | 4.19e-06 | 193 |
| GO:00085444 | Lung | IAC | epidermis development | 51/2061 | 324/18723 | 5.51e-03 | 4.11e-02 | 51 |
| GO:00085449 | Oral cavity | OSCC | epidermis development | 171/7305 | 324/18723 | 2.89e-07 | 4.43e-06 | 171 |
| GO:000854416 | Oral cavity | LP | epidermis development | 112/4623 | 324/18723 | 3.81e-05 | 5.61e-04 | 112 |
| GO:000854424 | Oral cavity | EOLP | epidermis development | 64/2218 | 324/18723 | 2.48e-05 | 3.68e-04 | 64 |
| GO:000854431 | Oral cavity | NEOLP | epidermis development | 57/2005 | 324/18723 | 1.13e-04 | 1.35e-03 | 57 |
| GO:00085448 | Prostate | BPH | epidermis development | 80/3107 | 324/18723 | 1.12e-04 | 1.02e-03 | 80 |
| GO:000854415 | Prostate | Tumor | epidermis development | 89/3246 | 324/18723 | 3.15e-06 | 5.18e-05 | 89 |
| GO:000854417 | Skin | AK | epidermis development | 79/1910 | 324/18723 | 1.04e-13 | 3.25e-11 | 79 |
| GO:000854418 | Skin | SCCIS | epidermis development | 40/919 | 324/18723 | 7.81e-08 | 1.15e-05 | 40 |
| GO:000854425 | Skin | cSCC | epidermis development | 131/4864 | 324/18723 | 7.38e-09 | 2.39e-07 | 131 |
| Page: 1 |
| Pathway ID | Tissue | Disease Stage | Description | Gene Ratio | Bg Ratio | pvalue | p.adjust | qvalue | Count |
| hsa0491518 | Breast | Precancer | Estrogen signaling pathway | 28/684 | 138/8465 | 4.10e-06 | 5.39e-05 | 4.13e-05 | 28 |
| hsa0491519 | Breast | Precancer | Estrogen signaling pathway | 28/684 | 138/8465 | 4.10e-06 | 5.39e-05 | 4.13e-05 | 28 |
| hsa0491523 | Breast | IDC | Estrogen signaling pathway | 35/867 | 138/8465 | 2.55e-07 | 5.18e-06 | 3.88e-06 | 35 |
| hsa0491533 | Breast | IDC | Estrogen signaling pathway | 35/867 | 138/8465 | 2.55e-07 | 5.18e-06 | 3.88e-06 | 35 |
| hsa0491542 | Breast | DCIS | Estrogen signaling pathway | 35/846 | 138/8465 | 1.40e-07 | 2.51e-06 | 1.85e-06 | 35 |
| hsa05150 | Breast | DCIS | Staphylococcus aureus infection | 19/846 | 96/8465 | 2.68e-03 | 1.67e-02 | 1.23e-02 | 19 |
| hsa0491552 | Breast | DCIS | Estrogen signaling pathway | 35/846 | 138/8465 | 1.40e-07 | 2.51e-06 | 1.85e-06 | 35 |
| hsa051501 | Breast | DCIS | Staphylococcus aureus infection | 19/846 | 96/8465 | 2.68e-03 | 1.67e-02 | 1.23e-02 | 19 |
| hsa0491520 | Cervix | CC | Estrogen signaling pathway | 44/1267 | 138/8465 | 3.55e-07 | 3.97e-06 | 2.35e-06 | 44 |
| hsa04915110 | Cervix | CC | Estrogen signaling pathway | 44/1267 | 138/8465 | 3.55e-07 | 3.97e-06 | 2.35e-06 | 44 |
| hsa051504 | Cervix | HSIL_HPV | Staphylococcus aureus infection | 21/459 | 96/8465 | 2.93e-08 | 1.43e-06 | 1.16e-06 | 21 |
| hsa0491524 | Cervix | HSIL_HPV | Estrogen signaling pathway | 19/459 | 138/8465 | 1.54e-04 | 1.74e-03 | 1.40e-03 | 19 |
| hsa0515011 | Cervix | HSIL_HPV | Staphylococcus aureus infection | 21/459 | 96/8465 | 2.93e-08 | 1.43e-06 | 1.16e-06 | 21 |
| hsa0491534 | Cervix | HSIL_HPV | Estrogen signaling pathway | 19/459 | 138/8465 | 1.54e-04 | 1.74e-03 | 1.40e-03 | 19 |
| hsa0491516 | Lung | IAC | Estrogen signaling pathway | 28/1053 | 138/8465 | 5.64e-03 | 2.45e-02 | 1.63e-02 | 28 |
| hsa0491517 | Lung | IAC | Estrogen signaling pathway | 28/1053 | 138/8465 | 5.64e-03 | 2.45e-02 | 1.63e-02 | 28 |
| hsa0491529 | Oral cavity | EOLP | Estrogen signaling pathway | 38/1218 | 138/8465 | 3.78e-05 | 1.82e-04 | 1.07e-04 | 38 |
| hsa04915113 | Oral cavity | EOLP | Estrogen signaling pathway | 38/1218 | 138/8465 | 3.78e-05 | 1.82e-04 | 1.07e-04 | 38 |
| hsa04915210 | Oral cavity | NEOLP | Estrogen signaling pathway | 29/1112 | 138/8465 | 6.33e-03 | 2.34e-02 | 1.47e-02 | 29 |
| hsa0491537 | Oral cavity | NEOLP | Estrogen signaling pathway | 29/1112 | 138/8465 | 6.33e-03 | 2.34e-02 | 1.47e-02 | 29 |
| Page: 1 2 |
Top |
Cell-cell communication analysis |
| Identification of potential cell-cell interactions between two cell types and their ligand-receptor pairs for different disease states |
| Ligand | Receptor | LRpair | Pathway | Tissue | Disease Stage |
| Page: 1 |
Top |
Single-cell gene regulatory network inference analysis |
| Find out the significant the regulons (TFs) and the target genes of each regulon across cell types for different disease states |
| TF | Cell Type | Tissue | Disease Stage | Target Gene | RSS | Regulon Activity |
| ∗The dot plots of a searched regulon are shown for all cell subpopulations in each disease state of each tissue based on the regulon specific score inferred using pySCENIC and by calculating the average expression. |
| Page: 1 |
Top |
Somatic mutation of malignant transformation related genes |
| Annotation of somatic variants for genes involved in malignant transformation |
| Hugo Symbol | Variant Class | Variant Classification | dbSNP RS | HGVSc | HGVSp | HGVSp Short | SWISSPROT | BIOTYPE | SIFT | PolyPhen | Tumor Sample Barcode | Tissue | Histology | Sex | Age | Stage | Therapy Types | Drugs | Outcome |
| KRT15 | insertion | Frame_Shift_Ins | novel | c.849_850insAGGAGTCAGGTGTGTGGGTGGTGGTGGT | p.Ala284ArgfsTer28 | p.A284Rfs*28 | P19012 | protein_coding | TCGA-A8-A09X-01 | Breast | breast invasive carcinoma | Female | <65 | III/IV | Unknown | Unknown | SD | ||
| KRT15 | SNV | Missense_Mutation | novel | c.361N>A | p.Asp121Asn | p.D121N | P19012 | protein_coding | deleterious(0.02) | possibly_damaging(0.58) | TCGA-2W-A8YY-01 | Cervix | cervical & endocervical cancer | Female | <65 | I/II | Chemotherapy | cisplatin | CR |
| KRT15 | SNV | Missense_Mutation | c.829N>C | p.Glu277Gln | p.E277Q | P19012 | protein_coding | deleterious(0) | probably_damaging(0.965) | TCGA-C5-A1MK-01 | Cervix | cervical & endocervical cancer | Female | >=65 | III/IV | Chemotherapy | carboplatin | PD | |
| KRT15 | SNV | Missense_Mutation | c.631N>T | p.Gly211Cys | p.G211C | P19012 | protein_coding | deleterious(0) | probably_damaging(0.999) | TCGA-DS-A1OA-01 | Cervix | cervical & endocervical cancer | Female | >=65 | I/II | Chemotherapy | carboplatin | PD | |
| KRT15 | SNV | Missense_Mutation | c.641G>A | p.Arg214Gln | p.R214Q | P19012 | protein_coding | deleterious(0) | possibly_damaging(0.54) | TCGA-IR-A3LI-01 | Cervix | cervical & endocervical cancer | Female | <65 | I/II | Chemotherapy | cisplatin | CR | |
| KRT15 | SNV | Missense_Mutation | novel | c.695N>A | p.Gly232Asp | p.G232D | P19012 | protein_coding | tolerated(0.06) | benign(0.048) | TCGA-AA-A02W-01 | Colorectum | colon adenocarcinoma | Female | >=65 | I/II | Unknown | Unknown | PD |
| KRT15 | SNV | Missense_Mutation | rs771994753 | c.1136N>A | p.Arg379Gln | p.R379Q | P19012 | protein_coding | deleterious(0) | probably_damaging(0.997) | TCGA-AZ-4315-01 | Colorectum | colon adenocarcinoma | Male | <65 | I/II | Unknown | Unknown | SD |
| KRT15 | SNV | Missense_Mutation | novel | c.119N>A | p.Gly40Glu | p.G40E | P19012 | protein_coding | deleterious(0.01) | probably_damaging(0.968) | TCGA-CA-6717-01 | Colorectum | colon adenocarcinoma | Male | <65 | I/II | Chemotherapy | oxaliplatin | CR |
| KRT15 | SNV | Missense_Mutation | novel | c.656T>C | p.Leu219Pro | p.L219P | P19012 | protein_coding | deleterious(0) | probably_damaging(0.999) | TCGA-F4-6856-01 | Colorectum | colon adenocarcinoma | Male | <65 | I/II | Ancillary | leucovorin | CR |
| KRT15 | SNV | Missense_Mutation | rs764246868 | c.454N>A | p.Asp152Asn | p.D152N | P19012 | protein_coding | deleterious(0.01) | possibly_damaging(0.801) | TCGA-AG-A002-01 | Colorectum | rectum adenocarcinoma | Male | <65 | I/II | Unknown | Unknown | SD |
| Page: 1 2 3 4 |
Top |
Related drugs of malignant transformation related genes |
| Identification of chemicals and drugs interact with genes involved in malignant transfromation |
| (DGIdb 4.0) |
| Entrez ID | Symbol | Category | Interaction Types | Drug Claim Name | Drug Name | PMIDs |
| Page: 1 |

Copyright 2023-Present -The University of Texas Health Science Center at Houston |